Comparing novice and expert modelers on a physics modeling task
Bachelor thesis Psychology
Author: Ewald T.A. Maas (s0075124) Supervisors: Dr. W. R. van Joolingen
W. Kenbeek MSc.
Table of contents
Method ...8
Participants ...8
Materials...8
Procedure ...9
Data collection and analysis ...9
Averaging window ...10
Coding and Inter-rater reliability ...10
Results ...13
Reasoning processes ...13
Modeling strategy ...14
Models ...18
Conclusion and discussion ...21
References ...24
Appendix A: Modelleertaak - „Broeikas Aarde: een leefbare temperatuur‟ ...27
Appendix B: Oefentaak Co-Lab – „De lekkende emmer‟ ...29
Appendix C: Coding scheme ...32
Appendix D: Averaging windows ...33
Appendix E: Modeling strategy experts ...35
Abstract
This exploratory study aims to answer the research question:
“Are there specific differences between novice and expert modelers on the general strategies they employ when building a physics model in an inquiry modeling environment?”
Introduction
In science, models are used to represent phenomena. By creating a model the scientist gains a greater understanding of the phenomenon and the problems related to it. Models also can act as a basis for discussion with others. This practice has been around since humans started solving scientific problems and is now further enhanced by using computers for model visualization purposes. Where scientists use models to understand scientific phenomena and related problems, students can benefit from using models in order to understand the subject matter at hand. Model building or simply put „modeling‟ therefore seems to be particularly useful in the educational system (Barowy & Laserna, 1997; Fretz, Wu, Zhang, Davis, Krajcik & Soloway, 2002; Justi & Gilbert, 2002; Penner, 2001). Although structural difficulties do occur during the modeling process as summarized by Sins, Savelsbergh, Van Joolingen (2005), the benefits should help students make sense of the world in a scientific way. It allows the student to benefit from not only constructing (Milrad, Spector, & Davidsen, 2002 Penner 2001; Spector 2000; Stratford, 1997) and testing their mental models (Coon 1988; Doyle & Ford, 1998, Penner 2001), but also from affording them in externalizing their representations and ideas and making them explicit. The latter offers the student the ability to reflect upon their own understanding of the subject matter (Gilbert, Boulter, & Rutherford, 1998; Jonassen, Strobel, & Gottdenker, 2005,; Raghaven, Satoris, & Glaser 1998; Scheker 1993) and makes them open to discussion with others. (Devi, Tibergenhien, Baker, & Brna, 1996; Rouwette, Vennix, & Thijssen, 2000; Suthers 1999).
Teaching students the „scientific way‟ has long been advocated through the use of inquiry learning (Bruner, 1961; Dewey 1938). Inquiry learning is precisely captured by the last part of the Chinese proverb: “Tell me and I forget. Show me and I remember. Involve me and I understand.” It actively involves the student in its own knowledge construction process. It requires the student to construct and evaluate their own hypotheses, and derive their own conclusions. This does however pose high demands on the cognitive skills of the students (Kuhn, Black, Keselman, & Kaplan, 2000) and students have been found to design inconclusive experiments and display unstructured behavior driven by local decisions rather than an overall plan (de Jong & van Joolingen, 1998). A supportive computer modeling environment and its benefits (as described above) can help students during inquiry learning (Njoo & de Jong, 1993). The combination of computer modeling and inquiry learning is labeled inquiry modeling as proposed by Löhner et al. (2005). Inquiry modeling refers to integrating a modeling environment into an inquiry learning environment. Several inquiry modeling environments have been used and allow for support of cognitive functions for example STELLA (Doerr, 1996), Model-It (Jackson, Stratford, Krajcik & Soloway, 1994) and Co-Lab (Van Joolingen, De Jong, Lazonder, Salvelsbergh & Manlove 2004).
inquiry process built on assumptions about how the process should look like ideally. An overview of modeling activities and inquiry learning can be found in Löhner et al. (2005).
The goal in teaching novices is the continuous development from a novice state toward an expert state (Royer, Cisero, & Carlo, 1993). The study from Löhner et. al. (2005) also stated that although the novices in their research do spend most of their time during inquiry modeling on scientific reasoning activities, they do not do so in a systematic temporal order or cycle. As a teaching tool the normative description of the scientific inquiry process can be used to achieve this. This prescribes the temporal order of the reasoning, but does not prescribe the amount of time to spend on each reasoning process. Since the goal is for novices to reach the expert state, as a teaching tool it makes equal sense to analyze the reasoning processes experts employ when modeling. This would give both the temporal order to follow and the time to spend on each phase.
Expert–novice research over the past four decades identified the following differences between novices and experts: (a) experts possess extensive and highly integrated bodies of domain knowledge; (b) experts are effective in recognizing the underlying structure of domain problems; (c) experts select and apply appropriate problem-solving procedures for the problem at hand; (d) experts can retrieve relevant domain knowledge and strategies with minimal cognitive effort, and (e) experts have better meta-cognitive ability to monitor their own progress when completing a task (Chi, Glaser, & Farr, 1985; de Groot, 1965; Gick, 1986; Alexander, 2003; Glaser, 1996).
A study involving expert and novice differences was performed by Hmelo-Silver and Green Pfeffer (2004). Experts and novices were asked to think out loud when describing and drawing elements that an aquarium contains. Experts displayed integrating structural, functional and behavioral elements as opposed to novices whose representations were limited to perceptually available, salient features of the complex system in question. Another study performed by Chi, Feltovich and Glaser (1981) examined the difference between experts and novices solving a physics problem. They show that novices use given features in the problem statement to solve the problem whereas experts create a qualitative analysis of the problem before working with the appropriate equations. A slightly different but similar result was found by Larkin, McDermott, Simon and Simon (1980) who examined differences in the reasoning process of experts and novices in a physics study. Novices focus on the variables found and work with equations involving those variables. They then write down formulas for the remaining variables, as opposed to experts who recognize patterns of information and develop new pieces of information.
The aim of the current study is therefore to explore and describe the differences in reasoning activities between experts and novices during a modeling task in physics. The search is for patterns to describe general strategic differences between novices and experts on how they build their models, which would provide insight on the processes and strategies of novices that need scaffolding and in what way. This leads to the following research question:
Method
Participants
This study aims to compare the reasoning processes that experts and novices employed during a physics modeling task in an inquiry modeling environment. The participants thus compose two different groups:
Experts
Reasoning processes employed by experts are obtained from a previous study by Van Muilwijk (2008). Experts in that study were employees at the Applied Physics department of the University of Twente. Table 1 contains the gender and experience of the expert participants.
Participant Gender Experience in physics and modeling
1 Male 24 years
2 Male 19 years
3 Female 14 years
4 Male 23 years
5 Male 36 years
Table 1: Expert participants
Novices
The task performed by the experts was replicated by the novices in this study. Four novices took part in this study. All novice participants were males of 19 years of age finishing their first year of Mechanical Engineering at the University of Twente. Their experience is limited to their knowledge on physics attained in high school and their first year of Mechanical Engineering. During this year they also gain some experience in modeling by using a computer. Reasoning processes of the novices and experts were obtained using a think aloud method.
Materials
For modeling, the computer software Co-Lab was used. Co-Lab is an environment for collaborative and inquiry learning, that includes a modeling tool which is designed to support learning goals of modeling (Van Joolingen, De Jong, Lazonder, Savelsbergh & Manlove, 2004). The graphical user interfaces allows users to construct models, run simulations and display results through graphics and tables.
The session started with a short training consisting of two parts. First, the participants watched three minute film showing the process of thinking out loud. The example in the film is somebody solving a matchstick puzzle while reasoning through his solution process. Afterwards the participants performed a Co-Lab exercise. This included an instruction for using the Co-Lab modeling environment and a practice modeling task. The Co-Lab exercise is added in Appendix B.
Procedure
All sessions took place in the same room with the same set-up i.e. a laptop for modeling and a telephone to record the participants‟ verbalizations. After a brief explanation on the aim of the study and the procedure of the experiment, the participants started with the training sessions. The first training involved the film which explained the process of thinking out loud. The participants understood directly what is meant by thinking out loud. In case the participants would forget to think out loud during the practice session or the experimental session, the researcher would give them a sign to remind them to think out loud. The sign was tapping two times on the table with a pen by the researcher. During the practice session which took place during the next thirty minutes, the participants were asked to get familiar with using Co-Lab and to practice thinking out loud. The aim of the practice modeling task is to stimulate participants to try out all the functions and possibilities of Co-Lab. The exercise itself was voluntary; the participants were free to explore Co-Lab the way they preferred. After a five minute break the experimental modeling task started. Since the task would be more challenging for the participants in this study compared to the experts in the previous study, the participants were informed that they had one hour to perform the task. One hour was the cut-off time used in the previous study, although the participants were not told so beforehand. Afterwards a brief interview was held about the experiences of the participant, and some personal background information was gathered. The total duration of the session was approximately two hours.
Data collection and analysis
The participants‟ verbalization during the modeling task was recorded. The recordings were transcribed to protocols and segmented into episodes based on natural breaks between sentences (Van Someren et al., 1994). The segments were coded using the coding scheme of Löhner et al. (2005). The coding scheme, which can be found in Appendix C, contains three main categories; „scientific reasoning activities‟, „other activities‟ and „no code‟. These main categories contain the following subcategories:
Scientific reasoning activities
o Orientation
o Hypothesizing
o Experimenting
o Model evaluation
Other activities
o Actions
o Regulation
o Off task
o Experimenter
No Code
Averaging window
Every second of the protocol has one specific code assigned to it. This results in a barcode like graph when displaying the code against the timeline. In order to create reasoning patterns the program Microsoft Office Excel 2003 is used to calculate for any moment in time how much of the next „x‟ minutes is spent on which activities. An example of coded protocol looks as follows:
02:30 – 02:36 Verbalization Code A
02:36 – 03:22 Verbalization Code B
03:22 – 04:25 Verbalization Code C
04:25 – 04:45 Verbalization Code B
Etc.
With „x‟ set at two minutes this results in an averaging window of two minutes. The output for the timeslot 02:30 – 02:45 would take into account the percentage of time the next two minutes starting from 02:30 would have a certain code. So out of a two minute window starting on 02:30 A would account for 6 seconds, B for 46 seconds, C for 63 seconds and it would finish with B for 5 seconds. The result displayed for the 02:30-02:45 timeslot would become:
A B C
02:30-02:45 6s/120s = 5% 46s+5s/120 s= 42,5% 63s/120s = 52,5%
02:45-03:00 37s+20s = 47,5% 63s/120s = 52,5%
Etc.
The timeslot starting at 02:45 until 03:00 takes into account the percentages of code from 02:45 - 04:45 etc.
Coding and Inter-rater reliability
Comparing results between experts and novices is based on the assumption that there is enough reliability between the researchers‟ coding styles. Before coding the protocols of this study, three protocols of the experts‟ study were also coded in order to calculate the inter- rater agreement.
Agreement between researchers can be distinguished into the following 3 categories:
b) Categorical agreement – the researchers agree on 1 of the 10 subcategories but not on the specific code in that category.
c) Disagreement – the researchers disagree on category and thus on specific code.
As a reliability measurement it is possible to use the specific agreement percentage of the protocol. In addition it is possible to account for „random chance of researchers‟ agreement using a measurement such as Cohen‟s Kappa. However, Cohen‟s kappa accounts for this randomness by assuming that researchers would randomly pick a code when they are unsure. In this study however it is far more likely that a researcher is in doubt between perhaps 2 or 3 specific codes which generally tend to fall in the same category. The difference for example between 12A and 12B is very subjective; however it is likely that the researchers agree on the fact that the protocol in question should be coded as regulation. With enough categorical agreement between researchers it then justifies comparing the categorical differences between experts and novices.
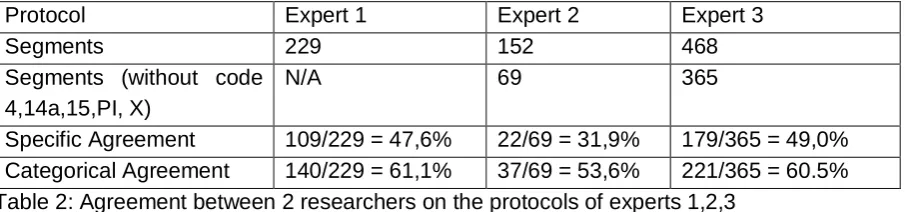
[image:11.595.74.527.450.556.2]The first expert protocol had a categorical agreement percentage of 61,1%. After scoring the protocol it became clear that without the actual audio tapes it is difficult to interpret when the expert was reading something (14A) or performing model implementation (4). This was also true for when the researcher interfered (PI), when the actions were off task (15) or when something was coded as X (no code). Because these pieces of code can affect the outcome of the categorical agreement in an unpredictable way, they were left out of consideration in the calculation of inter-rater agreement of the second and third expert protocol. For which the categorical agreement percentage was respectively 53,6 and 60,5 % as can be seen in Table 2.
Protocol Expert 1 Expert 2 Expert 3
Segments 229 152 468
Segments (without code 4,14a,15,PI, X)
N/A 69 365
Specific Agreement 109/229 = 47,6% 22/69 = 31,9% 179/365 = 49,0% Categorical Agreement 140/229 = 61,1% 37/69 = 53,6% 221/365 = 60.5% Table 2: Agreement between 2 researchers on the protocols of experts 1,2,3
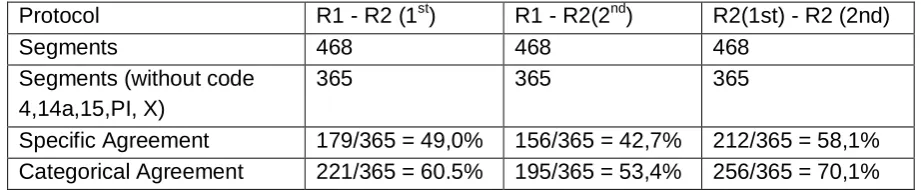
Protocol R1 - R2 (1st) R1 - R2(2nd) R2(1st) - R2 (2nd)
Segments 468 468 468
Segments (without code 4,14a,15,PI, X)
365 365 365
[image:12.595.67.528.70.165.2]Specific Agreement 179/365 = 49,0% 156/365 = 42,7% 212/365 = 58,1% Categorical Agreement 221/365 = 60.5% 195/365 = 53,4% 256/365 = 70,1%
Results
Reasoning processes
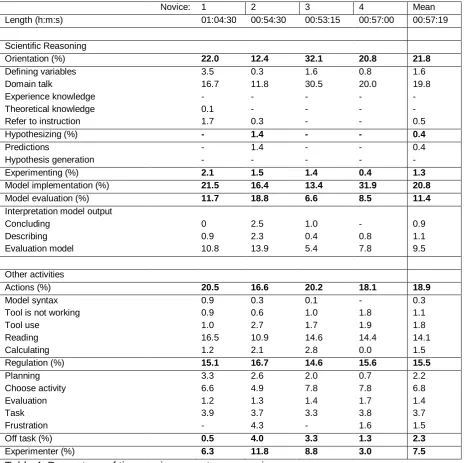
Table 4 shows the reasoning processes in which the novice participants engaged during the study. Novice participants spent most time on orientation, model implementation, model evaluation, actions and regulation. Almost no time was spent hypothesizing and experimenting. The results also show that novice participant 2 spent less time orientation (12.4%) compared to a mean of 21.8%. Instead he spent more time on model evaluation (18.8%) compared to a mean of 11.4%. The opposite is true for novice participant 3 who spent 32.1% on orientation and 6.6% on model evaluation. Orientation was composed predominantly of domain talk. Results were similar for model evaluation being composed of „evaluation model‟ and actions being composed of reading.
Novice: 1 2 3 4 Mean
Length (h:m:s) 01:04:30 00:54:30 00:53:15 00:57:00 00:57:19
Scientific Reasoning
Orientation (%) 22.0 12.4 32.1 20.8 21.8
- Defining variables 3.5 0.3 1.6 0.8 1.6
- Domain talk 16.7 11.8 30.5 20.0 19.8
- Experience knowledge - - - - -
- Theoretical knowledge 0.1 - - - -
- Refer to instruction 1.7 0.3 - - 0.5
Hypothesizing (%) - 1.4 - - 0.4
- Predictions - 1.4 - - 0.4
- Hypothesis generation - - - - -
Experimenting (%) 2.1 1.5 1.4 0.4 1.3
Model implementation (%) 21.5 16.4 13.4 31.9 20.8
Model evaluation (%) 11.7 18.8 6.6 8.5 11.4
- Interpretation model output
- Concluding 0 2.5 1.0 - 0.9
- Describing 0.9 2.3 0.4 0.8 1.1
- Evaluation model 10.8 13.9 5.4 7.8 9.5
Other activities
Actions (%) 20.5 16.6 20.2 18.1 18.9
- Model syntax 0.9 0.3 0.1 - 0.3
- Tool is not working 0.9 0.6 1.0 1.8 1.1
- Tool use 1.0 2.7 1.7 1.9 1.8
- Reading 16.5 10.9 14.6 14.4 14.1
- Calculating 1.2 2.1 2.8 0.0 1.5
Regulation (%) 15.1 16.7 14.6 15.6 15.5
- Planning 3.3 2.6 2.0 0.7 2.2
- Choose activity 6.6 4.9 7.8 7.8 6.8
- Evaluation 1.2 1.3 1.4 1.7 1.4
- Task 3.9 3.7 3.3 3.8 3.7
- Frustration - 4.3 - 1.6 1.5
Off task (%) 0.5 4.0 3.3 1.3 2.3
[image:13.595.66.535.275.738.2]Experimenter (%) 6.3 11.8 8.8 3.0 7.5
The amount of time spent on hypothesizing and experimenting activities is 0.4% and 1.3% respectively. With a moderate inter-rater agreement of 58.4% these results can be caused by fluctuations in coding style and are therefore excluded from further analysis.
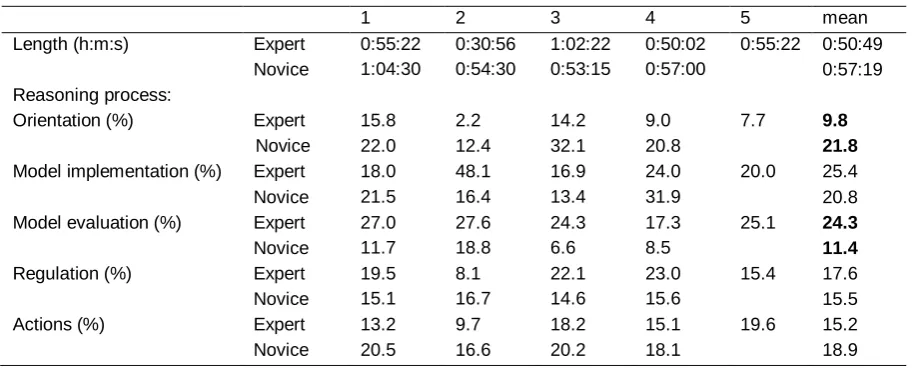
When comparing the results from the novice participants in this study with expert participants who performed the same task in a previous study, some striking results are found as can be seen in Table 5. Results are similar for model implementation, regulation and actions. However, experts compared to novices spent less time (9.8% on average compared to 21.8%) on orientation and more time on model evaluation (24.3% on average compared to 11.4%). It is similar to the way novice 2 differed from other novices, but to a bigger extent.
1 2 3 4 5 mean
Length (h:m:s) Expert 0:55:22 0:30:56 1:02:22 0:50:02 0:55:22 0:50:49 Novice 1:04:30 0:54:30 0:53:15 0:57:00 0:57:19 Reasoning process:
Orientation (%) Expert 15.8 2.2 14.2 9.0 7.7 9.8
Novice 22.0 12.4 32.1 20.8 21.8
Model implementation (%) Expert 18.0 48.1 16.9 24.0 20.0 25.4
Novice 21.5 16.4 13.4 31.9 20.8
Model evaluation (%) Expert 27.0 27.6 24.3 17.3 25.1 24.3
Novice 11.7 18.8 6.6 8.5 11.4
Regulation (%) Expert 19.5 8.1 22.1 23.0 15.4 17.6
Novice 15.1 16.7 14.6 15.6 15.5
Actions (%) Expert 13.2 9.7 18.2 15.1 19.6 15.2
Novice 20.5 16.6 20.2 18.1 18.9
Table 5: Percentage of time experts and novices spent on reasoning processes (experts‟ results were copied from Van Muilwijk 2008 and are available in full detail in Appendix E)
Modeling strategy
Adding a time dimension to the reasoning activities enables one to analyse the modeling strategies employed by the participants in scientific reasoning (orientation, hypothesizing, experimenting, model implementation and model evaluation). With hypothesizing and experimentation excluded from further analysis, this leaves orientation, model implementation and model evaluation to be plotted on the time lapse of the session (X-axis). The Y-axis in the graphs on the following pages represents the percentage of time spent on a reasoning process within an averaging window of a certain amount of minutes.
Averaging window size
[image:14.595.70.527.235.419.2]The larger the averaging window becomes (in minutes), the bigger the averaging effect becomes. The effect of big peaks becomes more profound and the effect of solitary peaks seems to fade away. It shows big trends more clearly at a cost of detail given in the smaller peak ranges. Figures 1, 2, 3 show an averaging window of two, four and six minutes respectively. These graphs are based on the exact same code. Appendix D also shows averaging windows of 3 and 5 minutes. The succession of these graphs shows that:
a) De detail provided in the graph corresponds loosely to the averaging window time x 1.5. In Figure 1 the duration of a peak (x-axis) is on average 3 minutes. In Figure 2 this becomes on average 6 minutes and in Figure 3 this becomes on average 10 minutes. b) When peaks are separated but closely together in Figure 1 they will merge in Figure 2. A
similar process occurs for peaks in Figure 2 that will merge in Figure 3.
c) The relative height of the peaks becomes lower as well. The highest peak in Figure 1 is around 97%, but quickly deteriorates to 63% in Figure 2 and to 42% in Figure 3.
Figure 1: Graph with an averaging window of 2 minutes
Figure 2: Graph with an averaging window of 4 minutes
Needless to say, the averaging window size has a profound visual effect and thus influences the conclusions based on these graphs. Based on the first 20 minutes in the graphs shown one could conclude:
Based on Figure 1 minutes 0-20: Orientation and implementation alternate with virtually no model evaluation present.
Based on Figure 2 minutes 0-20: A strong period of orientation is followed by the simultaneous implementation of the model.
Based on Figure 3 minutes 0-20: Orientation and model implementation tend to work in concert right from the start.
Since the averaging window size is arbitrary, it is perhaps best to display both a small averaging window (2 minute) and a large averaging window per participant and base the conclusions on both. Results of the expert participants from the previous study however are only given with an averaging window of 10% of the total time spent. The results in this study will therefore compare the novice participants‟ graphs with an averaging window of 2 minutes and with 10% with the 10% graphs of the experts from the previous study.
Results of the novice participants based on a 2 minute averaging window:
Novice participants do not seem to follow the normative scientific inquiry model. Although hypothesizing and experimenting were excluded from this analysis they only make up 1.7% of the total amount of time spent. Without hypothesizing and experimenting this leaves an inquiry model of „orientation‟, „model implementation‟, „model evaluation‟. Participants exhibited multiple phases of each of these scientific reasoning activities, but do not do so in any specific pattern (see upper graphs in Figure 4-7). Novice 2 shows a recurring pattern of orientation, model implementation, model evaluation, but novice 2 also differs in the total amounts of time spent on these activities.
Results of the novice participants based on a 10% averaging window:
As shown in the sidebars of Figures 4-7 in bold, almost all participants exhibit at least one cycle of orientation, implementation, and evaluation. Novice 1 and 2 follow this cycle fairly accurately and novice 3 and 4 tend to skip some of the steps in this cycle.
Recognized pattern in lower graph:
Orientation
Mode implementation Model evaluation + Orienation
Model implemenation Evaluation
Orientation
[image:17.595.65.534.69.262.2] [image:17.595.65.536.293.477.2]Model implementation
Figure 4: Novice 1 (upper graph = 120s window, lower graph = 390s window)
Recognized pattern in lower graph:
Model implementation Model evaluation Orientation
Model implementation Model evaluation Orientation
[image:17.595.63.533.430.689.2]Model evaluation
Figure 5: Novice 2 (upper graph = 120s window, lower graph = 330s window)
Recognized pattern in lower graph:
Orientation
Model implementation
Orientation
Model implementation Model evaluation Orientation
Recognized pattern in lower graph:
Orientation
Model implementation Model evaluation
Model implementation
Orientation
[image:18.595.66.532.68.268.2]Model implementation
Figure 7: Novice 4 (upper graph = 120s window, lower graph = 345s window)
Models
This section will display the models created by the novices and analyze them based on their structure, efficiency, faults and completeness.
Model of novice 1:
Structurally the model is sound and efficient. Both earth and atmosphere are created with the corresponding links and loops. There are some minor faults regarding the output of the earth. Novice 1 used the heat capacity in the atmosphere but made some mistakes relating this to the temperature of the atmosphere. The heat capacity of the earth was not used at all.
[image:18.595.156.447.477.720.2]Model of novice 2:
[image:19.595.121.477.136.326.2]The model is structurally sound and very lean. However Novice 2 did not use the heat capacity of both the atmosphere and the earth at all.
Figure 9: Model built by Novice 2
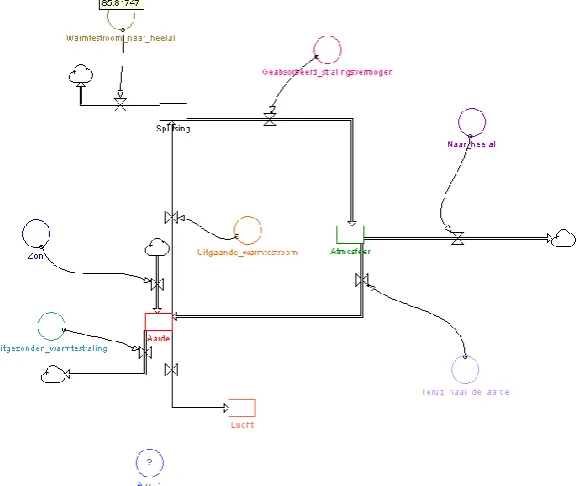
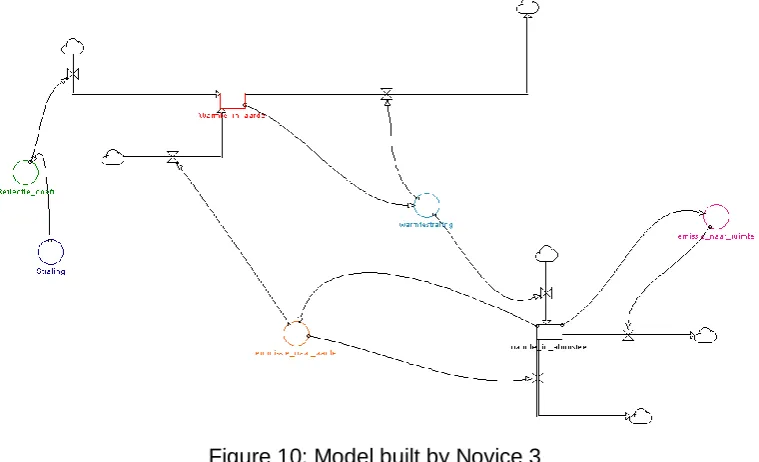
Model of novice 3:
Although the model looks and is inefficient, the model is almost complete. He was the only novice to integrate the heat capacity in the right manner and to actually calculate the temperature change. However he forgot to relate the reflected heat from the atmosphere to the temperature change of the earth.
[image:19.595.163.435.455.719.2]Model of novice 4:
[image:20.595.110.490.168.399.2]Structurally it is sound and efficient, although there is a minor mistake in forgetting the absorption coefficient of the atmosphere. Novice 4 noticed the heat capacities and used them in his model but was unable to figure out how they are linked to temperature change.
Figure 10: Model built by Novice 3
Conclusion and Discussion
Although the nature of this research is exploratory, some preliminary conclusions can be drawn. The major finding is that novices spend more time on orientation and less time on model evaluation compared to experts. It is also interesting to see that the time spent on regulation, actions, and model implementation is similar. This suggests that the time spent on these categories is necessary to complete the task itself.
A plausible explanation why novices spend more time on orientation and less time on model evaluation is that novices have less internalized models and knowledge about the domain and thus take more time interpreting the meaning of the task, variables, and relations. This explanation works well with the fact that novices engage in multiple orientation periods. After and through the act of model implementation, the novice learns more about the nature of the task, variables and relation and thus takes some time to assess the new situation before starting to evaluate or continue model implementation.
On the other hand, it is equally possible to say that experts spend less time on orientation because they spend more time on model evaluation. The question then becomes, what might be a reason for an expert to spend more time on model evaluation rather than orientation? Two possible explanations:
a) Experts do not need much orientation because of their internalized models and knowledge. This train of thought is supported by Chi, Glaser & Farr (1985) who state that experts possess extensive and highly integrated bodies of domain knowledge, called schemata. These schemata benefit experts in the effective and efficient building of models. De Groot (1965) also found that experts are highly effective in recognizing and encoding the underlying problem structure. It can therefore be expected that the length of the experts‟ orientation phase is shorter. They can therefore quickly assess the situation (orientation) and in order to learn more they spend more time on model evaluation.
b) It is also possible that the way in which experts perform model evaluation is a very efficient one to learn more about the situation. It is then for them more efficient to invest time in model evaluation rather than investing that time on orientation.
Because of the qualitative nature of option b) the protocols of experts and novices were investigated more thoroughly to see if there is a difference in the quality of the model evaluation between experts and novices. When evaluating their model, novices tend to check if they have implemented what they intended and evaluate their current state of the model. Experts also perform these actions but in addition engage in running quick simulations. They simply press the „run‟ button occasionally and „see what happens‟. Even though they do not hypothesize beforehand, the feedback from the simulation helps in several ways:
b) When no errors pop up, the results of the quick simulation can be interpreted and used to verify if the model is working the way it should.
c) Experts draw conclusions from the simulation and use the information for the next session of model implementation. They thus gain a greater understanding of the task.
So summarizing, novices spend more time on orientation and less time on model evaluation compared to experts. Plausible reasons seem to be that novices have less internalized domain knowledge and thus need more time orientating. In addition experts run quick simulations during model evaluation and thus learn more from the extra time spent on model evaluation, reducing the need for orientation in the following reasoning cycle.
The findings and suggestions show that there are some differences between the time spent on various reasoning processes and general strategies of experts and novices. The introduction gave various reasons why experts are able to build better models and suggested to take the modeling process of experts as a standard to which the modeling process of novices needs to be compared. It is therefore interesting to discuss the quality of the models created by the experts and novices and its implications.
Structurally speaking the models between experts and novices did not differ much. Both understood the need for a recursive loop in the system. The difference between the models is found in the inclusion and linkage of the heat capacities. This crucial step, that is not explicitly mentioned in the assignment, was absent in most of the novices‟ models. Most experts on the other hand did implement it and were able to build successful models. Implementing this step requires thinking about the units in which heat capacity and energy flows are given and how to derive Kelvin per second from it. This process of rewriting formulas and units is a clear example of how domain knowledge works in favour of experts. Experts have more experience in rewriting formulas to obtain the proper units and are more experienced with the meaning of energy flows, heat capacities and their relations. The higher quality of the experts‟ models therefore supports the idea that novices need more time on orientation to see how all the data fits together. It also supports that experts therefore have more time to spend on evaluating their models, since their orientation phase is relatively short. The cyclical process (although different) that both experts and novices engage in supports the finding from Van Muilwijk (2008) that building a model consists of sub steps. A difference between experts and novices that does not follow from the time spent on reasoning processes nor from the modeling strategies itself is the implementation of quick evaluation by the experts. Since experts engage in quick evaluations and novices do not, it can be suggested that novices would benefit from running quick simulations.
loud method might not capture all reasoning processes performed by the experts and novices. Thirdly, protocol analysis using graphs and numbers as shown in the results section did not pick up the quick simulation strategy that the experts employed. The question is whether graphs and numbers are the right way to look at reasoning processes employed in these situations. Fourthly, the experts and novices just learned how to work with these simulation environments. They might not have been able to show their full potential. Fifthly, the size of the averaging window has a profound effect on the graphs that are generated. With the size being arbitrary this makes the technique very susceptible to experimenters‟ bias.
In the introduction the question was raised whether the normative inquiry model or the reasoning strategy of the experts should be used as an instructional tool in educating novices. This question can not be answered directly based on these findings. In order to answer this question future research might compare the results of novices on a modeling task by which one group is reminded to follow the normative inquiry model and the other group is reminded to follow the reasoning strategy of experts.
As an answer to the research question: “Are there specific differences between novice and expert physics modelers on the general strategies they employ when building a physics model in an inquiry modeling environment?” The answer is: „Yes, novices spend more time on orientation and less time on model evaluation. They also incorporate orientation in returning reasoning cycles as opposed to experts. Furthermore, experts perform quick simulations and novices do not.
References
Alexander, P. A. (2003). The development of expertise: The journey from acclimation to proficiency. Educational Researcher, 32(8), 10-14.
Barowy, W., & Laserna, C. (1997). The role of the internet in the adoption of computer modeling as legitimate high school science. Journal of Science Education and Technology, 6, 3-12.
Bruner, J. S. (1961). The act of discovery. Harvard Educational Review, 31, 21–32.
Chi, M. T. H., Feltovich, P. J., & Glaser R. (1981). Categorization and representation of physics problems by experts and novices. Cognitive Science, 5, 121-152.
Chi, M. T. H., Glaser, R., & Farr, M. J. (1985). The nature of expertise. Hillsdale: Lawrence Erlbaum.
Coon, T. (1988). Using STELLA simulation software in life science education. Computers in
Life Science Education, 5(9), 56–71.
Devi, R., Tiberghien, A., Baker, M., & Brna, P. (1996). Modeling students‟ construction of energy models in physics. Instructional Science, 24, 259–293.
Dewey, J. 1938. Experience and Education. New York: Collier Books
Doerr, H. M. (1996). Stella ten years later: a review of the literature. International Journal of Computers for Mathematical Learning, 1, 201-224.
Doyle, J. K., & Ford, D. N. (1998). Mental models concepts for system dynamics research.
System Dynamics Review, 14(1), 3–29.
Hmelo-Silver, C. E., & Green Pfeffer, M. (2004). Comparing expert and novice
understanding of a complex system from the perspective of structures, behaviours and functions. Cognitive Science, 28, 127-138.
Fretz, E. B., Wu, H., Zhang, B., Davis, E. A., Krajcik, J., & Soloway, E. (2002). An investigation of sofware scaffols supporting modeling practices. Research in Science Education, 32, 567-589.
Gick, M. L. (1986). Problem-solving strategies. Educational Psychologist, 21, 99-120.
Gilbert, J. K., Boulter, C. J., & Rutherford, M. (1998). Models in explanations, Part 1: Horses for courses ? International Journal of Science Education, 20(1), 83–97.
Glaser, R. (1996). Changing the agency of learning: Acquiring expert performance.The road to excellence: The acquisition of expert performance in the arts and sciences, sports, and games. Mahwah, NJ: Lawrence Erlbaum Associates Inc.
de Groot, A. (1965). Thought and choice in chess. The Hague: The Netherlands: Mouton
Jonassen, D. H., Strobel, J., & Gottdenker, J. (2005). Modeling for meaningful learning.
Learning Sciences and Technologies Group (Ed.), Engaged learning with emerging
technologies.(pp. 7–28). Dordrecht, The Netherlands: Springer Verlag.
de Jong, T., & van Joolingen, W. R. (1998). Scientific discovery learning with computer simulations of conceptual domains. Review of Education Research, 68(2), 179–291.
Justi, R. S., & Gilbert, J. K., (2002). Modeling, teachers‟ views on the nature of modeling, and implications for the education of modelers. International Journal of Science Education, 24, 369-387.
Kuhn, D., Black, J., Keselman, Al, & Kaplan, D. (2000). The development of cognitive skills to support inquiry learning. Cognition and Instruction, 18, 495-523.
Larkin, J. H., McDermott, J., Simon D. P., & Simon, H. A. (1980). Models of competence in solving physics problems. Cognitive Science, 4, 317-345.
Löhner, S. (2005). Computer based modeling tasks: the role of external representation. PhD. Thesis. University of Amsterdam, Amsterdam.
Löhner, S., van Joolingen, W. R., Savelsvergh, E. R., & van Hout-Wolters, B. (2005). Students‟ reasoning during modeling in an inquiry learning environment. Computers in Human Behavior, 21, 441-461.
Milrad, M., Spector, J. M., & Davidsen, P. I. (2003). Model facilitated learning. In S. Naidu (Ed.). Learning & Teaching with Technology: Principles and Practices. London: Kogan Page.
Njoo, M. & de Jong, T. (1993). Exploratory learning with a computer simulation for control theory: Learning processes and instructional support. Journal of Research in Science Teaching, 30, 821–44
Penner, D. E. (2001). Cognition, computers and synthetic science: building knowledge and meaning through modeling. Review of Research in Education, 25, 1-36.
Raghavan, K., Sartoris, M. L., & Glaser, R. (1998). Impact of the MARS curriculum: The mass unit. Science Education, 82, 53–91.
Rouwette, E. A. J. A., Vennix, J. A. M., & Thijssen, C. M. (2000). Group model building: A decision room approach. Simulation & Gaming, 31(3), 359–379.
Schecker, H. P. (1993). Learning physics by making models. Physics Education, 28, 102–
106.
Sins, P. H. M., Savelsbergh, E. R., & van Joolingen, W. R. (2005). The difficult process of scientific modeling: An analysis of novices‟ reasoning during computer-based modeling. International Journal of Science Education, 27(14), 1695-1721.
Spector, J. M. (2000). System dynamics and interactive learning environments: Lessons learned and implications for the future. Simulation & Gaming, 31(4), 528–535.
Suthers, D. D. (1999). Effects of alternate representations of evidential relations on
collaborative learning discourse. In C. M. Hoadley, & J. Roschelle (Eds.), Proceedings of the
Computer Support for Collaborative Learning (CSCL) 1999 Conference (pp. 611–620). Palo
Alto, CA: Stanford University.
Van Joolingen, W. R., De Jong, T., Lazonder, A. W., Savelsbergh, E. R., & Manlove, S. (2004). Co-Lab: research and development of an online learning environment for collaborative scientific discovery learning. Computers in Human Behavior, 21, 671-688.
Van Muilwijk, H. (2008). Expert’s Reasoning Processes in a Physics Modeling Task, Bachelor Graduation thesis, Faculty of Behavioural Sciences, University of Twente, Enschede.
Van Someren, M. W., Barnard, Y. F., & Sandberg, J. A. C. (1994). The think aloud method: A practical guide to modeling cognitive processes. Amsterdam: Academic press.
White, B.Y.; Shimoda, T.A., & Frederiksen, J.R. (1999). Enabling students to construct theories of collaborative inquiry and reflective learning: Computer support for metacognitive development. The International Journal of Artificial Intelligence in Education, 10(2),1–33.
Appendix A: Modelleertaak - ‘Broeikas Aarde: een leefbare temperatuur’
Gemiddeld over het hele aardoppervlak bedraagt de temperatuur op onze Aarde zo'n 15 °C. In deze modelleeropdracht onderzoeken we hoe de temperatuur van 15 °C tot stand komt, en hoe die temperatuur afhangt van de zonneactiviteit en van eigenschappen van het aardoppervlak en de atmosfeer. Hieronder staat informatie over de Aarde, straling en de atmosfeer gegeven die nodig is voor het maken van het model.
Opdracht:
Modelleer de „broeikas Aarde‟ in Co-Lab, met behulp van de gegeven informatie en eventuele extra eigen kennis. Probeer het model zo uitgebreid en compleet mogelijk te maken.
Vergeet hierbij niet hardop te denken. Succes!
Aarde
Gemiddelde Aarde
Bij het ontwerpen van het model van de „broeikas Aarde‟ moeten aannames worden gedaan over hoe „het systeem Aarde‟ fysisch gezien is opgebouwd.
Om een redelijke schatting van de warmtecapaciteit van een gemiddeld stukje Aarde te kunnen maken, zijn enkele aannames nodig over de samenstelling van de aardlaag aan het oppervlak. We gaan ervan uit dat de Aarde bestaat uit water en droog zand (land). In de huidige situatie (1/3 land en 2/3 water) bedraagt de warmtecapaciteit van een gemiddeld stukje Aarde, ter grootte van 1m2, dan C = 5,8 ×10⁵ J/K.
Straling
Zonneinstraling en reflectie
Op de Aarde valt stralingsenergie van de zon in. De energiestroom S van de zon die op een gemiddeld stukje aardoppervlak invalt is: S = 350 J/(m2·s). Een deel van dat invallende stralingsvermogen wordt door het aardoppervlak opgenomen of geabsorbeerd. De rest van de straling wordt meteen weer teruggekaatst.
De grootte van de reflectiecoëfficiënt α hangt af van de samenstelling van het aardoppervlak ter plaatse. Voor een gemiddeld stukje Aarde is een reflectiecoëfficiënt van 0,3 een redelijke aanname.
Warmtestraling
Bij een temperatuur T straalt een gemiddeld stukje aardlaag ook energie uit, de zogenaamde warmtestraling. De naar het heelal uitgestraalde energiestroom Wuit wordt gegeven door
4
T
W
uit
.Deze formule is de stralingswet van Stefan-Boltzmann, waarin de evenredigheidsconstante σ een waarde heeft van 5,6 ×10⁻⁸ W/(m² K4).
Atmosfeer
Gemiddelde atmosfeer
de invallende stralingsenergie van de zon S, als het direct door de aardoppervlak gereflecteerde straling, ongehinderd door. Met andere woorden: we nemen aan dat de atmosfeerlaag de kortgolvige zonnestraling niet absorbeert.
Absorptiecoëfficiënt atmosfeer
De door de Aarde uitgezonden langgolvige warmtestraling wordt wel voor een deel door de atmosfeerlaag geabsorbeerd. Het gedeelte van het stralingsvermogen dat door de atmosfeer wordt opgenomen is afhankelijk van de absorptiecoëfficiënt van de atmosfeer. Het door de atmosfeer geabsorbeerde stralingsvermogen is dan T4.
Energieinhoud en warmtecapaciteit atmosfeer
Het door de atmosfeer geabsorbeerde stralingsvermogen zorgt voor een toename van de energieinhoud van de atmosfeer. De temperatuur van de atmosfeer TA is ook nu weer te berekenen uit de energieinhoud van een gemiddeld stukje atmosfeer en de warmtecapaciteit van dat stukje: CA = 2,5 ×10⁶ J/K.
Emissiecoëfficiënt atmosfeer
Net als het aardoppervlak zal ook de atmosfeer warmtestraling uitzenden. Dit door de atmosfeer uitgezonden stralingsvermogen is gelijk aan TA4. Hierin is de emissiecoëfficiënt (in grootte gelijk aan de absorptiecoëfficiënt) en TA de temperatuur van de atmosfeer. De atmosfeer zendt dit stralingsvermogen zowel naar boven (naar de ruimte) als naar beneden (terug naar de Aarde) uit. Het totale door de atmosfeer uitgezonden stralingsvermogen is dus 2 TA4. De helft daarvan wordt uitgezonden richting de Aarde. (Merk op dat dit laatste het broeikaseffect is. De grootte van de absorptie-/emissiecoëfficiënt van de atmosfeer hangt af van de concentratie „broeikasgassen‟ (zoals CO2 en CH4). Voor de huidige atmosfeer van de Aarde heeft de waarde 0,78. Een stijgende concentratie broeikasgassen zou de waarde van groter maken.)
Schematische weergave
Figuur 1 is een schematische weergave van de bovengenoemde informatie.
Figuur 1. Schematische weergave van de broeikas Aarde.
Warmte in atmosfeer
Ingaande warmtestroom
(Win)
Warmte in aardbol (Einhoud)
Gemiddeld stukje aarde Uitgaande warmtestroom
(Wuit)
T
) S S
T4
T4 TA
TA4
Appendix B: Oefentaak Co-Lab – ‘De lekkende emmer’
Deze oefentaak is bedoeld om het programma Co-Lab te leren gebruiken. Hieronder ziet u hoe het interface van Co-Lab er uit ziet.
Co-Lab is zo logisch mogelijk opgebouwd, en de meeste pictogrammen spreken voor zich. Wanneer u met de muis over de pictogrammen heen beweegt, komt er een korte uitleg bij te staan. Verder kunt u een helpfunctie raadplegen, door bovenin op het boekje met het vraagteken te klikken.
De bovenste rij pictogrammen kunt u gebruiken om - het model te maken (Editer tool)
- data te bekijken in een tabel (Table tool) - data te bekijken in een grafiek (Graph tool) - uitleg te krijgen over Co-Lab (Help tool)
De bovenste rij pictogrammen in de Editer tool kunt u onder andere gebruiken om een nieuw model te openen of uw model op te slaan.
Daaronder zit nog een rij pictogrammen, die u kunt gebruiken om delen van je model te knippen, plakken, kopieren of verwijderen. Ook kunt u daar uw simulaties laten lopen.
Stock = voorraadgrootheid
Auxiliary = rekengrootheid
Flow = Stroompijl
Relation = Relatie
Wanneer u deze onderdelen heeft gebruikt in uw model, kunt u er op dubbelklikken om de variabelen te specificeren. U kunt hier onder andere functies kiezen, die u wilt gebruiken. Eén van deze functies, het IF-statement, lichten we nog even toe.
Het gebruik van het IF-statement:
Het IF-statement is te gebruiken als een „als-dan-bewering‟. Stel, men wil onderzoeken wat er gebeurt als er op tijdstip t=60 plots een waterkraan wordt dichtgedraaid, terwijl die daarvoor liep met een snelheid van 0.1 l/s. Het IF-statement komt er dan als volgt uit te zien: IF(time < 60, 0.1, 0).
U kunt ten alle tijden de helpfunctie raadpleden om uitgebreide informatie en uitleg te vinden.
Opdracht:
De modelleeropdracht
Hieronder staat een korte beschrijving van een lekkende emmer water.
Een lekkende emmer water
Onder een lopende kraan staat een wateremmer, dus er stroomt water in de emmer. Onderaan, op de zijkant, heeft de emmer een gat waar ook weer water uitstroomt. Hoeveel water er door het gat uit de emmer stroomt hangt af van twee dingen. Ten eerste: hoe groter het gat, hoe meer water er doorheen kan en ten tweede: hoe meer water er in de emmer zit, hoe groter de druk van de waterkolom, waardoor het water harder uit het gat zal stromen.
Opdracht:
Modelleer de lekkende emmer water met behulp van Co-Lab.
Wanneer dat gelukt is, kunt u het model uitbreiden met een tweede emmer water. Lees hiervoor eerst onderstaand stukje tekst.
Twee emmers water
Onder de stroom water die uit de eerste emmer loopt, wordt een tweede emmer water geplaatst. Omdat het water nogal spettert, loopt 30 procent van het water naast de tweede emmer en komt maar 70 procent van het water dat uit de eerste emmer stroomt ook daadwerkelijk in de tweede emmer terecht. Ook deze emmer heeft weer een gat aan de zijkant. Hoeveel water er door het gat uit de emmer stroomt hangt ook in dit geval af van de grootte van het gat en de hoeveelheid water in de emmer.
Opdracht:
Appendix C: Coding scheme
Scientific Reasoning
Orientation
o Defining variables
o Domain talk
o Experience knowledge
o Theoretical knowledge
o Refer to intstruction
Hypothesizing
o Predictions
o Hypothesis generation
Experimenting
Model implementation
Model evaluation
o Interpretation model output - Concluding
- Describing
o Evaluation model
Other activities
Actions
o Model syntax
o Tool is not working
o Tool use
o Reading
o Calculating
Regulation
o Planning
o Choose activity
o Evaluation
o Task
o Frustration
Off task
Experimenter
Appendix D: Averaging windows
Graph with an averaging window of 2 minutes
Graph with an averaging window of 3 minutes
Graph with an averaging window of 5 minutes
Appendix E: Modeling strategy experts
Modeling strategy Expert 1
0 0,1 0,2 0,3 0,4 0,5 0,6 0,7
0:00:00 0:10:00 0:20:00 0:30:00 0:40:00 0:50:00
Lapse of time during session
S h ar e of re as on in g p roc es s i n w in d ow
Orientation Hypothesizing Experimenting Model implementation Model evaluation
Modeling strategy Expert 2
0 0,2 0,4 0,6 0,8 1
0:00:00 0:05:00 0:10:00 0:15:00 0:20:00 0:25:00 0:30:00
Lapse of time during session
S h ar e of re as on in g p roc es s i n w in d ow
Orientation Hypothesizing Experimenting Model implementation Model evaluation
Modeling strategy Expert 3
0 0,1 0,2 0,3 0,4
0:00:00 0:10:00 0:20:00 0:30:00 0:40:00 0:50:00 1:00:00
Lapse of time during session
S h ar e of re as on in g p roc es s i n w in d ow
Expert: 1 2 3 4 5 mean
Length (h:m:s) 0:55:22 0:30:56 1:02:22 0:50:02 0:55:22 0:50:49
Reasoning process:
Orientation (%) 15.8 2.2 14.2 9.0 7.7 9.8
Hypothesizing (%) 3.0 0.0 1.4 1.3 0.0 1.1
Experimenting (%) 0.6 0.7 0.8 2.8 0.8 1.2
Model implementation
(%) 18.0 48.1 16.9 24.0 20.0 25.4
Model evaluation (%) 27.0 27.6 24.3 17.3 25.1 24.3
Regulation (%) 19.5 8.1 22.1 23.0 15.4 17.6
Actions (%) 13.2 9.7 18.2 15.1 19.6 15.2
Off task (%) 0.3 0.5 0.3 0.9 0.1 0.4
Experimenter (%) 0.9 3.0 1.2 2.6 9.0 3.3
Modeling strategy Expert 4
0 0,1 0,2 0,3 0,4 0,5
0:00:00 0:10:00 0:20:00 0:30:00 0:40:00 0:50:00
Lapse of time during session
S h ar e of re as on in g p roc es s i n w in d ow
Orientation Hypothisizing Experimenting Model implementation Model evaluation
Modeling strategy Expert 5
0 0,1 0,2 0,3 0,4 0,5
0:00:00 0:10:00 0:20:00 0:30:00 0:40:00 0:50:00
Lapse of time during session
S h ar e of re as on in g p roc es s i n w in d ow
Appendix F: Influence of coding on graphs
The following graphs are based on the same protocol of expert 3, but coded by researcher Van Muilwijk in graph 1, coded by researcher Maas in graph 2 and coded by Maas in graph 3 1,5 month after coding graph 2.
Graph 1: Coded by Van Muilwijk
Graph 2: Coded by Maas