Enterprise Imaging: picturing the
service value system
Glenn Parry
Introduction
When faced with a complex service enterprise there is a need to understand the basis of
co-operation for the firms involved. Which organizations are involved and how do they come together
to create value? We were faced with this challenge when working with BAE Systems on the
servitization of the Tornado fast jet. The aircraft was provided to the RAF under a £1.3bn availability
contract named ATTAC (Availability Transformation: Tornado Aircraft Contract). The contract initially
ran from 2006-2016, and this was later extended to 2019 at an extra cost of £125m. The contract
sought to save money on operations whilst guaranteeing the RAF Tornado aircraft availability,
capability and effectiveness is maintained throughout its service life. Changing the Tornado aircraft
from product to service provision meant that BAE Systems was to undergo a servitization journey.
The change in business model was not just going to impact BAE Systems; there were numerous
organizations, including Rolls Royce, GE Aviation, and Serco, who worked together kept the aircraft
flying and who together with the RAF would co-create the availability service of the aircraft.
Successful delivery of the ATTAC contract required co-operative discussion between stakeholders. A
shared understanding of the organizations involved was needed. The tool described in this chapter
was developed to provide a visual image that communicated how the organizations co-operated to
deliver the complex service (Mills et al., 2011; 2013).
Enterprise Imaging has since been used extensively to map and understand complex services as well
as simpler product delivery. Since undertaking the initial work on ATTAC we have slowly developed
include service design, new product introduction, supplier qualification, complex manufacture, client
pitching, event management etc.
Theory
Traditional product based supply chain approaches mean that managers focus on optimization of
their individual firm over any holistic measures of success (Spekman and Davies, 2004). Individual
firms focus upon their own business model. A business model is the design of the value creation,
delivery and capture mechanisms used to engage customers to pay for the value offering of a firm
and create profit (Teece, 2010). In its simplest form, the business model consists of three interacting
elements: the value proposition, which is the product or service offered; the customers use of the
offer within their context to create value; the firms process to capture worth (Parry and Tasker,
2014). Manufacturers produce a unit by transforming materials and equipment as part of a
production process, usually characterized as the ‘value creating’ activity (Slack et al., 2013).
Manufacturers perceive that value is realized when they sell their unit, at the point of exchange,
where worth is captured by the firm. The customers’ use of the produced unit is perceived as
separate from the firm’s value creation activity, but it is an integral part of a business model. Value
cannot be realized until some the value proposition is integrated into a customer’s enterprise.
Enterprise is the complex system of interconnected and interdependent activities undertaken by a
diverse network of stakeholders (Purchase et al., 2011a). In extended enterprises, many firm’s
offerings and resources are brought together to create a value proposition. It is the wider enterprise
of customer and provider resource employed together that delivers the holistic service experience.
The value proposition is delivered through the combination of resources. Resources may be split into
two distinct types: Operand resources are resources on which an operation or act is performed to produce an effect e.g. physical objects such as equipment, materials etc. Operand resources can
usually be applied to other operand resources, but not to operant resources; operant resources are
competence and so are often people based resource; Operant resources are applied to create transformations in other operant or operand resources.
When operating a complex extended enterprise, the need to have a holistic vision is well known
(Dyer, 2000). How firms are aligned, interact and how the required resources are coordinated
determines the performance of an enterprise (Das and Bing-Sheng, 2000). However, coordinating
resources which are managed by another firm towards goals that may not optimize returns for the
resource owner is challenging. Not all parties have equal influence, but rather an enterprise forms
around a small number of focal firms who are the key resource controllers, stakeholders and
beneficiaries to a contract (Mitchell et al., 1997).
Understanding and managing the complexity of multi-organizational service enterprises is a
challenge (Purchase et al., 2011b). In initial work on ATTAC several different firm level process
mapping techniques were used to try and capture a visual image of the enterprise level offer.
Techniques employed included: simple upstream/ downstream supply chain flow charts (Croom et
al., 2000); value stream mapping (Rother and Shook, 1999); and IDEF0 (NIST, 1993). The methods
resulted in images that were either too complex to understand due to the numerous loops caused
by non-linear flows within the enterprise, or processes were aggregated to a level where they did
not convey useful information.
Service blueprinting provided a useful approach to mapping an enterprise (Shostack, 1984). Service
blueprints show a service process flow from a customer perspective. The process flows have a ‘line
of visibility’ that shows operations that the customer can see and may be part of, and operations
that they cannot see that occur in a back office. For example, in a restaurant the customer sees and
interacts with the waiting staff, and can see the other customers as these are all ‘front office’. The
customer does not usually see the food preparation activity of the kitchen, any staff rota or purchase
of supplies, as this is ‘back office’ work. In service blueprinting the process, flows are placed in the
for simpler customer-facing services where flows are linear. However, we found it was not quite
appropriate for complex enterprises where contracts are between two organizations, but involve
many other groups and process flows are often non-linear
The service blueprinting concept was taken as the starting point for the Enterprise Imaging
technique. Service blueprinting was adapted such that an image was created from the perspective of
two contracting parties who have a shared front office space where their activities and resources
employed are visible to all, and both have a back-office support space where activities are not visible
to others in the enterprise. The Enterprise Imaging is a useful tool for managers or researchers
working in complex service environments as it creates a picture that allows for shared understanding
of the resources used in value creation.
Constructing an Enterprise Image
The method of construction of the Enterprise Image draws stakeholders into evolving conversations
that explore the multi-organizational service enterprises in which they work. Enterprise Images are
described as ‘epistemic objects’ as they capture knowledge that is often beyond the immediate
grasp of an individual. The image is constructed with interviewees from firms involved in a contract,
and as part of the creation process their insight unfolds, revealing greater depth of information.
Who to interview
Enterprise Image creation is undertaken as part of an interview process. Creation of the image may
be the central goal, or it can help in developing a deeper understanding of an operation. The
approach is useful as it helps focus conversations on how a business works, and uncovers details on
which resources, both internal and external are used to create the desired outcome for a client.
Ideally, interviews would be undertaken with equivalent representatives from client, provider and
service, its problems, and its relationships with other organizations key to this service provision and
its improvement.
We have constructed images using interviews from just a single firm perspective. This was done as
the firm did not wish to share information on their back-office functions with commercial partners.
Whilst this approach is valid for smaller firms where we can expect the interviewees to have detailed
knowledge of their immediate network, it is places a limitation on the validity of the images created.
We expect a single perspective is less reliable for larger firms, and ideally multiple interviews from
different perspectives would be required to ensure that the image accurately captures the
enterprise resources employed. Interviews across many levels of a complex organization may be
required from senior managers to shop floor employees, to ensure the images are valid. Time is
always an issue when trying undertaking interviews with key personnel from firms. Interviews
typically take 1.5hrs to construct the first image and subsequent validation interviews take 30-45
minutes.
Drawing an Enterprise Image
The Enterprise Image [EI] begins with drawing a standard framework upon which the different
resources/organizations that are used in the realization of the value proposition are placed. To
define the areas, the EI uses the service blueprint concepts of “back office” and “front office”. These
terms define separate but coordinated areas within the enterprise that represent the space where
Provider and Client interact (front office) and Client and Provider organizations which support the
service delivery but where the partners have no visibility of each other’s operations [back office].
Figure 1. The background framework for an enterprise image
Over time, we have developed a standard that the providers back office is placed at the bottom of
the image. In the center is the shared front office and at the top is the client’s back office. The front
office area represents the space in which client and provider interact and can ‘see’ each other’s
resource. The front office may be in multiple geographic areas, including the provider and client’s
own office/factory locations, if they permit client access. In practice, a judgement sometimes needs
to be made as to if a resource is in the front/back office or is partially visible.
Selecting appropriate resource units is a skill developed with practice. Resource may be a business
unit, an individual, organization, or piece of equipment. It is useful to consider the categories of
operand and operant described above and decide what is appropriate and useful. We have found
that resources described are usually sub-organizations, but in one case where a firm was selecting
for production. Specific shapes, and when possible colors, are used to describe the different
resources employed. The shapes are standard in Microsoft PowerPoint, and the colors are also from
the standard palette. The colors are selected as they can still be differentiated when printed in black
and white.
Back office Resource
Governance Resource
• Triangle – dark orange where colored
• Usually (not always) located in the back office
• Representing the highest level(s) of the
organization so decisions made here impact
upon the enterprise’s ability to act
• Operant resources / functional resource that
determine what resources are available and
dictate their co-ordination
• Governance organizations may not be aware
of the detail of the focal contract /operation
Examples include: groups such as Board of Directors;
organizations such as National TV Channel, Ministry
of Defense; or individuals such as a company founder,
CEO, an artist, the Prime Minister
Internal Support
• Parallelogram – white where colored
• Owned and managed directly by the Client or
Provider
• Often a shared resource providing services to
numerous parts of the organization
Examples include: Graphics teams, IT, estates
management, HR, accounts, shipping etc.
Third Party Internal Support
• Rhombus – light blue where colored
• Located in back office
• Not a ‘visible’ or directly accessible resource
to the other parties in the focal contract
• Contracted out / owned and managed by a
third party
Examples include: Legal advice, Designers, HR,
accounts, logistics etc.
Front Office Resource
Partnered Direct
• Rectangle – white where colored
• Located in the front office
• Jointly controlled/resourced by the provider
• These represent the focal joint activity of a
contract
Examples include: a client/provider jointly staffed
office with a team of marketers and designers
rebranding a major retail product; a children’s
playground developed by a design team with a
council; a hangar where the client works with the
provider to service aircraft
Third Party Direct
• Octagon- light grey where colored
• Located either wholly in the front office or
across the line of visibility as appropriate
• Usually commercial contractors who provide
significant resource to achieve outcome
• Often directly contracted to the client, but
may contract to the provider or another party
Examples include: an event photographer; social
workers within a health team; freelance animators
working in a joint provider/client office
Third Party Indirect
• Diamond – light grey where colored
• Located either wholly in the front office or
• Represents independently managed
resources that are not directly engaged in the
contract, and may not be aware of the
contract, but can influence the outcome.
Examples include: shops in an area where the council
is seeking to reduce crime. Keeping shop units
occupied, with no graffiti on their shutters, helps
improve the resident’s feelings of safety; a local
government agency charged with road maintenance
near a large factory reliant on road transport for
supply. The agency knew when roads would be closed
or restricted and informed the factory in advance to
aid supply planning.
Contract Focused Non-partnered
• Oval – light orange where colored
• Located either wholly in the front office or
across the line of visibility as appropriate
• Resource solely owned or staffed by only one
of the provider or client.
• Focused (usually solely) on the contract
Examples include: a sales and marketing team for a
contract; a local HR function to support a client site
Customer Voice
• Hexagon- white where colored
• Located either wholly in the front office or
across the line of visibility as appropriate
• Customer representative resources that are
routes of communication with groups such as
customers, workers, or the public
Examples include: Neighborhood Watch organizations
and elected councilors in an area where the council is
seeking to reduce crime; patient representative
groups in a hospital; Unions in a manufacturing plant
during a process of redesign.
Each resource is described within the shape e.g. flight technician, machine press, HR. Broadly,
resources are placed on the image in order of them being used, from left to right as in a process
flow, except no linking lines are used. The resources are placed closer to the owner of the resources
(client or provider). In placing the individual resource on the image, clarity of meaning and message
is prioritized over strict chronology of use or ownership. Where placement may lead to ambiguity a
note may be written within the shape to provide clarity.
From experience, images are often best drawn on whiteboards or paper, and post-it notes are used
to represent the various shapes and resource as they can easily be rearranged. A computer is not
used in the first instance as a physical object means there are no barriers to interviewees changing
the image. We photograph the image before moving it as Post-it notes tend to fall off during
transport. PowerPoint is then used to reconstruct the image and this is shared electronically with
PowerPoint can be used, but images on a screen create an immediate barrier to interaction as the
interviewees must learn to move the images or ask for them to be moved. It is better to print and let
the client draw upon the image when suggesting modifications. When using Enterprise Images as
part of presentations the animation function within PowerPoint is useful to aid explanation.
Revealing the shapes either one at a time or in small groups, starting in the front office and working
outwards, helps people understand how the resources work together. Figure 2 shows the generic
[image:12.595.130.468.279.528.2]enterprise image with resources placed upon the framework.
Figure 2. The Generic Enterprise Image
Application examples
To date we have created over 100 images with firms from sole traders to global multinationals.
Contracts examined have included nearly all types of business offerings including pitches, new
product development, complex multi-agency service provision, simple product creation, design
contexts; military aircraft servicing, the provision of intensive care units to local hospitals, and an
organized tourist visit to a favela.
Case Study of Aircraft Servitization
The case example is between industry and government, specifically BAE Systems and the Ministry of
Defense. The contract of focus is ATTAC (Availability Transformation: Tornado Aircraft Contract), a
ten-year plus, whole-aircraft availability contract where BAE Systems take prime responsibility to
provide support for fast jets with depth maintenance and upgrades, delivering defined levels of
available aircraft, spares and technical support at a target cost.
Researchers were able to create a preliminary image from secondary documents (Mills et al., 2011 &
2013). The initial image was presented to interviewees in turn who changed it accordingly and
assessed its validity until consensus was achieved. Over twenty-two organizational resource units
were identified controlled by many different organizations. The Enterprise Image was presented for
critique at seventeen different meetings involving personnel from many levels within the provider
and the client. The image underwent many iterations. As the case study is drawn from the defense
industry, for security reasons a modified version is been presented here. Though simplified, the
public domain version still conveys the complexity of the enterprise,
Figure 3 The Enterprise Image of the ATTAC contract
In the case example, four Partnered Direct Resources are identified. The main activity of the contract
was aircraft servicing. The operations resources were based within the main aircraft hangar, where
the maintenance activities are undertaken named “Combined Maintenance and Upgrade”. The
hangar is located on an RAF airbase, but staffed with client and provider personnel. “Fleet
Management” resource translates the clients aircraft requirements into the schedule of service
maintenance. “Engineering Support and Airworthiness Management” resolve technical queries and
safety issues and have resource at the airbase and additional offices in other client locations.
“Materials Provision” resource provides spare part and repair requirements planning.
Three Non-partnered Outcome Focused resource groupings are identified. “BAES Manage Business”
resource is a provider team that operates on the airbase, providing commercial, administrative, and
Human Resource for local BAE personnel. The “Project Team” resource is responsible for delivery of
the contracted output, though the staff are located some 50 miles away from the maintenance
hangar. “Air Command” are a client team responsible for maintenance of the physical assets
Two main Third Party Direct resource providers are presented in the case example. Rolls Royce Plc
manage the repair and overhaul of aircraft engines via a separate contract with the client. A
third-party company provides a painting service on a different site. Painting is a significant dependency as
it is one of the last process steps in the aircraft maintenance process before the aircraft is returned
to flying duty.
Internal Support back office client resources provide services to several client operations. “Defence
Estates” co-ordinate the client’s real estate resources. “Storage and Distribution” are the provider of
defense transport and storage for parts. “Equipment & Commodity teams” represent 20 different
Defence Equipment and Support (DE&S) client organizations, presented here as a single client
resource, providing a range of equipment e.g. ejector seats, munitions, compass. “Human
Resources” control the supply of engineering and supervisory staff into the partnered organizations.
Three provider Internal Support resources have been depicted: “Central Purchasing” located 200
miles away in the providers main offices. “Engineering Support” are also in the main offices
providing in-depth technical back-up. “Human Resources” are again in the central offices and supply
appropriate management resources and oversight of human resource development.
Client & Provider Third Party resources include a multinational alliance organization, PANAVIA who
formed the aircraft OEM, and two third party HR suppliers of specialist aircraft technicians for the
contract.
At the Governance resource level, the provider has policies set at corporate level within a functional
structure. As a publicly traded company its operation is driven by its ability to generate financial
return on money raised on capital markets. The MOD has Civil Service rules to work to, and beyond
Case Study of a Nursing Agency
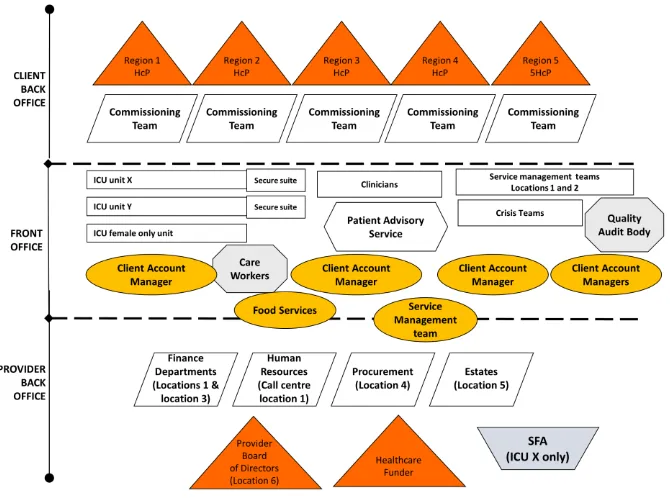
[image:16.595.134.464.129.385.2] [image:16.595.132.467.492.741.2]The image shown in
Figure 4 was produced as part of a project working with a manager to evaluate service provision for
Intensive Care Units (ICU). In line with ethical approval guidelines the groupings have been
anonymized, simplified and service performance will not be discussed.
Several front office Partnered Direct Resources were identified which represent the intensive care
unit service provision located within three different hospitals. Provider Contract Focused
Non-partnered resource groupings include the providers “Client Account Managers” assigned to manage
Healthcare Purchaser (HcP) client accounts. “Food Services” provide dietary specific food for
patients and a “Service Management Team” ensure the service delivered to patients meets HcP
requirement. “Patient Advisory Service” is a Customer Voice organization providing a channel for
patient communication and complaint. Third Party Direct resource providers included “Care
Workers” who refer patients to the units and the “Quality Audit Body” who oversee standards. Each
HcP client has a “Commissioning Team” managing their ICU provision, and a separate Governance
structure. The provider has geographically dispersed service support resources. One of the ICUs was
financed using special financial arrangement (SFA), identified as a back office Third Party Internal
Support resource. The provider had two Governance structures: one relating directly to their
organization with its board of directors and a Healthcare Funder who funded their operation. Each
HcP client had its own Governance. The image was used to communicate within the provider team
how complex their service provision was. The work helped simply the operations and reduce cost.
Case Study of a Tourist Destination
Favelas are visited by ca. 40.000 tourists per year, though such visits retain an inherent potential
danger. The value of tourism to the locals in these areas is not purely economic as tourism also
provides status benefits for the population. A ‘safe’ organized service experience requires an alliance
between the parties engaged, ensuring that the areas visited are free from crime. The complexity of
understanding the organization and challenge of measuring benefits led to an Enterprise Image
Figure 5.
Figure 5. Tourism Enterprise Image
In the case example, two Partnered Direct resources are identified: local tour guides who take
tourists through the favelas; and the ‘designated tour zones’. A Client Contract Focused
arrange their tours. There is a single Customer Voice resource, the “Community Office”. This is the
main point of liaison for the operators and the local community and the site that recruits and helps
co-ordinate tour guides. Third Party Direct resource providers are presented in the case example: a
“Bus Company” who provide local transportation; “Tourist Information” who provide details and
contacts to tourists so that they may join tours; and a “Samba Centre” based in the tourist area that
makes significant revenues by providing dance lessons and displays to tourists. A single Third Party
Indirect resource is a “Local School” in the tourist area which allowed partial access as part of the
‘tourist trail’ and benefits from the perceived prestige from the tourist’s awareness of their work,
and subsequent financial donations. Back office Client Internal Support resource includes a
“Marketing” office to promote the tours and produce materials for hotels and tourist information
offices, and a “Local Booking Agent” who creates the tickets and co-ordinates tour bookings
information for the representatives. Provider Internal Support resources depicted include “Local
Artisans”, a collective of local people who produce memorabilia and art for sale to tourists; a “Supply
Coordinator” acts as supply chain manager linking artisan producers with the local retailers. Client
Third Party resources include “Travel Agents” who promote the favela tourism experience to their
customers and a “Hotel” that works with the tour operator and promotes the tours, amongst other
excursions, as part of their accommodation package. At the Governance resource level, the provider
has two structures. A “Community Organization” works to ensure the success of the operation and
the relationship remains equitable. In addition, “Local Government” agencies, tasked with the
alleviation of poverty, support and monitor this venture. On the provider side, the “Tour Operator”
seeks to co-ordinate resources and ensure the flow of tourists to develop location revenue.
Conclusion
Firms work in an increasingly intertwined fashion, often to such an extent that it becomes impossible
structure of the resources and this knowledge is itself is a core competence for successful complex
service management. Such knowledge is captured by the Enterprise Image approach.
Organizations who engaged in the process have found Enterprise Imaging to be a useful tool for
establishing a shared understanding of a complex enterprise where resources are coordinated to
co-create value, but individual goals are not easily aligned. The Enterprise Image provides an easy to
learn and simple tool that captures and communicates the complexity of business to business
relationships quickly and simply in a single picture.
References
Croom S., Romano P., & Giannakis M. (2000). Supply chain management: an analytical framework for
critical literature review. European Journal of Purchasing & Supply Management. 6(1), 67-83.
Das, T., & Bing-Sheng, T. (2000). A Resource-Based Theory of Strategic Alliances. Journal Of Management. 26(1), 31-62.
Dyer, J.H. (2000). Collaborative Advantage: Winning Through Extended Enterprise Supplier Networks. Oxford University Press: Oxford.
Mills, J., Purchase, V., & Parry, G. (2013). Enterprise Imaging: Raising the necessity of Value
Co-creation in Multi-Organizational Service Enterprises. International Journal of Operations and Production Management. 33(2),159–180.
Mills, J., Parry, G., & Purchase, V. (2011) Enterprise Imaging”, In I. Ng, G. Parry, P. Wilde, D.
McFarlane, & P. Tasker (Eds.), Complex Engineering Service Systems: Concepts and Research (pp.49-65). Springer: London.
Mitchell, R.K., Agle, B., & Wood, D. (1997). Toward a Theory of Stakeholder Identification and
Ng, I., Parry, G., Wilde, P., McFarlane, D., & Tasker, P. (2011). Complex Engineering Service Systems: Concepts and Research. Springer: London.
NIST, (1993). Integration definition for function modeling (IDEF0). Draft Federal Information Processing Standards Publication 183. National Institute of Standards and Technology.
Parry, G. & Tasker, P., (2014). Value and servitization; creating complex deployed responsive
services? Strategic Change.23(5-6), 303-315.
Purchase, V., Parry, G.C., Valerdi, R. Nightingale, D. & Mills, J. (2011a). Enterprise Transformation:
what is it, what are the challenges and why are we interested? Journal of Enterprise Transformation.
1(1): 14-40
Purchase, V., Parry, G., Mills, J. (2011b). Service Enterprise Transformation. In I. Ng, G. Parry, P.
Wilde, D. McFarlane, & P. Tasker (Eds.), Complex Engineering Service Systems: Concepts and Research (pp25-48). Springer: London.
Rother, M. & Shook, J. (1999). Learning to See. Productivity Press: Cambridge USA.
Shostack, G. L. (1984). Designing Services that Deliver. Harvard Business Review. 62(1),133–139.
Spekman, R.E. & Davis, E.W. (2004). Risky business: expanding the discussion on risk and the
extended enterprise. International Journal of Physical Distribution & Logistics Management. 34(5), 414-433.
Acknowledgement
The author would like to acknowledge all colleague’s who’s work contributed towards the
development of the EI approach and who provided source material for case examples. Particularly
Hughes (UWE), who supported the development of this chapter and extensively employed and
tested EI as part of the Bristol and Bath by Design project, AHRC [AH/M005771/1]. Dr Valerie
Purchase (Ulster) and John Mills (IFM, Cambridge) who co-created the original approach as part of
the S4T project funded by Engineering and Physical Sciences Research Council (EPSRC) and BAE