R E S E A R C H
Open Access
Effect and cost of an after-school dance
programme on the physical activity of
11
–
12 year old girls: The Bristol Girls Dance
Project, a school-based cluster randomised
controlled trial
Russell Jago
1*, Mark J. Edwards
1, Simon J. Sebire
1, Keeley Tomkinson
2, Emma L. Bird
3, Kathryn Banfield
1,
Thomas May
1,3, Joanna M. Kesten
1, Ashley R. Cooper
1, Jane E. Powell
3and Peter S. Blair
2Abstract
Background:The aim of this study was to examine the effectiveness and cost of an after-school dance intervention at increasing the physical activity levels of Year 7 girls (age 11–12).
Methods:A cluster randomised controlled trial was conducted in 18 secondary schools. Participants were Year 7 girls attending a study school. The Bristol Girls Dance Project (BGDP) intervention consisted of up to forty, 75-minute dance sessions delivered in the period immediately after school by experienced dance instructors over 20-weeks. The pre-specified primary outcome was accelerometer assessed mean minutes of weekday moderate to vigorous physical activity (MVPA) at time 2 (52 weeks are T0 baseline assessments). Secondary outcomes included accelerometer assessed mean minutes of weekday MVPA at time 1 (while the intervention was still running) and psychosocial outcomes. Intervention costs were assessed.
Results:571 girls participated. Valid accelerometer data were collected from 549 girls at baseline with 508 girls providing valid accelerometer data at baseline and time 2. There were no differences between the intervention and control group for accelerometer assessed physical activity at either time 1 or time 2. Only one third of the girls in the intervention arm met the pre-set adherence criteria of attending two thirds of the dance sessions that were available to them. Instrumental variable regression analyses using complier average causal effects provided no evidence of a difference between girls who attended the sessions and the control group. The average cost of the intervention was £73 per girl, which was reduced to £63 when dance instructor travel expenses were excluded.
Conclusion:This trial showed no evidence that an after-school dance programme can increase the physical activity of Year 7 girls. The trial highlighted the difficulty encountered in maintaining attendance in physical activity programmes delivered in secondary schools. There is a need to find new ways to help adolescent girls to be physically active via identifying ways to support and encourage sustained engagement in physical activity over the life course.
Trial registration:ISRCTN52882523
Keywords:Physical activity, Dance, School, RCT
* Correspondence:[email protected] 1
Centre for Exercise, Nutrition and Health Sciences, School for Policy Studies, University of Bristol, 8 Priory Road, Bristol BS8 1TZ, UK
Full list of author information is available at the end of the article
Introduction
Among adults, physical activity is associated with reduced risk of heart disease, type 2 diabetes and improved psy-chological well-being [1]. Among children and adolescents physical activity is associated with a lower prevalence of obesity, lower blood pressure, lower lipid profile and im-proved psychological well-being [2]. Physical inactivity, defined as less than 600 MET minutes per week, is also the tenth main cause of disability adjusted life years glo-bally [3]. Several recent articles have focussed on the dose response relationship between physical activity and health and suggest that relatively small increases in physical ac-tivity at a population level would result in marked reduc-tions in all-cause mortality [4, 5]. Data from the UK Millennium cohort study has shown that only 51 % of seven year olds met the recommendation of an hour of moderate-to-vigorous intensity physical activity (MVPA) per day [6]. The amount of physical activity in which chil-dren engage reduces as they progress through primary and secondary school, with girls being less active than boys [7, 8]. These patterns also have the potential to track from childhood to adulthood [9]. The start of secondary school (11–12 years of age) is a critical period of change in the physical activity levels of girls [7]. As such, finding ways to help girls to be more active at the start of second-ary school is important for short and long-term health.
Schools provide opportunities to implement public health interventions to large numbers of adolescents [10, 11]. A number of interventions have attempted to increase adolescent physical activity at school, however, systematically reviewed evidence has indicated that the effectiveness of school-based physical activity interven-tions delivered during the curriculum is limited [12]. The review concluded that where there was evidence of an effect, it was mainly due to the results of studies with poor methodological quality [12]. Identified limi-tations included short duration of follow-up, inad-equate adjustment for potential confounders, lack of adjustment for children clustered in schools, and the use of self-report measures of physical activity [12]. A 2012 review of physical activity interventions for chil-dren and adolescents, which included an objective as-sessment of physical activity reported an average improvement of four minutes of MVPA per day in intervention participants when compared to control groups [13]. Of the 30 studies included in the review, only 16 were deemed to be of high methodological quality. Contributory factors to low quality scores in-cluded high attrition, lack of intention to treat analyses, and not adjusting for the clustered nature of the data. A 2015 meta-analysis of physical activity interventions with adolescent girls showed that public health fo-cussed interventions can be effective but the interven-tion effect was enhanced if the interveninterven-tions included
only girls, was school-based and employed a theory of behaviour change [14]. Thus, tailoring interventions to the interests and needs of girls is likely to enhance effectiveness.
Extra-curricular interventions can exploit the space, facilities and infrastructure of schools to provide oppor-tunities for children to be physically active [10, 15, 16]. A 2009 narrative systematic review identified 11 studies that had attempted to increase physical activity via extra-curricular programmes [15], only six studies re-ported effects on physical activity [15]. The review also identified a lack of information about programme adher-ence, intervention components and the effect of attend-ing after-school programmes on overall levels of physical activity. Only six out of nine studies (all conducted in North America and Australasia), identified by another review, provided any data from a period that was at least 12 weeks after the baseline assessment [17]. The authors concluded that lack of statistical power hindered the ability of the studies to assess the intervention effective-ness. After-school is a key period for extra-curricular in-terventions but these inin-terventions differ to lunch-time programmes as they require participants to remain at school rather than being a captive audience. In preparing this paper, we conducted a literature search of rando-mised controlled trials involving after-school interven-tions aimed at increasing child and adolescent physical activity. Our review identified only four further rando-mised controlled trials [18–21] that have been published since 2011 [17] and two of these were feasibility trials conducted by our team [20, 21]. Only our own feasibility studies [20, 21] provided follow-up measurements to de-termine the impact on physical activity levels after the intervention had ceased, with only the dance feasibility showing sustained evidence of promise for an interven-tion effect [20].
Dance is the preferred form of physical activity for many UK secondary school aged girls [22]. Dance is a social activity, combining movement with group activ-ities and music, and provides unique opportunactiv-ities to help girls to be active. Recent studies have suggested that dance can positively effect a range of psychosocial factors [23–25], health outcomes [23] and contribute significantly to the overall MVPA of girls [26]. Addition-ally, dance is seen as a desirable and fun activity for ado-lescent girls [22, 27–29]. We previously reported the results of a feasibility trial in which we showed that an after-school dance programme can have the potential to increase the physical activity levels of secondary school aged girls [20].
the key correlates of behaviour and then manipulating them within the intervention [31]. Self-determination the-ory (SDT)[32] may help to explain physical activity partici-pation. Research using SDT among children shows that physical activity motivation that is autonomous (based on enjoyment or valued benefits) versus controlled (based on guilt or compliance with external demands) is associated with their physical activity, and that autonomous motiv-ation is underpinned by the satisfaction of psychological needs for autonomy, competence and relatedness [33]. Dance is an activity which could progressively increase girls’perceived autonomy to be active (they can be active when and where they want as minimal equipment is needed), increase their competence (skills can be built quickly), and foster meaningful connections with others in a social environment.
It is important to recognise that commissioners have limited resources to improve health of children in schools and as such they need to know whether invest-ments in after-school physical activity programmes are affordable within a set budget [34]. Thus, there is a need for robust evaluations of the effectiveness and cost-effectiveness of paediatric physical activity interventions.
In this paper, we report the results of the Bristol Girls Dance Project (BGDP). The intervention aimed to increase the time spent in weekday MVPA among Year 7 girls via an after-school dance intervention. The BGDP trial used a study design that addressed many of the limitations of pre-vious studies in this area. Specifically, schools were ran-domly allocated to intervention or control arm after baseline data had been collected, there was an objective as-sessment of physical activity using accelerometers, study staff collecting and analysing data were blinded to alloca-tion, the primary analysis was based on intention to treat with the models adjusted for the clustering of children within schools.
Methods
Study design
BGDP was a school-based cluster randomised controlled trial. The trial protocol was published in 2013 prior to participant recruitment and data collection [35]. A more detailed trial analysis plan was developed and approved at our Trial Steering Committee meeting on 4/7/2014 (before the analysis team had access to any data). All analyses have followed the agreed analysis plan. The trial was registered at the controlled trial register prior to data collection (ISRCTN52882523).
Eligibility and Recruitment
Participants were Year 7 (age 11–12) girls, hitherto referred to as ‘girls’ throughout. All mainstream state secondary schools in the constituent Local Authorities (LA) (Bath and North East Somerset, Bristol City, and
North Somerset) were invited to participate in the study. Postal and email invites were sent to relevant staff in all schools and follow-up phone calls were made. Schools were excluded at the outset if they had less than 30 Year 7 girls or if they were a specialist Dance Academy.
As part of the participant recruitment process all Year 7 girls in 22 schools were provided with“taster sessions”of dance content during their regular physical education classes. These sessions were designed to engage low active girls by demonstrating that dance was a fun and social ac-tivity that the girls could engage in regardless of skill or previous dance experience. All taster sessions followed a standard structure and were delivered by independent dance instructors who were employed by the study. A total of 65 taster sessions were delivered in 22 schools that were recruited (One reserve school did not receive any taster sessions). At the end of the taster session girls re-ceived a briefing on the aims of the study and its design, along with parent and participant information sheets. If fewer than 25 children enrolled in a school (after multiple recruitment attempts) the school was withdrawn and replaced with a reserve school (n= 4). When more than 33 children signed up to the study in a given school, chil-dren were randomly ranked and the first 33 were selected to participate by computer algorithm. Children who dropped out before baseline data collection were replaced by reserves when possible. No replacements were made after baseline measurements.
Ethical approval was obtained from the School for Policy Studies ethics and research committee at the University of Bristol (ref: Bristol Girls Dance Project). Written parent consent was obtained for all children who wished to participate in the study. Children received a £10 “Love to Shop”voucher as a reimburse-ment for their time at each of the three data collections.
Randomisation
Randomisation occurred at the school-level. Schools were randomly allocated in a ratio of 1:1 to intervention or control group with nine schools in each trial arm. Balance between trial arms was achieved according to four variables: Local Authority membership, average baseline MVPA, school size, and deprivation (measured as the percentage of pupils in schools eligible for the Department of Education’s Pupil Premium [36]).
Intervention
programme attendance would provide increases in habit-ual physical activity while the programme was running. Both improvements were hypothesised to further sup-port intervention girls’sense of autonomy, competence and belongingness towards being active, which would facilitate their continued activity once the intervention ended. Girls in the control schools provided data only. Control schools received a £500 donation once all data had been collected.
What the intervention involved, including who delivered the different aspects of it
Full details of the intervention components have been re-ported elsewhere [35] and are summarised in Additional file 1: Table A which reports intervention components in accordance with the TIDieR guidelines [37]. Briefly, the intervention consisted of up to forty, 75-minute dance ses-sions provided twice per week between January and July 2014. Session plans included guidance on how to reinforce the underpinning SDT principles, and advice on activities, group work and dance skill development. To reflect a ‘normal’dance session, instructors were able to decide on the genre of dance used, after consultation with the girls in their school. The nine intervention schools were asked to complete as many of the 40 sessions as possible before the end of the school year. Dance sessions were delivered at the school site in appropriate facilities. All sessions were delivered by experienced dance instructors who had undergone a one day induction session. Around the mid-point of the intervention period (April) dance instructors attended a half day booster session which recapped the study objectives and reinforced the motivational principles of SDT.
Ten instructors delivered the intervention. Instructor absences were covered by reserve instructors/those de-livering the intervention in different schools. Due to work commitments one instructor withdrew from the
study midway through the intervention period and was replaced by a reserve. One instructor delivered the inter-vention in two schools.
Participant assessments
Baseline (T0) assessments were undertaken between September and November 2013 (prior to randomisation) when girls were in the first term of Year 7. The first follow-up (T1) was conducted during weeks 17–20 of the intervention and was designed to provide an assess-ment of MVPA during the intervention. The second follow-up (T2) was undertaken approximately 52-weeks after T0 assessments (all T2 assessments were under-taken within 3 weeks of the 52-week target and were all at least 4 months after the intervention had ended). Trained fieldworkers who were blinded to school inter-vention allocation collected all data.
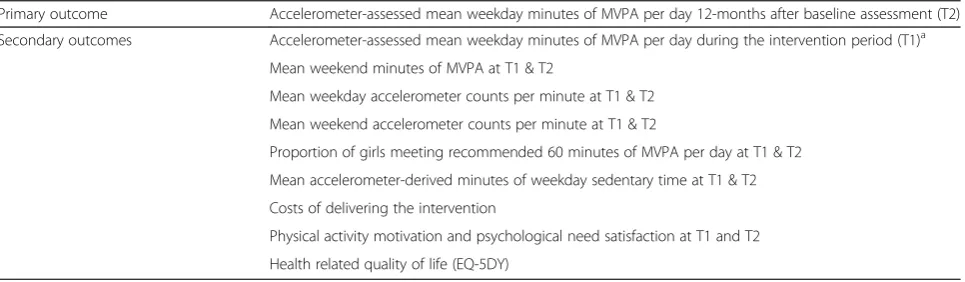
[image:4.595.58.541.551.692.2]The primary and secondary outcome measures assessed at all three time points are listed in Table 1. Physical activ-ity was assessed using an Actigraph GT3X+ accelerom-eter. Participating girls wore an accelerometer for seven days. Accelerometer data were processed to identify days in which valid data were provided. Based on established protocols a valid day of accelerometer data was defined as a minimum of 500 minutes of data between 05:00 and 11.59 pm. Periods of 60 minutes or more in which zero values were recorded were interpreted as‘non-wear’time. For valid days, the mean minutes engaged in MVPA (≥2296 counts per minute) [38] and the mean accelerom-eter counts per minute (an indication of the average inten-sity in which girls engaged) were derived. The following accelerometer variables were then obtained: weekday and weekend day counts per minute, mean weekday and week-end day minutes of MVPA, and mean weekday sedentary time. Girls were included in the analysis if they provided two valid weekdays of data or one valid weekend day for the weekend variables.
Table 1Primary and secondary outcomes
Primary outcome Accelerometer-assessed mean weekday minutes of MVPA per day 12-months after baseline assessment (T2)
Secondary outcomes Accelerometer-assessed mean weekday minutes of MVPA per day during the intervention period (T1)a
Mean weekend minutes of MVPA at T1 & T2
Mean weekday accelerometer counts per minute at T1 & T2
Mean weekend accelerometer counts per minute at T1 & T2
Proportion of girls meeting recommended 60 minutes of MVPA per day at T1 & T2
Mean accelerometer-derived minutes of weekday sedentary time at T1 & T2
Costs of delivering the intervention
Physical activity motivation and psychological need satisfaction at T1 and T2
Health related quality of life (EQ-5DY)
a
Key secondary outcome
MVPAModerate-to-vigorous physical activity
EQ-5D-YEuropean Quality of Life-5 Dimensions (Youth version) T1–20-week follow-up
Girls completed a 67-item psychosocial questionnaire which assessed autonomous and controlled motivation for dance and PA [39], perceptions of autonomy, competence and relatedness [40, 41] within PA, and self-esteem [42]. Girls also completed an EQ-5D-Y form at each time point [43] as a measure of health-related quality of life.
For descriptive purposes, at T0 parents/guardians re-ported on their own ethnicity, highest level of household education and home address. The index of multiple deprivation (IMD) was calculated based on each girl’s home postcode. Height was assessed to the nearest 0.1 cm and weight to the nearest 0.1 kg using a Seca sta-diometer and Seca digital scale, respectively. Participant body mass index (BMI = kg/m2) was calculated and con-verted to an age and gender-specific standard deviation score [44]. The after-school activities in which girls engaged were obtained via parent report at T0 with after-school and weekend participation in activities self-reported by the girls at T1 and T2. Attendance was recorded by dance instructors at each session. The results of an in-depth process evaluation of the study will be reported separately and a link to the study paper placed on the project website (http://www.bristol.ac.uk/ sps/research/researchprojectpages/active7/) when avail-able. Briefly however, the mixed-methods evaluation in-dicated that the girls enjoyed the dance sessions and the decrease in attendance was largely attributed to factors outside of the dance sessions. Fidelity to the underlying theoretical principles was moderate; girls felt that the in-structors provided good support for their competence and relatedness and that there was room for improve-ment in the extent to which instructors supported the girls’autonomy. Dance instructors, school contacts and the girls also indicated that two sessions per week was perhaps too large a commitment.
Reporting of resource use and cost estimation are in ac-cordance with relevant categories of the CHEERS check-list [45]. Data on resource use were collected by the project team and recorded using an existing checklist [46]. Costs were categorised as one-off training costs, recurrent programme preparation costs, recurrent programme de-livery costs, and were stratified by school. Recruitment and marketing costs were identified separately because they depend upon the implementation context for partici-pation in each school setting [47]. These costs might have differential timing at initiation of mainstream delivery and/or may not always apply in practice [45]. Prices were taken from actual costs on time sheets, published and established sources.
Sample size calculation
Sample size calculations were based on detecting a ten-minute difference per day in the habitual MVPA of the intervention group when compared to the control group.
This difference was selected because a 2012 meta-analysis showed that a ten-minute change in MVPA would have significant impacts on children’s cardio-metabolic risk profile [48] and our feasibility trial showed that such an ef-fect was achievable based on the 95 % confidence intervals [20]. The feasibility trial also suggested that a ten-minute MVPA change would increase the proportion of girls meeting current recommendation of 60 minutes of MVPA per day [1] from 8 to 17 %. The sample size calculations were inflated to take account of the clustering of girls in schools. In the feasibility trial the upper limit of the school associated intra-cluster correlation was 0.087. Thus, using an ICC of 0.087 and a final cluster size for analysis of 24 (20 % drop-out from a target of 30 girls per school) we es-timated that with 90 % power and 5 % (two-sided) alpha an initial sample of 540 girls from 18 schools (30 per school) was required. To account for potential drop-out between data collection (autumn term 2013) and the intervention start (January 2014) we increased the max-imum number of girls per school to 33.
Statistical analyses
The statistical analysis plan was agreed by the project Trial Steering Committee prior to analyses being conducted. Descriptive statistics (mean, standard deviation, median, inter-quartile range, and percent) were used to describe the T0 data and levels of data provision at T1 and T2. Multi-variable mixed effects linear models were used to assess primary and secondary outcomes at T1 and T2. The primary analysis included weekday MVPA at T2 and included trial arm and weekday MVPA at T0. Variables used in the randomisation process (local authority, school size and school level percentage of deprivation) were also included in the model. This process was repeated for all secondary outcomes. A comparable logistic regression model was used to assess whether there was a difference in the proportion of girls who met the 60 minutes of MVPA per day guidance at T1 and T2. Models for week-day MVPA at T2 and T1 were re-run using a complier average causal effect (CACE) instrumental variable regres-sion models [49]. The CACE models included all girls and used random allocation as an instrumental variable to cal-culate the effect of the intervention for those who adhered to it, by comparing those girls observed to attend the dance sessions with those in the comparison group who would have attended if invited [49]. Girls were considered to have adhered to the study protocol if they attended 2/3 of the sessions provided at their school. The CACE models were run once the analysis team had become un-blinded (2nd Feb 2015). All models were adjusted for the clustering of girls in schools and were conducted in Stata (version 13.1, College Station, TX).
undertaken to gain a fuller understanding of study find-ings. A rank-sum test was used to examine whether there was a difference in the individual level socio-economic position of girls between the intervention and control group. As there was some evidence (p< 0.01) of a difference in socio-economic position (intervention group having lower levels of deprivation), the primary and the key secondary outcome analyses (T1 weekday MVPA) were re-run with individual level IMD as a co-variate. As there was minimal missing data and no evi-dence of a systematic bias in the proportion of missing data, we considered missing data to be missing com-pletely at random and did not conduct further imput-ation models [50, 51].
To understand the amount of physical activity that was obtained during the dance sessions the accelerom-eter data were further examined to identify the mean minutes of sedentary, light, MVPA and mean CPM dur-ing the period that the dance sessions were scheduled to run at T1 (15:00 – 17:00). These data are included in
Supplementary Table C for the girls who attended the dance sessions during the monitoring period on days of the dance classes (dance days) and for the day after the dance class (non-dance day). The same data were then presented for girls assigned to the intervention group who did not attend the dance classes and control group girls. Paired sample t-tests were used to examine differ-ences between the accelerometer variables for dance days and non-dance days.
Based on UK Population Norms for EQ-5D, EQ-5D-Y responses from each time point were converted into util-ity scores ranging from 0.0 (dead) to 1.0 (perfect health) [52]. Mann Whitney U tests were used to examine dif-ferences between intervention and control group utility scores at each time point.
[image:6.595.60.540.348.707.2]Results
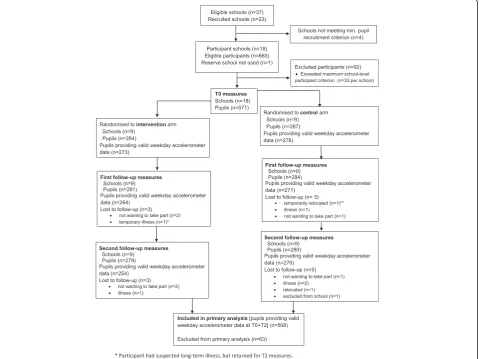
Figure 1 shows the trial profile. A total of 1877 Year 7 girls were eligible to participate in the 18 schools that formed the final study sample. 663 pupils from these
schools provided consent to participate (35.3 % of the sample population), and 571 enrolled. Nine schools were over-subscribed (range = 34–62) and there was an aver-age of 31.7 girls per school (range = 26–33). Data provision at each time point is shown in Additional file 1: Table B. 571 girls were randomized to the intervention or control arm with nine schools per trial arm. Of the 571 girls, there were 559 who provided some data at T2. 508 girls met the accelerometer inclusion criteria for the primary analysis. No adverse events were reported dur-ing the study.
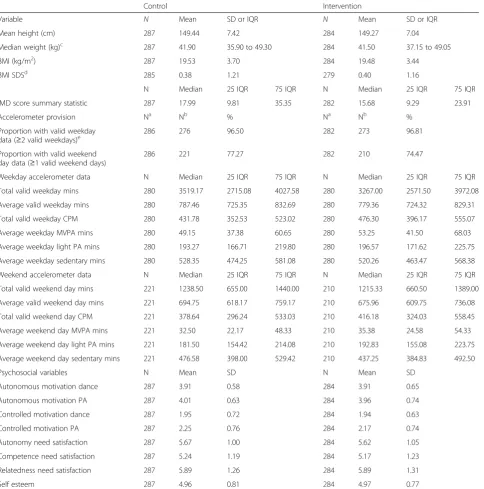
Baseline (T0) characteristics (Table 2) show that almost 97 % of girls provided at least two days of valid weekday accelerometer data. Girls allocated to the intervention group performed an average of 53 minutes of weekday MVPA compared to 49 minutes in the control group.
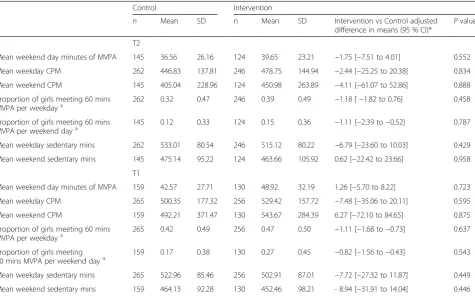
The main intention-to-treat analyses with adjustment for baseline values found no difference in weekday MVPA at T2 in children allocated to the intervention group when compared to those allocated to the control group (Table 3). There was also no difference in the key secondary outcome of weekday MVPA at T1. There was no evidence of a difference in any accelerometer derived variables at T1 or T2 (Table 4). 81 girls with valid accel-erometer data at T0 and T2 met the adherence criteria. Of the girls who provided valid accelerometer data at T0 and T1, 83 met the adherence criteria. The unadjusted mean (standard deviation) minutes of weekday MVPA at T2 was 53.6 (18.9) for the girls that adhered and 58.0 (23.1) for the girls that did not adhere. At T1 the means and standard deviations were 59.8 (21.6) for the adhered group and 60.8 (23.7) for the non-adhered group. The CACE per-protocol analysis found no evidence of a dif-ference between the two groups (Table 3) for weekday MVPA at T2 or T1. Further sensitivity analysis (data not shown) yielded no evidence of changes to the findings after additional adjustment for individual level IMD.
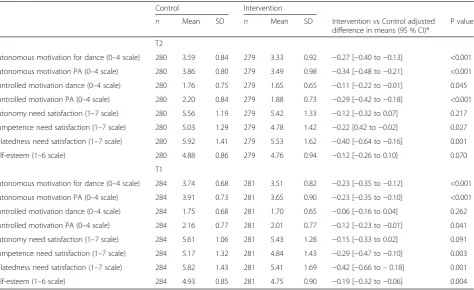
There was evidence of small differences in all of the motivation scores at T2, except autonomy need satisfac-tion and self-esteem, with higher scores in the control group. There was a similar pattern at T1 where there was some evidence of a difference for all variables except controlled motivation for dance and autonomy need sat-isfaction (Table 5).
Girls who attended dance classes during the measure-ment period obtained 4.7 more minutes of MVPA, 14.2 more minutes of light intensity activity and 258 more ac-celerometer counts per minute between 15:00 and 17:00 on dance days versus non-dance days (Additional file 1: Table C). For intervention girls who did not attend dance sessions on the measurement days, there was no evidence of differences in the MVPA, light activity or CPM on the days that dance clubs were running com-pared with non-dance club days. The levels of MVPA,
light and CPM for non-attendees were also comparable to the activity levels of control group girls on these days. Thus, for girls who attended on dance days, there were differences in MVPA, light and CPM, but the differences in MVPA were comparatively small.
Descriptive information on the number and proportion of children attending a variety of after-school activities at T0 is shown in Additional file 1: Table D. There were no apparent differences between the two trial arms for any of these variables. The number and proportion of interven-tion and control arm girls attending any non-school dance session and the number of sessions per week attended is shown in Additional file 1: Table E. The table shows some evidence of a difference in dance participation between the two study arms at T1 (36 % control, 31 % interven-tion) which was inverted at T2 (30 % control, 34 % inter-vention). There were no clear differences between trial arms in the number and proportion of girls attending sport clubs, activity clubs, playing on their own or en-gaging in sitting down activities at T1 and T2 (Additional file 1: Table F) .
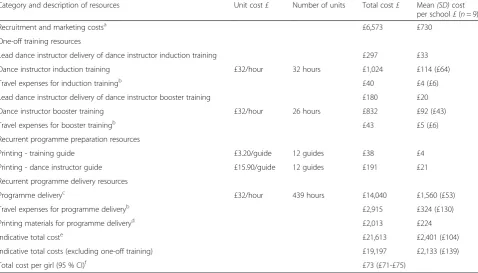
A breakdown of the intervention cost is shown in Table 6. The BGDP cost £21,613; $35,878; €26,152 (in 2013–14 prices) across 9 schools, with an average cost per school of £2,401; $3,985; €2,905 and a variation in cost of £104; $173;€126. The average cost per girl was £73; $120;€87 with a range of £68-£77; $113-$128;€82-€93, due to differ-ences in the total number of girls recruited to the study at study initiation. Sensitivity analyses demonstrated the aver-age cost per girl was reduced to £63; $103;€75 when dance instructor travel expenses were excluded. There was no evidence of differences in EQ-5D-Y utility scores in partici-pants allocated to the intervention group compared with those allocated to the control group (Additional file 1: Table G).
Discussion
allocated to the intervention arm who attended dance clas-ses on the days of measurement obtained 4.7 more minutes of MVPA, 14.2 more minutes of light intensity physical ac-tivity and 258 more accelerometer counts per minute
[image:8.595.59.544.101.591.2]between 15.00 and 17.00 on dance days versus non-dance days. Data suggest that the impact on MVPA was relatively small and would have been diluted after accounting for non-dance days. There was evidence of a difference in all of Table 2Baseline data descriptive statistics
Control Intervention
Variable N Mean SD or IQR N Mean SD or IQR
Mean height (cm) 287 149.44 7.42 284 149.27 7.04
Median weight (kg)c 287 41.90 35.90 to 49.30 284 41.50 37.15 to 49.05
BMI (kg/m2) 287 19.53 3.70 284 19.48 3.44
BMI SDSd 285 0.38 1.21 279 0.40 1.16
N Median 25 IQR 75 IQR N Median 25 IQR 75 IQR
IMD score summary statistic 287 17.99 9.81 35.35 282 15.68 9.29 23.91
Accelerometer provision Na Nb % Na Nb %
Proportion with valid weekday
data (≥2 valid weekdays)e 286 276 96.50 282 273 96.81
Proportion with valid weekend day data (≥1 valid weekend days)
286 221 77.27 282 210 74.47
Weekday accelerometer data N Median 25 IQR 75 IQR N Median 25 IQR 75 IQR
Total valid weekday mins 280 3519.17 2715.08 4027.58 280 3267.00 2571.50 3972.08
Average valid weekday mins 280 787.46 725.35 832.69 280 779.36 724.32 829.31
Total valid weekday CPM 280 431.78 352.53 523.02 280 476.30 396.17 555.07
Average weekday MVPA mins 280 49.15 37.38 60.65 280 53.25 41.50 68.03
Average weekday light PA mins 280 193.27 166.71 219.80 280 196.57 171.62 225.75
Average weekday sedentary mins 280 528.35 474.25 581.08 280 520.26 463.47 568.38
Weekend accelerometer data N Median 25 IQR 75 IQR N Median 25 IQR 75 IQR
Total valid weekend day mins 221 1238.50 655.00 1440.00 210 1215.33 660.50 1389.00
Average valid weekend day mins 221 694.75 618.17 759.17 210 675.96 609.75 736.08
Total valid weekend day CPM 221 378.64 296.24 533.03 210 416.18 324.03 558.45
Average weekend day MVPA mins 221 32.50 22.17 48.33 210 35.38 24.58 54.33
Average weekend day light PA mins 221 181.50 154.42 214.08 210 192.83 155.08 223.75
Average weekend day sedentary mins 221 476.58 398.00 529.42 210 437.25 384.83 492.50
Psychosocial variables N Mean SD N Mean SD
Autonomous motivation dance 287 3.91 0.58 284 3.91 0.65
Autonomous motivation PA 287 4.01 0.63 284 3.96 0.74
Controlled motivation dance 287 1.95 0.72 284 1.94 0.63
Controlled motivation PA 287 2.25 0.76 284 2.17 0.74
Autonomy need satisfaction 287 5.67 1.00 284 5.62 1.05
Competence need satisfaction 287 5.24 1.19 284 5.17 1.23
Relatedness need satisfaction 287 5.89 1.26 284 5.89 1.31
Self esteem 287 4.96 0.81 284 4.97 0.77
Na
–N of participants with any valid accelerometer data Nb
–N of participants meeting inclusion criteria
c
Median & IQR reported for weight as it is non normal
d
Age adjusted BMI score. Missing data due to no date of birth being reported
e
Percentage of girls who had≥2 valid week days of accelerometer data at T0. PA - Physical Activity
the SDT-based motivation scores at T2, except autonomy need satisfaction and self-esteem, with higher scores in the control group.
Additional exploratory analyses showed that girls in the intervention arm who attended the dance sessions obtained 15 more minutes of light intensity physical
[image:9.595.54.538.113.203.2]activity and 4.7 more minutes of MVPA when compared to MVPA on days that the clubs did not run. This sug-gests that for the 1/3 of the girls adhering to the inter-vention the dance programme was a contributing source of physical activity. However, the level of activity was lower than anticipated, suggesting that session intensity
Table 4Means and standard deviations by trial arm and linear mixed model adjusted for imbalance at baseline for accelerometer assessed secondary outcomes at T1 and T2
Control Intervention
n Mean SD n Mean SD Intervention vs Control adjusted
difference in means (95 % CI)* P value
T2
Mean weekend day minutes of MVPA 145 36.56 26.16 124 39.65 23.21 −1.75 [−7.51 to 4.01] 0.552
Mean weekday CPM 262 446.83 137.81 246 478.75 144.94 −2.44 [−25.25 to 20.38] 0.834
Mean weekend CPM 145 405.04 228.96 124 450.98 263.89 −4.11 [−61.07 to 52.86] 0.888
Proportion of girls meeting 60 mins
MVPA per weekdaya 262 0.32 0.47 246 0.39 0.49 −1.18 [−1.82 to 0.76] 0.458
Proportion of girls meeting 60 mins MVPA per weekend daya
145 0.12 0.33 124 0.15 0.36 −1.11 [−2.39 to−0.52] 0.787
Mean weekday sedentary mins 262 533.01 80.54 246 515.12 80.22 −6.79 [−23.60 to 10.03] 0.429
Mean weekend sedentary mins 145 475.14 95.22 124 463.66 105.92 0.62 [−22.42 to 23.66] 0.958
T1
Mean weekend day minutes of MVPA 159 42.57 27.71 130 48.92 32.19 1.26 [−5.70 to 8.22] 0.723
Mean weekday CPM 265 500.35 177.32 256 529.42 157.72 −7.48 [−35.06 to 20.11] 0.595
Mean weekend CPM 159 492.21 371.47 130 543.67 284.39 6.27 [−72.10 to 84.65] 0.875
Proportion of girls meeting 60 mins
MVPA per weekdaya 265 0.42 0.49 256 0.47 0.50 −1.11 [−1.68 to−0.73] 0.637
Proportion of girls meeting 60 mins MVPA per weekend daya
159 0.17 0.38 130 0.27 0.45 −0.82 [−1.56 to−0.43] 0.543
Mean weekday sedentary mins 265 522.96 85.46 256 502.91 87.01 −7.72 [−27.32 to 11.87] 0.449
Mean weekend sedentary mins 159 464.13 92.28 130 452.46 98.21 - 8.94 [−31.91 to 14.04] 0.446
*For between group differences the control group is the reference group with models adjusted for baseline value, LEA, school size, school level deprivation and school-level clustering
a
Odds ratio presented in Coefficient column
MVPAmoderate-to-vigorous physical activity
[image:9.595.61.537.394.690.2]CPMcounts per Minute
Table 3Means and standard deviations by trial arm and linear mixed model adjusted for imbalance at baseline for Weekday MVPA at T1 and T2
Control Intervention
n Mean SD n Mean SD Intervention vs Control adjusted
difference in means (95 % CI)*
Pvalue
T2 Mean weekday MVPAa 262 53.15 19.61 246 56.55 21.92
−1.52 [−4.76 to 1.73] 0.359
T1 Mean weekday MVPAb 265 57.69 19.39 256 60.46 22.98
−1.52 [−5.03 to 1.98] 0.395
T2 MVPA weekday CACE analysis 508 - - - −4.79 [−14.53 to 4.96] 0.336
T1 MVPA weekday CACE analysis 521 - - - −4.86 [−18.41 to 6.91] 0.365
a
Primary comparison
b
Key secondary outcome
*For between group differences the control group is the reference group with models adjusted for baseline mean weekday MVPA, Local Education Authority, school size, school level deprivation, school level baseline MVPA, the number of total valid week days at T0, the number of total valid week days at T2 (or T1) and school-level clustering
MVPAmoderate-to-vigorous physical activity
CACEcomplier Average Casual Effect (Instrumental variable regression model). T1–20-week follow-up
needed to be greater in order to impact on MVPA at the T1 assessment. This finding implies that the dance clas-ses provided physical activity but the clas-session intensity at the point of measurement was lower than we antici-pated. This low level of activity may reflect the stage of the intervention as many intervention groups were pre-paring for a dance performance at this time and it is conceivable that levels of activity during performance preparation may be lower (e.g., rehearsing, watching, and discussing) than during general sessions when activ-ity dominates. A recent US study has reported that ado-lescent girls obtained an average of 17 minutes of MVPA from a dance class and that there was scope for further increases in the MVPA obtained from the session [54]. As such, the study findings are consistent with previous studies, which have shown that it is possible to deliver after-school programmes, and that dance can provide physical activity but more work is needed to optimise the intensity of the sessions. Moreover, the amount of MVPA that was obtained by the girls in the intervention arm at T1 is likely to be an underestimate and may have been higher if the girls were not preparing for dance per-formances. Equally, it may also be the case that the acceler-ometers were unable to capture the twisting, turning and bending that were part of the dance classes and as such ac-tivity in the dance classes is underestimated. Collectively,
the data suggest that for some girls dance is a viable form of physical activity but the potential public health utility of this intervention approach could not be elucidated as we do not know if it is limited because of the attendance levels. This finding suggests that schools should consider offering dance programmes dance sessions which are not as high an attendance commitment than BGDP (i.e., per-haps fewer weeks and once per week.
[image:10.595.64.539.99.389.2]A number of previous studies have shown that it is possible to deliver effective physical activity interven-tions in the after-school period [15, 18, 55–57]. The ma-jority of these studies have originated from the US and have focussed on increasing capacity in pre-existing programmes by training the staff, who are either school staff or coaches from well-established programmes such as the YMCA, to increase the quality of the physical ac-tivity provided. This option was not possible in the UK school system where after-school provision is inconsist-ent varying in terms of the number of clubs offered, duration and quality both within and between schools. UK after-school provision often consists of “clubs”that are focussed on competitive invasion games such as football, rugby, netball or hockey and generally do not include dance [58]. In this context, the results of this study show that it is possible to instigate new after-school clubs in the UK, but the content of the sessions Table 5Psychosocial Regression Results for T1 and T2
Control Intervention
n Mean SD n Mean SD Intervention vs Control adjusted difference in means (95 % CI)*
P value
T2
Autonomous motivation for dance (0–4 scale) 280 3.59 0.84 279 3.33 0.92 −0.27 [−0.40 to−0.13] <0.001
Autonomous motivation PA (0–4 scale) 280 3.86 0.80 279 3.49 0.98 −0.34 [−0.48 to−0.21] <0.001
Controlled motivation dance (0–4 scale) 280 1.76 0.75 279 1.65 0.65 −0.11 [−0.22 to−0.01] 0.045
Controlled motivation PA (0–4 scale) 280 2.20 0.84 279 1.88 0.73 −0.29 [−0.42 to−0.18] <0.001
Autonomy need satisfaction (1–7 scale) 280 5.56 1.19 279 5.42 1.33 −0.12 [−0.32 to 0.07] 0.217
Competence need satisfaction (1–7 scale) 280 5.03 1.29 279 4.78 1.42 −0.22 [0.42 to−0.02] 0.027
Relatedness need satisfaction (1–7 scale) 280 5.92 1.41 279 5.53 1.62 −0.40 [−0.64 to−0.16] 0.001
Self-esteem (1–6 scale) 280 4.88 0.86 279 4.76 0.94 −0.12 [−0.26 to 0.10] 0.070
T1
Autonomous motivation for dance (0–4 scale) 284 3.74 0.68 281 3.51 0.82 −0.23 [−0.35 to−0.12] <0.001
Autonomous motivation PA (0–4 scale) 284 3.91 0.73 281 3.65 0.90 −0.23 [−0.35 to−0.10] <0.001
Controlled motivation dance (0–4 scale) 284 1.75 0.68 281 1.70 0.65 −0.06 [−0.16 to 0.04] 0.262
Controlled motivation PA (0–4 scale) 284 2.16 0.77 281 2.01 0.77 −0.12 [−0.23 to−0.01] 0.041
Autonomy need satisfaction (1–7 scale) 284 5.61 1.06 281 5.43 1.28 −0.15 [−0.33 to 0.02] 0.091
Competence need satisfaction (1–7 scale) 284 5.17 1.32 281 4.84 1.43 −0.29 [−0.47 to−0.10] 0.003
Relatedness need satisfaction (1–7 scale) 284 5.82 1.43 281 5.41 1.69 −0.42 [−0.66 to–0.18] 0.001
Self-esteem (1–6 scale) 284 4.93 0.85 281 4.75 0.90 −0.19 [−0.32 to−0.06] 0.004
*For between group differences the control group is the reference group with models adjusted for baseline value, LEA, school size, school level deprivation and school-level clustering
needs to be optimised to maintain attendance, session intensity and effect on habitual physical activity.
The lack of a difference in weekday MVPA between the intervention and control groups at T1 and T2 could have been a function of the characteristics of the girls who were recruited into the study who were reasonably active at baseline; the intervention and control group girls obtained 53 and 49 minutes of weekday MVPA respectively. As noted above, it has been suggested that the greatest reductions in all-cause mortality and other health benefits will be achieved by helping individuals who are currently inactive to achieve moderate in-creases in MVPA [4, 5]. However, baseline physical ac-tivity levels suggest that girls were already reasonably active and therefore the potential to increase MVPA was limited. Thus, these findings might suggest that there is a need to target physical activity interventions at children with lower levels of physical activity. It also leads to the conclusion that it may be beneficial for clinicians to work with physical activity professionals in order to identify the children in greatest need of in-creases in physical activity.
[image:11.595.59.538.102.375.2]The girls recruited to the study were considerably more active than the girls who took part in the feasibil-ity study, who obtained an average of 35 minutes of MVPA per day at baseline [20]. Identifying the reasons for this considerable difference is difficult. In the current study the girls received a taster session as part of the recruitment campaign. This session was delivered by independent dance instructors, was standardised across schools, and focussed on showing that dance could be an enjoyable activity in which all girls, regard-less of previous dance experience, could enjoy. It was therefore specifically intended to encourage girls who were less physically active to join the study and staff perceptions are that we recruited a cross-section of girls with a range of different levels of physical activity. The only other difference in terms of recruitment between the feasibility study and the current study was the tim-ing of the recruitment. In the current study, recruitment was conducted at the start of the autumn term when the girls had only recently joined the school. In the feasibility study, recruitment was conducted at the start of the spring term of Year 7 and it is possible that this Table 6BGDP resources and costs
Category and description of resources Unit cost£ Number of units Total cost£ Mean(SD)cost per school£(n= 9)
Recruitment and marketing costsa £6,573 £730
One-off training resources
Lead dance instructor delivery of dance instructor induction training £297 £33
Dance instructor induction training £32/hour 32 hours £1,024 £114 (£64)
Travel expenses for induction trainingb £40 £4 (£6)
Lead dance instructor delivery of dance instructor booster training £180 £20
Dance instructor booster training £32/hour 26 hours £832 £92 (£43)
Travel expenses for booster trainingb £43 £5 (£6)
Recurrent programme preparation resources
Printing - training guide £3.20/guide 12 guides £38 £4
Printing - dance instructor guide £15.90/guide 12 guides £191 £21
Recurrent programme delivery resources
Programme deliveryc £32/hour 439 hours £14,040 £1,560 (£53)
Travel expenses for programme deliveryb £2,915 £324 (£130)
Printing materials for programme deliveryd £2,013 £224
Indicative total coste £21,613 £2,401 (£104)
Indicative total costs (excluding one-off training) £19,197 £2,133 (£139)
Total cost per girl (95 % CI)f £73 (£71-£75)
a
Excluded from indicative total cost.
b
Dance instructors could claim up to £10 travel expenses per session, average travel expenses claimed for induction training, booster training and programme delivery = £333 (SD = £136).
c
Dance instructors were paid £32.00 per hour (each dance session was 1.25 hours in duration), sessions claimed ranged from 2–71 sessions, average sessions claimed 34 (SD = 19). Additional programme delivery expenses were claimed by dance instructors if they had provided cover for another dance instructor during programme delivery.
d
Registers, dance diaries, spring half term reminder cards, Easter reminder cards, summer half term reminder cards, post-intervention dance booklets.
e
Mainstream implementation of the programme would not include recruitment and marketing costs and were therefore excluded from the indicative total cost of BGDP.
f
delay allowed time for the more active girls to join other team sports programmes within the school.
Analysis of secondary psychosocial variables showed that both autonomous and controlled motivation for phys-ical activity and dance was lower in the intervention group than the control group at T1 and T2. The reduction in controlled motivation suggests that intervention girls felt less motivated by guilt or external contingencies, which is motivationally adaptive and partially consistent with our hypotheses. However, the concurrent reduction in autono-mous motivation in the intervention group is suggestive of an overall reduction of motivational quantity, which is not what we hypothesised. Perceptions of competence and relatedness were also lower in intervention versus control group girls, which was not expected within the context of a need–supportive intervention. Potential explanations include low intervention theory fidelity (which will be in-vestigated in the process evaluation) and the timing of the measures (i.e., when girls were preparing for a perform-ance which may have threatened perceptions of compe-tence or social disagreements between girls).
Relation to other studies
A 2012 meta-analysis of physical activity interventions that used an objective assessment of physical activity re-ported strong evidence of a small effect on MVPA of ap-proximately four additional minutes per day [13]. The authors of that review suggested that the relatively small effect of physical activity interventions could be because girls in the intervention group swap one form of activity for an equally intense form of physical activity. However, examination of participant after-school activities be-tween 15:00 and bedtime for intervention and control group girls provided no descriptive evidence of a differ-ence between groups across all types of activities. There was, however, limited evidence of a small difference in dance participation between the two study arms at T1 (36 % control, 31 % intervention) which was inverted at T2 (30 % control, 34 % intervention). This might suggest that a small proportion of girls in the intervention arm did not participate in additional dance activities during the intervention period but when the dance sessions had stopped they took part in more dance. This finding may suggest that any trading of behaviours due to attending extra-curricular programs is limited to the focus of the extra-curricular club and approaches that focus on more general, non-specific forms of physical activity may hold greater potential.
A number of studies have suggested that dance holds promise as a means of engaging girls in physical activity and small studies have proposed a number of physical and mental benefits of dance [24–26, 59, 60]. The poten-tial of this study to provide information on the long-term physical and mental health benefits of dance for
adolescent girls is limited because only 1/3 of the inter-vention girls met the pre-specified attendance criteria. As such it is not possible to use the data from this pro-ject to assess the effect of attending dance programmes on self-esteem or other health outcomes. The qualitative elements of this project, which will be reported else-where, showed that children enjoyed the sessions and valued the content of the programme. Attendance was influenced by the days that the programme ran, the duration of the programme, school support for the programme and competing activities at the school and these are all issues that could be addressed in future after-school programmes.
Strengths and weaknesses of the study
Conclusions
This trial showed no evidence that an after-school dance programme can increase the physical activity of Year 7 girls. The findings from this study raise a num-ber of unanswered questions for physicians, public health practitioners and researchers. The most import-ant question is how can we help adolescent girls to be physically active? We developed this study because we hypothesized that dance, an activity that many girls have said they enjoy, would be a useful means of en-couraging greater levels of physical activity. However, this dance-based intervention, in which only 1/3 of the girls attended 2/3 of the sessions, had no impact on physical activity during the programme or 12 months after the baseline data had been collected. The data presented in this paper also suggests that there was lit-tle evidence of physical activity compensation in which children swap one activity for another, but we did not assess whether school travel mode, a key source of physical activity for adolescent girls [62] changed as a result of attending the dance classes. A more in-depth examination of changes in physical activity patterns as a result of participating in defined activities may there-fore be warranted. In light of the results of this study, a key challenge for future research is to find ways to estab-lish sustainable after-school programmes and optimise the delivery within these settings. Such an approach would significantly enhance external validity but would be reliant on the establishment of consistent after-school provision in UK secondary schools. In addition, it is necessary to understand how to engage inactive girls in physical activity interventions. More work is needed to find ways to help adolescent girls to be physically active. Crucially we need to either deliver activities such as dance in a way that girls can adhere to and/or identify alternative activities that adolescent girls will maintain.
Additional file
Additional file 1:Supplementary Table A.The Bristol Girls Dance Project intervention details - TIDieR checklist.Supplementary Table B.Data provision for participants at each time point by trial arm.
Supplementary Table C.Means (SD) for physical activity variables intervention girls attending and not attending dance classes during measurement period between 3 and 5 pm.Supplementary Table D.
After-school activity engagement of girls at T0.Supplementary Table E.
Engagement in dance activities at T1 and T2.Supplementary Table F.
Afterschool (3.30pm-bedtime) activity engagement during the last week.
Supplementary Table G.Health outcomes measured in BGDP - responses to the EQ-5D-Y descriptive system. (DOCX 47 kb)
Competing interests
The authors declare that they have no competing interests.
Authors’contributions
RJ, SJS, ARC and JEP were involved in the study design and in seeking funding for it. ME and RJ were responsible for the study conduct. RJ and ME wrote the first draft of the paper and coordinated contributions from the
co-authors. KT and PSB wrote the analysis plan used for this paper and completed all analyses. JK and SS were responsible for the process evaluation. ELB and JEP were responsible for the economic evaluation. ME managed the data collection with input from RJ, SJS, JEP and other members of the study team. All authors made critical comments on drafts of the paper and approved the final submission.
Acknowledgements and funding
We would like to thanks the dance instructors that delivered the BGDP dance sessions and all school staff and pupils who took part in the study. We thank all study staff and Local Advisory Group members for their input. We also thank the Chair and Independent members of the Trial Steering Committee. The views expressed in this paper are those of the authors and not necessarily anyone listed in the acknowledgement list.
The study was funded by the National Institute for Health Research Public Health Research (NIHR PHR) Programme (project number 11/3050/01). The views and opinions expressed therein are those of the authors and do not necessarily reflect those of the NIHR PHR Programme or the Department of Health. This study was designed and delivered in collaboration with the Bristol Randomised Trials Collaboration (BRTC), a UKCRC Registered Clinical Trials Unit in receipt of National Institute for Health Research CTU support funding. The work was undertaken with the support of the Centre for the Development and Evaluation of Complex Interventions for Public Health Improvement (DECIPHer), a UKCRC Public Health Research Centre of Excellence. Joint funding (MR/KO232331/1) from the British Heart Foundation, Cancer Research UK, Economic and Social Research Council, Medical Research Council, the Welsh Government and the Wellcome Trust, under the auspices of the UK Clinical Research Collaboration, is gratefully acknowledged. Funding for the delivery of the intervention was provided by Bristol Primary Care Trust, North Somerset Council and Bath and North East Somerset Council. None of the funders had involvement in the Trial Steering Committee, the data analysis, data interpretation, data collection, or writing of the paper. The views expressed in this publication are those of the authors and not necessarily any of the funding bodies listed here.
Author details
1
Centre for Exercise, Nutrition and Health Sciences, School for Policy Studies, University of Bristol, 8 Priory Road, Bristol BS8 1TZ, UK.2Bristol Randomised Trials Collaboration, School of Social and Community Medicine, University of Bristol, Bristol BS8 2PS, UK.3Health and Social Sciences, University of the West of England, Bristol, UK.
Received: 3 July 2015 Accepted: 22 September 2015
References
1. Department of Health (UK). Start Active, Stay Active: A Report on Physical activity from the four Home Countries’Chief Medical Officers. London: Department of Health (UK); 2011. p. 1–59.
2. Strong WB, Malina RM, Blimkie CJ, Daniels SR, Dishman RK, Gutin B, et al. Evidence based physical activity for school-age youth. J Pediatr. 2005;146(6):732–7.
3. Lim SS, Vos T, Flaxman AD, Danaei G, Shibuya K, Adair-Rohani H, et al. A comparative risk assessment of burden of disease and injury attributable to 67 risk factors and risk factor clusters in 21 regions, 1990–2010: a systematic analysis for the Global Burden of Disease Study 2010. Lancet.
2012;380(9859):2224–60.
4. de Souto Barreto P. Global health agenda on non-communicable diseases: has WHO set a smart goal for physical activity? BMJ. 2015;350:h23. 5. Heath GW, Parra DC, Sarmiento OL, Andersen LB, Owen N, Goenka S, et al.
Evidence-based intervention in physical activity: lessons from around the world. Lancet. 2012;380(9838):272–81.
6. Griffiths LJ, Cortina-Borja M, Sera F, Pouliou T, Geraci M, Rich C, et al. How active are our children? Findings from the Millennium Cohort Study. BMJ Open. 2013;3(8):e002893.
7. Nader PR, Bradley RH, Houts RM, McRitchie SL, O'Brien M. Moderate-to-vigorous physical activity from ages 9 to 15 years. JAMA. 2008;300(3):295–305. 8. Collings PJ, Wijndaele K, Corder K, Westgate K, Ridgway CL, Dunn V, et al.
9. McMurray RG, Harrell JS, Bangdiwala SI, Hu J. Tracking of physical activity and aerobic power from childhood through adolescence. Med Sci Sports Exerc. 2003;35(11):1914–22.
10. Jago R, Baranowski T. Non-curricular approaches for increasing physical activity in youth: a review. Prev Med. 2004;39(1):157–63.
11. Pate RR, O'Neill JR. After-school interventions to increase physical activity among youth. Br J Sports Med. 2009;43(1):14–8.
12. van Sluijs EM, McMinn AM, Griffin SJ. Effectiveness of interventions to promote physical activity in children and adolescents: systematic review of controlled trials. BMJ. 2007;335(7622):703.
13. Metcalf B, Henley W, Wilkin T. Effectiveness of intervention on physical activity of children: systematic review and meta-analysis of controlled trials with objectively measured outcomes (EarlyBird 54). BMJ. 2012;345:e5888. 14. Pearson N, Braithwaite R, Biddle SJ. The effectiveness of interventions to increase physical activity among adolescent girls: a meta-analysis. Acad Pediatr. 2015;15(1):9–18.
15. Beets MW, Beighle A, Erwin HE, Huberty JL. After-school program impact on physical activity and fitness: a meta-analysis. Am J Prev Med. 2009;36(6):527–37. 16. De Meester A, Aelterman N, Cardon G, De Bourdeaudhuij I, Haerens L.
Extracurricular school-based sports as a motivating vehicle for sports participation in youth: a cross-sectional study. Int J Behav Nutr Phys Act. 2014;11:48.
17. Atkin AJ, Gorely T, Biddle SJ, Cavill N, Foster C. Interventions to promote physical activity in young people conducted in the hours immediately after school: a systematic review. Int J Behav Med. 2011;18:176–87.
18. Dzewaltowski DA, Rosenkranz RR, Geller KS, Coleman KJ, Welk GJ, Hastmann TJ, et al. HOP'N after-school project: an obesity prevention randomized controlled trial. Int J Behav Nutr Phys Act. 2010;7:90.
19. Madsen K, Thompson H, Adkins A, Crawford Y. School-community partnerships: a cluster-randomized trial of an after-school soccer program. JAMA Pediatrics. 2013;167(4):321–6.
20. Jago R, Sebire SJ, Cooper AR, Haase AM, Powell J, Davis L, et al. Bristol girls dance project feasibility trial: outcome and process evaluation results. Int J Behav Nutr Phys Act. 2012;9:83.
21. Jago R, Sebire SJ, Davies B, Wood L, Edwards MJ, Banfield K, et al. Randomised feasibility trial of a teaching assistant led extracurricular physical activity intervention for 9 to 11 year olds: Action 3:30. Int J Behav Nutr Phys Act. 2014;11:114.
22. O'Donovan TM, Kay TA. Focus on girls in sport. Brit J Teaching Phys Educ. 2005;36(1):29–31.
23. Connolly K, Quin E, Redding E. Dance 4 your life: exploring the health and well-being implications of a contemporary dance intervention for female adolescents. Res Dance Educ. 2011;12(1):53–66.
24. Burgess G, Grogan S, Burwitz L. Effects of a 6-week aerobic dance intervention on body image and physical self-perceptions in adolescent girls. Body Image. 2006;3(1):57–66.
25. Zander L, Kreutzmann M, West SG, Mettke E, Hannover B. How school-based dancing classes change affective and collaborative networks of adolescents. Psychol Sport Exerc. 2014;15(4):418–28.
26. O'Neill JR, Pate RR, Hooker SP. The contribution of dance to daily physical activity among adolescent girls. Int J Behav Nutr Phys Act. 2011;8:87. 27. Grieser M, Vu MB, Bedimo-Rung AL, Neumark-Sztainer D, Moody J, Young DR,
et al. Physical activity attitudes, preferences, and practices in African American, Hispanic, and Caucasian girls. Health Educ Behav. 2006;33(1):40–51. 28. Arts Council for England, Department for Culture MaS, NHS: Dance and
health: The benefits for people of all ages. Arts Council for England; London 2006.
29. Jago R, Davis L, McNeill J, Sebire SJ, Haase A, Powell J, et al. Adolescent girls' and parents' views on recruiting and retaining girls into an after-school dance intervention: Implications for extra-curricular physical activity provision. Int J Behav Nutr Phys Act. 2011;8(1):91.
30. Baranowski T, Jago R. Understanding mechanisms of change in children's physical activity programs. Exerc Sport Sci Rev. 2005;33(4):163–8. 31. Baranowski T, Anderson C, Carmack C. Mediating variable framework in
physical activity interventions. How are we doing? How might we do better? Am J Prev Med. 1998;15(4):266–97.
32. Deci EL, Ryan RM. The "what" and "why" of goal pursuits: Human needs and the self-determination of behavior. Psychol Inq. 2000;11:227–68.
33. Sebire SJ, Jago R, Fox KR, Edwards MJ, Thompson JL. Testing a self-determination theory model of children's physical activity motivation: a cross-sectional study. Int J Behav Nutr Phys Act. 2013;10:111.
34. Kelly M, McDaid D, Ludbrook A, Powell J. Economic appraisal of public health interventions: Evidence Briefing. London: Health Development Agency; 2005.
35. Jago R, Edwards MJ, Sebire SJ, Cooper AR, Powell JE, Bird EL, et al. Bristol girls dance project (BGDP): protocol for a cluster randomised controlled trial of an after-school dance programme to increase physical activity among 11–12 year old girls. BMC Public Health. 2013;13(1):1003.
36. Pupil premium funding tables 2012 to 2013 [https://www.gov.uk/ government/publications/pupil-premium-funding-tables-to-2013 2012-to-2013]
37. Hoffmann TC, Glasziou PP, Boutron I, Milne R, Perera R, Moher D, et al. Better reporting of interventions: template for intervention description and replication (TIDieR) checklist and guide. Bmj-Brit Med J. 2014;348:g1687. 38. Evenson KR, Catellier DJ, Gill K, Ondrak KS, McMurray RG. Calibration of two
objective measures of physical activity for children. J Sports Sci. 2008;26(14):1557–65.
39. Markland D, Tobin V. A modification of the behavioral regulation in exercise questionnaire to include an assessment of amotivation. J Sport Exerc Psychol. 2004;26:191–6.
40. McAuley E, Duncan T, Tammen VV. Psychometric properties of the intrinsic motivation inventory in a competitive sport setting: a confirmatory factor analysis. Res Q Exerc Sport. 1989;60(1):48–58.
41. Standage M, Duda JL, Ntoumanis N. A test of self-determination theory in school physical education. Br J Educ Psychol. 2005;75(Pt 3):411–33.
42. Marsh HW. Self Description Questionnaire (SDQ) II: A theoretical and empirical basis for the measurement of multiple dimensions of adolescent self-concept. In: Sydney UW, editor. A Test Manual and Research Monograph. New South Wales: University of Western Sydney, Faculty of Education; 1992.
43. Wille N, Badia X, Bonsel G, Burstrom K, Cavrini G, Devlin N, et al. Development of the EQ-5D-Y: a child-friendly version of the EQ-5D. Qual Life Res. 2010;19(6):875–86.
44. Cole TJ, Freeman JV, Preece MA. Body mass index reference curves for the UK, 1990. Arch Dis Child. 1995;73(1):25–9.
45. Husereau D, Drummond M, Petrou S, Carswell C, Moher D, Greenberg D, et al. Consolidated Health Economic Evaluation Reporting Standards (CHEERS) statement. Brit Med J. 2013;346:f1049.
46. Powell JE, Carroll FE, Sebire SJ, Haase AM, Jago R. Bristol girls dance project feasibility study: using a pilot economic evaluation to inform design of a full trial. BMJ Open. 2013;3(12), e003726.
47. Compernolle S, De Cocker K, Lakerveld J, Mackenbach JD, Nijpels G, Oppert JM, et al. A RE-AIM evaluation of evidence-based multi-level interventions to improve obesity-related behaviours in adults: a systematic review (the SPOTLIGHT project). Int J Behav Nutr Phy. 2014;11:147.
48. Ekelund U, Luan J, Sherar LB, Esliger DW, Griew P, Cooper A, et al. Moderate to vigorous physical activity and sedentary time and cardiometabolic risk factors in children and adolescents. JAMA. 2012;307(7):704–12. 49. Dunn G, Maracy M, Tomenson B. Estimating treatment effects from
randomized clinical trials with noncompliance and loss to follow-up: the role of instrumental variable methods. Stat Methods Med Res. 2005;14(4):369–95.
50. Carpenter JR, Kenward MG. Missing data in randomised controlled trials - a practical guide. Medical Statistics Unit, London School of Hygiene & Tropical Medicine: London School of Hygiene & Tropical Medicine; 2007.
51. Fichman M, Cummings JM. Multiple imputation for missing data: making the most of what you know. Organ Res Methods. 2003;6(3):282–308. 52. Kind P, Hardman G, Macran S. UK Population Norms for EQ-5D. York: The
Publications Office; 1999.
53. National Institute for Health and Clinical Excellence. Promoting physical activity, active play and sport for pre-school and school-age children and young people in family, pre-school, school and community settings. London: NICE; 2009.
54. Cain KL, Gavand KA, Conway TL, Peck E, Bracy NL, Bonilla E, et al. Physical activity in youth dance classes. Pediatrics. 2015;135(6):1066–73. 55. Beets MW, Weaver RG, Moore JB, Turner-McGrievy G, Pate RR, Webster C,
et al. From policy to practice: strategies to meet physical activity standards in YMCA afterschool programs. Am J Prev Med. 2014;46(3):281–8. 56. Weaver RG, Beets MW, Beighle A, Webster C, Huberty J, Moore JB:
Healthy Eating and Physical Activity. Health promotion practice 2015 doi: 10.1177/1524839915589732
57. Weaver RG, Beets MW, Huberty J, Freedman D, Turner-Mcgrievy G, Ward D. Physical activity opportunities in afterschool programs. Health Promot Pract. 2015;16(3):371–82.
58. Davies BR, Wood L, Banfield K, Edwards MJ, Jago R. The Provision of Active After-School Clubs for Children in English Primary Schools: Implications for Increasing Children’s Physical Activity. Open J Prev Med. 2014;4:598–605.
59. O'Neill JR, Pate RR, Liese AD. Descriptive epidemiology of dance participation in adolescents. Res Q Exerc Sport. 2011;82(3):373–80. 60. Duberg A, Hagberg L, Sunvisson H, Moller M. Influencing self-rated health
among adolescent girls with dance intervention: a randomized controlled trial. JAMA Pediatr. 2013;167(1):27–31.
61. Craig P, Dieppe P, Macintyre S, Michie S, Nazareth I, Petticrew M. Developing and evaluating complex interventions: the new Medical Research Council guidance. BMJ. 2008;337:a1655.
62. Southward EF, Page AS, Wheeler BW, Cooper AR. Contribution of the school journey to daily physical activity in children aged 11–12 years. Am J Prev Med. 2012;43(2):201–4.
Submit your next manuscript to BioMed Central and take full advantage of:
• Convenient online submission
• Thorough peer review
• No space constraints or color figure charges
• Immediate publication on acceptance
• Inclusion in PubMed, CAS, Scopus and Google Scholar
• Research which is freely available for redistribution