The expression of Toll-Like Receptors
in
B-Chronic Lymphocytic Leukaemia
Nigel James Oakes
A thesis submitted in partial fulfilment of the requirements of the University of the West of England for the degree of Doctor of Biomedical Sciences
Research carried out in collaboration with the Royal Cornwall Hospital Trust, Cornwall, UK
Faculty of Health and Life Sciences,
University of the West of England, Bristol
ABSTRACT
Chronic Lymphocytic Leukaemia (CLL) is the most common form of Leukaemia in the Western world and has a highly variable clinical course. Continuing advances in the range of therapeutic options available to clinicians require reliable prognostic indicators that can be used to group patients accurately according to their risk of disease progression, thereby allowing meaningful comparisons of treatments.
The expression of Toll-Like Receptors (TLR) on cells involved with the disease process in CLL was studied to establish links between levels of expression and the disease process. The expression levels of 5 different TLR were measured on a variety of haemic cells and compared with the TLR expression levels seen on their normal counterparts.
Flow cytometric analysis was used to establish the expression levels of TLR 1,2,3,4, and 9 on peripheral blood Monocytes, T Lymphocytes and B Lymphocytes from 129 patients. These results were compared with the TLR expression on corresponding cells from an equal number of age and sex matched controls. Further studies were performed which established the detrimental effect that storage of samples has on TLR expression, and also to compare TLR expression in patients who exhibited a positive Direct Antiglobulin Test (DAGT), with those that were negative for the DAGT.
with lymphocytes from age and sex matched controls. TLR expression levels on monocytes were similar in both patient and control groups. When comparing TLR expression between patients who were DAGT positive and those that were negative, a statistically significant difference was found in TLR9 expression on T lymphocytes.
These findings have established that that there are statistically significant differences in TLR expression on lymphocytes when comparing CLL patients with age and sex matched controls. It also establishes the differences in TLR expression levels seen in DAGT positive and DAGT negative patients. From findings made during this study, it is hypothesised that there may be a link between differential TLR expression and the autoimmune disease frequently reported in CLL.
Contents
Page
1. Background
1
1.1
Leukaemia
1
1.2
Chronic Lymphocytic Leukaemia 3
1.2.1
Aetiology of CLL
3
1.2.2
Clinical course
5
1.2.3
Laboratory diagnosis of CLL
5
1.2.4
Genetic changes
8
1.2.5
Biology of CLL
9
1.2.6
B cell development
9
1.2.7
Origins of the CLL cell
13
1.2.8
Morphology of CLL cells
17
1.2.9
Immunophenotype
17
1.3
Disease classification
19
1.3.1
Classification of disease and prognosis
19
1.3.2
Newer prognostic factors
23
1.4
Toll like receptors
25
1.4.1
TLR function
27
1.4.2 Toll like receptors and CLL
31
2. Materials
35
3. Methods
37
3.1 Sample analysis
37
3.1.1 Full blood count
37
3.1.2 Immunophenotyping
38
3.1.3 Toll Like Receptor analysis
41
3.1.4 Flow cytometry protocol (CLL phenotype)
42
3.1.5 Flow cytometry protocol (TLR phenotype)
43
3.1.6 TLR preparation protocols
45
3.1.7 Choice of flourochromes
49
3.2 Gating strategy
50
3.3 TLR expression data analysis
51
3.4 Preparation & analysis of time delay study samples
56
3.5 Direct agglutination test
56
3.6 Statistical analysis of TLR data
58
3.6.1 Student t test
58
3.6.2 Mann-Whitney U test
59
3.6.3 The
p
value
61
4. Technique development
62
4.1 Study design
62
4.3 Reagent and technique development
63
4.4 Time delayed analysis results
64
4.5 Summary of time delayed analysis results
65
4.6 Flow cytometry
66
4.7 Antibody titration
68
5 Results
71
5.1 CLL diagnosis
71
5.2 TLR expression
75
5.2.1 TLR expression results figures
75
5.2.2 Visual analysis of results charts
79
5.2.3 SPSS statistical analysis of TLR expression
80
5.2.4 Summary of results of t-test statistical analysis
80
5.2.5 Summary of results of U test statistical analysis
81
5.2.6 Summary of results of statistical analysis
82
5.2.7 Summary of B cell TLR expression
82
5.2.8 Summary of T cell TLR expression
83
5.2.9 Summary of Monocyte TLR expression
83
5.3 TLR expression vs. other parameters
83
5.3.1 Summary of TLR expression vs. other parameters 86
5.4 Direct Antiglobulin Test results
87
5.4.2 Summary of statistical analysis of DAG results
93
6 Discussion
94
6.1 Patient demographics
94
6.2 Role of T cells in B CLL
95
6.2.1
CD4 and CD8 subpopulations and total T cell numbers
97
6.2.2 T cell response to mitogen
97
6.2.3 T cell colony formation
98
6.2.4 T cell cytokine secretion
99
6.2.5 T cell surface antigen expression
99
6.2.6 Summary of role of T cell in B CLL
100
6.3 Role of TLR in T cells
103
6.4 Role of B cells in CLL
106
6.5 Role of TLR in B cells
108
6.6 Autoimmunity in CLL
112
6.6.1 T cell induced autoimmunity
113
6.7 Role of B cells in autoimmunity
114
6.8 Non-haematological autoimmunity
116
6.9 Role of TLR in autoimmunity
117
6.10 TLR 9 expression and autoimmunity
119
6.11 The role of TLR in CLL
121
7 Future developments
125
8 References
127
List of tables and illustrations Page no.
Table 1: Leukaemia classification and cellular origin 2 Table 2: Bone marrow infiltration patterns identified in CLL patients 7 with relative proportions of patients with corresponding
degree of infiltration at diagnosis
Table 3: The similarities and differences between CD5+ CLL B cells 15 and the normal subset of B cells that naturally express CD5
Table 4: Key features of B cell antigens and differential expression on 18 CLL B cells
Table 5: The Rai-Binet staging system showing the clinical stage of 20 CLL and classification of symptoms at each stage as defined
by Rai
Table 6: The modified Binet staging system showing clinical stage of 21 CLL and classification of symptoms at each stage as defined
by Binet
Table 7: The scoring system for CLL 23
Table 8: Human TLR distribution, specificity and function 29 Table 9: Summary of key patient demographic data 36 Table 10:Diagnostic monoclonal antibody panel used to confirm 39 diagnosis of CLL and construct CLL score
Table 11: Distribution of CLL scores amongst patient group in this study 41
Table 12: Diagnostic flow cytometry panel 42
Table 13: TLR flow cytometry panel 48
Table 14: Statistical descriptives table for TLR expression in patient and control 79 groups
Table 15: Summary of results of statistical analysis using t-testing 81 Table 16: Summary of results of statistical analysis using Mann- 81 Whitney U testing
Figure 1: Rowmanowsky stained peripheral blood film showing smear cells 6
Figure 2: B cell development 13
Figure 3: TLR structure 27
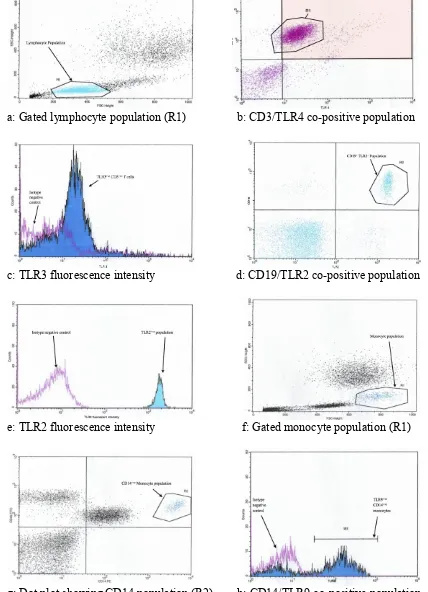
Figure 4: Cell population discrimination using physical parameters 50 Figure 5: Representative dot plots, histograms and gating strategies 55 used to identify target population for TLR quantification
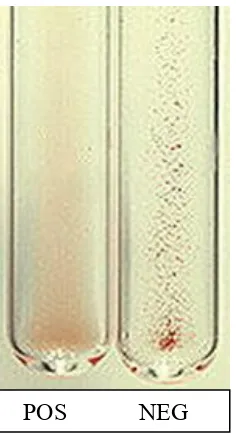
Figure 6: Positive and negative agglutination in DAG test 57 Figure 7: Normal parametric distribution of TLR 2 expression 59 on B cells in control samples vs. non-parametric distribution
of TLR 3 on B cells in control samples
Figure 8: Effect of storage on B cell TLR 1 expression 65
Figure 9: Histograms to demonstrate effect of serial dilution of 70 antibody used to obtain optimal staining of target antigen
Figure 10: Representative flow cytometry data showing typical CLL 72 phenotype
Figure 11: Representative flow cytometry data showing atypical CLL 73 phenotype
Figure 12: Representative flow cytometry data showing non- CLL 74 phenotype
Figure 13: TLR expression on B cells in patients and age/sex matched controls 76 Figure 14: TLR expression on T cells in patients and age/sex matched controls 76 Figure 15: TLR expression on monocytes in patients and age/sex matched 77
controls
Figure 20: TLR 2 expression on B cells vs. CD5/19 percentages 85
Figure 21: TLR 4 expression on T cells vs. CLL score 85
Figure 22: TLR 3 expression on T cells vs. absolute lymphocyte count 86
Figure 23: TLR 9 expression on monocytes vs. % lymphocyte count 76
Figure 24: Comparison of TLR expression on B cells between DAG 88
positive and DAG negative patients Figure 25: Comparison of TLR expression on Monocytes between DAG 89
positive and DAG negative patients Figure 26: Comparison of TLR expression on T cells between DAG 89
positive and DAG negative patients. Figure 27: Box and whisker plot showing comparison of TLR expression 90
on B cells between DAG positive & DAG negative patients Figure 28: Box and whisker plot showing comparison of TLR expression 90
Acknowledgements
I am grateful for the advice and unstinting support and encouragement from my academic supervisors Dr Victoria Davenport and Dr Ruth Morse, of the Faculty of Health and Life Sciences, University of the West of England, Bristol and my local supervisors Dr Sophie Mepham and Dr Anton Kruger of the department of
Haematology at the Royal Cornwall Hospital, Truro.
Further thanks are due to my colleagues at the Royal Cornwall Hospital, especially Mr Carl Sidebottom for his patient support, friendship and technical assistance, also to Ms Joanne Palmer for her invaluable help with data analysis and statistics.
Furthermore I would like to thank the Cornwall Leukaemia Trust and the Yorkshire Building Society, through their Community Investment Fund, for providing the funding for this project.
Most of all I would like to thank my family for their patience and support; in particular my daughter, Charlotte, for being my inspiration, and my darling wife, Tara, who is quite simply the love of my life.
Dedication
This thesis is dedicated to the memory of my father, Major the Reverend Dennis Oakes, a soldier of Christ.
Page | 1
1 Background
Page | 2
1.1 Leukaemia
Leukaemia is a disease that results from the neoplastic proliferation of haemopoietic myeloid or lymphoid cells. It arises from a mutation in a single stem cell, the progeny of which form a clone of leukaemic cells. Leukaemias are broadly divided into i) acute leukaemias, which, if untreated lead to death in weeks or months and ii) chronic leukaemias, which, if untreated, lead to death in months or years. They are further subdivided into lymphoid, myeloid and biphenotypic leukaemias, the latter showing both lymphoid and myeloid differentiation (Bain 2010). Leukaemias are classified according to World Health Organisation (WHO) schemes laid down in the WHO classification of Tumours of Haematopoietic and Lymphoid tissues guide (Swerdlow
et al. 2008). A simplified table of this classification system, showing the cellular origins of leukaemic cells is shown in table 1.
Type of Leukaemia Cellular origin
Common acute lymphoblastic leukaemia
(c-ALL) Lymphoid progenitor cell
Pre-B acute lymphoblastic leukaemia
(pre B-ALL) Pre-B cell
B-cell acute lymphoblastic leukaemia (B-ALL)
B cell Acute myeloid leukaemia
(AML)
Myeloid precursor cell Chronic lymphocytic leukaemia
(CLL)
Mantle cell/follicular/mature B cell Chronic myeloid leukaemia
(CML)
Myeloid progenitor cell Multiple myeloma
(MM) Plasma cell
Hairy cell leukaemia
(HCL) Mature B cell
Table1: Leukaemia classification and cellular origin (Taken from Bain 2010)
Page | 3
expansion of the clone where immature cells predominate. Chronic leukaemias by comparison are characterised by an expanding pool of proliferating cells that retain their capacity to differentiate to maturity (Greaves 1997; Bain 2010).
1.2 Chronic Lymphocytic Leukaemia (CLL)
CLL has been recognised as a distinct clinical entity for over 100 years. Originally identified by Turk in 1903, a fuller clinical description did not appear for some years after when it was cited as being an accumulative disease of immunologically
incompetent lymphocytes (Dameshek 1967). Disease classification systems did not however begin to systematically distinguish between different forms of leukaemia until the late 1960’s (Linet et al. 2007).
1.2.1 Aetiology of CLL
CLL is the most common form of leukaemia worldwide (Parker and Strout 2011). The incidence is 4.2 per 100,000 per year, with this incidence increasing to >30 per
100,000 at an age >80 years, with 2,750 new diagnoses per year in the United
Kingdom (Eichhorst et al. 2011). The disease has a male to female ratio of 2:1 and is primarily a disease of the elderly, with a median age at presentation of 72 years; approximately 11% of patients are less than 55 years old at diagnosis (Howlader et al.
Page | 4
and Africa, whist those of Jewish origin show a two-fold greater risk of developing the disease over those from other western countries (Caligaris-Cappio and Hamblin 1999; Landgren and Kyle 2007).
There is much speculation as to a link between certain occupations and the risk of developing CLL, in particular exposure to ionising radiation has long been thought to have no link to disease development (UNSCEAR 2008), but more recent studies have challenged this position (Rericha et al. 2006; Silver et al. 2007; Schubauer-Berigan et al. 2007). For reasons that remain unclear, an increased incidence of CLL is seen in farmers, rubber manufacturing workers and individuals working with asbestos (Linet
et al. 2007). CLL has also been linked to occupational exposure to a number of chemical agents such as butadiene (Graff et al. 2005), carbon tetrachloride and chlorinated hydrocarbons (Seidler et al. 2007) and occupations where contact with such chemical is commonplace, such as drycleaners (Ji and Hemminki 2006), cleaners/janitors (Blair et al. 2000) and woodworkers (Flodin et al. 1988). Some studies have shown an association between tobacco smoking and CLL (Brown et al.
1990), although this is disputed by other workers who report no overall increase in risk for cigarette smoking and CLL (Morton et al. 2005).
Page | 5
1.2.2 Clinical course
CLL follows an extremely variable clinical course with overall survival times ranging from months to decades (Abbot 2006). At least 20% of patients have either no or minimal signs and symptoms during their entire clinical course and have a survival similar to age-matched controls (Byrd, Stilgenbauer and Flinn 2004). Other patients show rapidly deteriorating blood cell counts and organomegaly and as such suffer from symptoms either at, or soon after diagnosis. The most common symptoms at diagnosis include anaemia, lymphadenopathy, hepatomegaly, splenomegaly and thrombocytopenia (Montserrat et al. 2006). Early stage CLL is generally not treated, as initiation of therapy for early stage patients has not been shown to prolong survival (Dighiero, Maloum and Bichoffe 1998; Parker and Strout 2011), whilst late stage disease is treated with chemotherapy and the use of pharmacologically active agents attached to monoclonal antibodies. Patients with slowly progressing disease may require no treatment during the course of their lives (Chiorazzi, Rai and Ferrarini 2005). More recently however highly effective and potentially curative approaches, such as allogeneic stem cell transplantation have been developed. The therapeutic options available to clinicians vary markedly with regard to efficacy, toxicity and cost and risk stratified algorithms of therapy are becoming increasingly necessary (Byrd, Stilgenbauer and Flinn 2004; Oscier et al. 2012).
1.2.3 Laboratory diagnosis of CLL
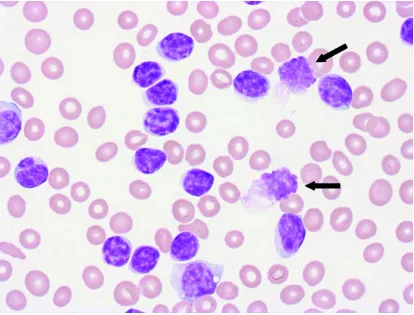
Most patients are diagnosed with CLL as an incidental finding following a routine full blood count that returns an elevated white cell count and/or a persistent
Page | 6
[image:19.595.91.505.181.496.2]clonal B cells that have altered morphology as a consequence of cellular fragility. Immunophenotyping of the mononuclear cell population will reveal a characteristic phenotype and can yield useful information for prognosis and on which to base treatment options (Bain 2010).
Figure 1: Rowmanowsky stained Peripheral blood film magnified x600 showing characteristic ‘smear’ cells (arrowed).
WHO classification state that a formal diagnosis of CLL is reached based on the combination of lymphocyte morphology, the presence of >5 x10⁹/l circulating clonal B cells persisting for >3 months and a characteristic immunophenotype as described below (Swerdlow et al. 2008, Bene et al. 2011; Oscier et al. 2012):
i) Surface immunoglobulin expression of low intensity IgM or IgM/IgD, with either Kappa or Lambda light chain restriction.
Page | 7
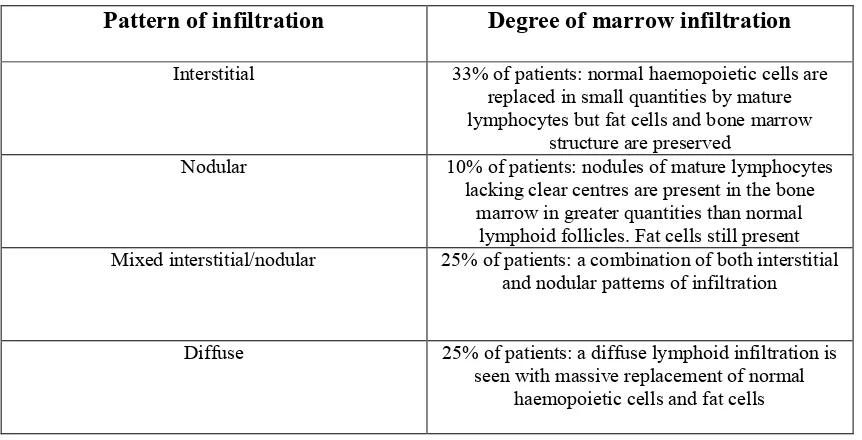
Depending on stage of disease at diagnosis the patient may at this point undergo bone marrow biopsy and cytogenetic testing. Bone marrow biopsy sampling is infrequently performed and although not required by British Committee for Standadisation in Haematology guidelines, some workers maintain that since it allows for the degree of marrow infiltration by the malignant clone to be assessed, it can be of use as an indicator of survival and disease prognosis (Cheson et al. 1996). Whilst bone marrow biopsy is not essential for the diagnosis of CLL it is sometimes used to define
complete response and is also indicated in determining the cause of cytopenias pre-treatment (Oscier et al. 2012). The four patterns of marrow infiltration found in CLL are summarised in table 2:
Pattern of infiltration Degree of marrow infiltration
Interstitial 33% of patients: normal haemopoietic cells are replaced in small quantities by mature lymphocytes but fat cells and bone marrow
structure are preserved
Nodular 10% of patients: nodules of mature lymphocytes lacking clear centres are present in the bone
marrow in greater quantities than normal lymphoid follicles. Fat cells still present Mixed interstitial/nodular 25% of patients: a combination of both interstitial
and nodular patterns of infiltration
Diffuse 25% of patients: a diffuse lymphoid infiltration is seen with massive replacement of normal
[image:20.595.84.515.428.648.2]haemopoietic cells and fat cells
Page | 8
1.2.4 Genetic changes
Clonal chromosomal changes are detected in up to 80% of patients with CLL (Dierlamm et al. 1997; Parker and Strout 2011), the most common being an
interstitial deletion in 13q14, which is seen in approximately 50% of cases, followed by del 11q22 (20%), trisomy 12 (15%), del 6q21 (10%) and del 17p13 (5-10%) (Stilenbauer et al. 1993: Nguyen-Khan 2010). Despite extensive work over the past few years the relationship between many of these aberrations and disease activity is incompletely understood. The observation that the most common (13q14)
chromosome abnormality observed in CLL is associated with a favourable prognosis, whilst the less common abnormalities result in adverse clinical outcomes, is similarly poorly understood (Dohner et al. 2000; Parker and Strout 2011).
Mutations in the gene controlling the production of the variable region of the immunoglobulin heavy chain (VH) are of particular interest as up to 50% of CLL
patients display (VH) gene mutations. In normal B cell development the variable
regions of both immunoglobulin heavy and light chains undergo somatic
hypermutation as they pass through germinal centres. Studies on the (VH) genes in
CLL suggest that patients with unmutated (VH) genes tend to have advanced stage
disease and an unfavourable prognosis. Since the assessment of (VH) mutation status
Page | 9
1.2.5 Biology of CLL
The CLL B cell clone is an accumulation of mature long-lived B cells, which express a variety of surface markers which distinguish them from normal B cells (Caligaris-Cappio and Hamblin 1996, Nordgren and Joshi 2010). It is thought likely that these cells have arisen from one progenitor cell, as indicated by the presence of identical key markers, but uncertainty remains as to the genetic origin of the clone. Whilst many clonal cells express genetic abnormalities, phenotypically identical leukaemic cells are found with different genotypes in the same patient (Jurlander 1998; Nordgren and Joshi 2010). These genetic abnormalities may be pathogenic or purely secondary phenomena. Of equal importance to disease development is the potential loss of homeostasis in B cell ontogeny which may not be related to specific genetic abnormalities. It is therefore important to have an appreciation of normal B cell development in order to understand the possible ways in which malignancy may arise.
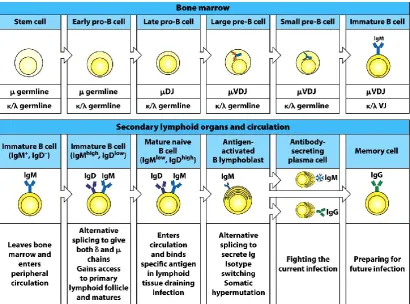
1.2.6 B cell development
B cell development begins when lymphoid stem cells in the bone marrow differentiate into the earliest distinctive B-Cell lineage, the progenitor B cell (pro B cell). Each stage in the development of B cells is accompanied, and often defined by,
rearrangements of the B cell immunoglobulin (Ig) genes and is under the tight control of cytokines and the developmental microenvironment.
Pro B cells
Page | 10
and recombinant activating genes 1 and 2 (RAG-1 and RAG-2) (Oettenger et al.
1990; Nordgren and Joshi 2010). Both RAG-1 and RAG-2 play an important role in immunoglobulin gene rearrangement as they have the ability to recognise and cleave DNA at specific sequences. Antibody diversity is further increased by the insertion of N regions, by TdT, at the point of joining between variable (V), diversity (D) and joining (J) segments (Spanopoulou et al. 1995, Montecino-Rodriguez and Dorshkind 2012). The first immunoglobulin rearrangements in the B cell take place in the heavy chain genes, once these have occurred the cell can be classified as a pre B cell; Pro B cells which fail to fail to make a functional VDJH rearrangement undergo apoptosis
(LeBien 2008).
The bone marrow stromal environment plays a critical role in the development of pro B cells to pre B cells (Ansel and Cyster 2001). Pro B cells are able to bind to stromal cells through very late antigen 4 (VLA-4), which binds with vascular cell adhesion molecule 1 (VCAM-1/CD106) on the stromal cell. This interaction promotes the binding of another receptor pair, c-Kit on the pro B cell with stem cell factor, which in turn triggers the expression of interleukin 7 (IL-7) receptors on the pro B cell surface. IL-7 released by the stromal cells binds to the IL-7 receptors (IL-7R), inducing the pro B cell to mature into a pre B cell. Experimental models with mice bred with disruptions in the genes controlling IL-7 production show severe impairment of B cell development (Van Freeden-Jeffry et al. 1995).
Pre B cells
Page | 11
stromal cells, drive the maturation process by inducing down-regulation of the adhesion marker VLA-4 (Cd49d/CD29) on the pre B cell surface. The pre B cell can now detach from the stromal cell as direct contact is no longer required for growth. However, IL-7 released from the stromal cells is still required for growth and maturation. Rearrangement of the light chain genes begins in the pre B cell once heavy chain rearrangements are complete (Levine et al. 2000). TdT is no longer expressed and as a result there is no insertion of N regions into light chain genes (Le Bien 2000). Rearrangement continues until a functional light chain (either kappa or lambda) is produced. Once produced, the light chain associates with the existing heavy chain unit and together they are transported to the cell surface and membrane bound immunoglobulin. Expression of RAG-1 and RAG-2 is downregulated and the cell therefore loses the capacity for further light chain rearrangement. Successful assembly of one heavy and one light chain prevents any further gene rearrangements. This process, termed allelic exclusion, gives rise to the phenomenon of clonal
restriction. Further division of the lymphocyte after this stage results in daughter cells which all express identical heavy and light chains, giving rise to a population of clonal B cells with specificity for a particular antigen.
Immature B lymphocytes
Page | 12
immunoglobulin production (Thompson 1998; LeBien and Tedder 2008). It has been estimated that of the 2 x10⁷ B cells that are developed each day, only 1-3% will enter the mature B cell pool. This fail safe mechanism is essential for the deletion of self reactive clones, which would otherwise recognise self proteins as foreign and increase the risk of autoimmune disease. Cells which remain following this checking phase will undergo further re-arrangement of heavy chain genes, which results in expression of IgD, at which point they are regarded as fully mature and enter the peripheral blood stream (Levine et al. 2000).
Mature B cells
Mature B cells express a number of surface antigens such as CD23, lymphocyte function associated antigen-1 (LFA-1) intracellular adhesion molecule-1 (ICAM-1/CD54) and major histocompatbility antigen complex II (MHC II) amongst others. Expression of these key surface antigens allows for interaction with antigen
Page | 13
Figure 2: B cell development From: Kuby Immunology, 7/e, by Judy Owen (Haverford College) , Jenni Punt (Haverford College) , Sharon Stranford (Mount Holyoke College), Copyright 2013 by W.H. Freeman and Company. Used by Permission of the publisher.
1.2.7 Origins of the CLL cell
CLL B cells have a number of features that are unique to the malignant cell and some which they share with normal B cells in the developmental pathway. CLL B cells have low or undetectable levels of surface immunoglobulin, which are polyreactive and show autoreactive antibody activity, often acting as a rheumatoid factor (RF), specifically recognising the Fc region of IgG class immunoglobulin (Parham 2000; Seifert et al. 2012).
Autoantibody activity may also be directed against haemopoietic antigens expressed on the surface of red blood cells and platelets, which can lead to autoimmune
Page | 14
CLL B cells accumulate in the peripheral blood and bone marrow in the G0 phase of
the cell cycle, these apparently resting cells express membrane makers of cellular activation, such as CD80 and CD86 which are normally expressed by activated normal B cells (Caligaris-Cappio el at 2001; Seifert et al. 2012). Under normal conditions CLL B cells appear to be anergic and have a reduced capacity to act as APC’s, whilst normal B cells are highly effective at this role (Caligaris-Cappio and Hamblin 1996). If, however, the CLL B cells are stimulated using monoclonal antibodies directed at activation ligands such as CD40, they can differentiate into effective APC’s, suggesting a restricted dialogue between CLL B and functional T cells during an normal immune response (Scrivener et al. 2003).
The cell surface marker CD5 is expressed on almost all malignant CLL B cells, but is also expressed on normal T cells and a subset of normal B cells (Lydyard et al. 1999, Nordgren and Joshi 2010). Normal B cells that express CD5 are termed B1 cells, and represent the most prominent B cells found in early foetal life, the numbers of these cells decreasing with age. In the adult, circulating B1 cells are normally found in the follicular mantle zone of the lymph nodes, but a limited number are also found in the bone marrow. Normal B1 cells produce polyreactive autoantibodies, including those directed against blood group antigens and are also the main source of IgM derived autoantibodies (Lydyard et al. 1999; Nordgreand Joshi 2010). Patients with Rheumatoid Arthritis have been found to have increased levels of B1 cells (Plater-Zyberk et al. 1985). It is unclear what controls the levels of normal B1 cells in the peripheral blood, but children with DiGeorge syndrome, i.e. those lacking a functional thymus, have decreased levels of B1 cells, suggesting a role for the thymus in
Page | 15
VH genes in CLL suggested that most malignant B cells had unmutated VH genes
(Kipps et al. 1989), later studies on larger groups of patients however reported that up to 50% of CLL patients VH genes were in fact mutated, indicating that they would
have passed through the germinal centre (Caligaris-Cappio 2001; Nordgren and Joshi 2010,). As the nature of the B cell has become clearer, attempts to identify its origin have combined the evidence outlined above. Initially, much work focused on the similarities between the CLL CD5+ B cell and the normal CD5+ B1 cell, these are summarised in table 3.
Feature CD5+ B cell CD5+ normal B1 cell
Polyreactive
autoantibodies Yes Yes
Somatic hypermutation Yes/No (50% of patients) No Formation of mouse
erythrocyte rosettes
Yes Yes
Bc1-2 expression Yes No
Low surface immunoglobulin
expression
Yes No
Table 3: The similarities and differences between CD5+ CLL B cells and the normal subset of B cells that naturally express CD5
Page | 16
cell is considered as a possible candidate for the origin of the CLL clone. Since normal CD5+ B1 cells are located in the mantle zone of the secondary lymphoid follicles, it is suggested that it is from here that CLL B cells may arise (Soderberg 1998). One possible theory suggests that CLL is a malignancy of a mantle based subpopulation of anergic self reactive CD5+ B cells devoted to the production of naturally occurring polyreactive autoantibody (Caligaris-Cappio 2001).
There are however striking differences between the 2 cell types. Whilst CLL B cells express low to undetectable levels of surface immunoglobulin, normal B1 cells express normal levels. CLL B lymphocytes appear to be stuck in the G0 phase of the
cell cycle and yet are able to express cell surface markers and cytokines that are indicative of an activated B cell. B1 cells do not follow this pattern. The B1 cell cycle correlates with expression of cell surface markers and there is no difference between their activated and resting states. Normal B1 cells express low levels of Bcl-2, whilst CLL B cells express high levels. Normal B1 cells do not demonstrate somatic
hypermutation, yet 50 % of CLL B cells do (Hamblin et al. 1999). Additionally, the production of autoantibodies in CLL is believed to result from the residual normal B cell population (Oscier 1999; Zent and Kay 2010).
Attempts to identify a normal cellular counterpart for the CLL B cell have so far failed. Such a counterpart would need to encompass all aspects of the disease, such as autoimmunity, hypogammaglobulinaemia, low surface immunoglobulin expression, CD5 expression and dysregulation of T cell function (Scrivener et al. 2003).
Page | 17
CLL B cells appear as small, mature, unstimulated peripheral blood lymphocytes, which are easily damaged on preparation of a blood film, giving rise to the
characteristic ‘smear’ or ‘smudge’ cell frequently observed during morphological examination (Hamblin et al. 1999). On examination of peripheral blood films, the malignant cells can be distinguished by their heavily clumped basophilic chromatin within the nucleus and the presence of a small agranular pale blue cytoplasm (Dierlamm et al. 1997). Approximately 15% of patients have larger B cells with a more prominent nucleolus, cleaved nucleus or lymphoplasmaytoid features. Examination of peripheral blood and bone marrow aspirate from the same CLL patient identifies an identical infiltrating population from both sources (Oscier 1999).
1.2.9 Immunophenotype
Morphological examination by itself is insufficient to make a laboratory diagnosis of CLL, and the detection of cell surface marker antigens by flow cytometry is
considered essential (Bain 2010). One of the key distinguishing features of the CLL cell is low to undetectable levels of surface immunoglobulin ( Dohner and
Stilgenbauer 2001). In the majority of cases of CLL the surface immunoglobulin that is expressed is either class IgM, IgD or both. There is invariably restricted expression of either Kappa or Lambda light chains, this being indicative of the clonal nature of the malignant cell population (Jurlander 1998). CLL B cells have been shown to express the interaction and activation markers CD80 and CD86 (Caligaris-Cappio 2001). Expression of the B cell receptor (BCR) is altered in CLL patients. The BCR consists of surface immunoglobulin, non-covalently linked with CD79, CD79b and CD5. In most cases of CLL the extracellular domain CD79b is absent (Alfarano et al.
Page | 18
regardless of whether it is expressed at the cell surface or not (Rassenti and Kipps 2000). Normal B cells utilise CD7b expression, post activation, to downregulate BCR expression, suggesting that CLL B cells may be activated in some way (Scrivener at al 2002). There is a characteristic expression of a number of surface markers in CLL which are summarised in table 4.
Marker Molecular
weight Normal expression Role Expression on CLL cells
CD5 67kDa T cells, B1 B cells BCR activation and differentiation
+
CD19 95kDa B cells T/B cell
interaction
+
CD20 33-37kDa B cells B cell
activation and signal transduction
+
CD21 145kDa Mature B and T cells (Low)
Immature T cells (high)
Antigen
presentation +
CD22 135kDa B cells Accessory
signalling through BCR
-
CD23 45kDa B cell,
macrophage/monocytes)
B cell activation
marker
+
CD79b 33-40kDa B cells Downregulation
of BCR
- CD80/CD86 60kDa/80kDa B cells, dendritic cells,
some T cells
T/B cell interaction
+ Surface
Immunoglobulin variable Highly B cells Antigen binding +/- Bcl-2 25kDa Apoptosis-protected
cells Protection against apoptosis
+
Table 4: Key features of B cell antigens and differential expression on CLL B cells
Page | 19
1.3.1 Classification of disease stage and prognosis
The aim of any pathological classification system is to group cases that have
fundamental similarities and are likely to have some common causational feature and pathogenesis. The French, American, British (FAB) classification of acute leukaemias was first published in 1976 in the hope of providing a universal system of
classification for leukaemias which would in turn improve the accuracy of diagnosis (Bennett et al. 1976). The classification was subsequently expanded, modified and clarified over the next 15 years (Bain 2010). The FAB group also published during this time a classification for chronic lymphoid leukaemias (Bennett et al. 1989).
The classification systems for haematological malignancies have changed dramatically over the years (Smith et al. 2011). The currently used system is the WHO Classification of Tumours of Haematopoietic and Lymphoid Tissues 4th edition (Swerdlow et al. 2008), which was established by the WHO in 2001 and was
modified in collaboration with the European Association for Haematopathology and the Society for Hematopathology in 2008 (Vardiman et al. 2009). The aim of this system is to separate and characterize leukaemias and lymphomas into clinically and biologically relevant entities, it also includes genetic, cytochemical,
immunophenotypic and clinical information which assist in the construction of diagnostic algorithms.
Page | 20
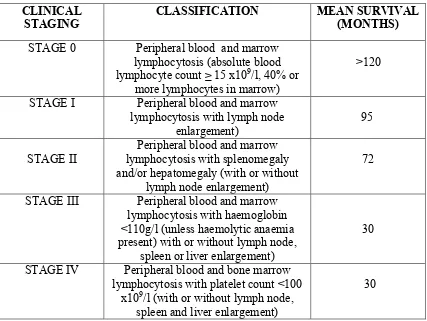
laboratory findings at the time of diagnosis, which segregates patients into five stages (0 – IV). The system is summarised in table 5.
CLINICAL STAGING
CLASSIFICATION MEAN SURVIVAL
(MONTHS)
STAGE 0 Peripheral blood and marrow lymphocytosis (absolute blood lymphocyte count ≥ 15 x109/l, 40% or
more lymphocytes in marrow)
>120
STAGE I Peripheral blood and marrow lymphocytosis with lymph node
enlargement)
95
STAGE II
Peripheral blood and marrow lymphocytosis with splenomegaly and/or hepatomegaly (with or without
lymph node enlargement)
72
STAGE III Peripheral blood and marrow lymphocytosis with haemoglobin <110g/l (unless haemolytic anaemia present) with or without lymph node,
spleen or liver enlargement)
30
STAGE IV Peripheral blood and bone marrow lymphocytosis with platelet count <100
x109/l (with or without lymph node, spleen and liver enlargement)
[image:33.595.85.512.124.445.2]30
Table 5: The Rai-Binet staging system showing the clinical stage of CLL and classification of symptoms at each stage as defined by Rai (Rai et al. 1975)
Page | 21
with those patients presenting with stage 0 – II disease living longer than those with stage III or IV disease (Rai et al. 1975).
A modified staging system was proposed by Binet in 1981 in which more emphasis is placed on isolating patients defined as ‘high risk’ by the presence of anaemia or thrombocytopenia. Binets system is summarised in table 4.
CLINCIAL STAGING CLASSIFICATION MEAN SURVIVAL
(MONTHS)
STAGE A Haemoglobin ≥100g/l. Platelets ≥ 100 x109/l
Less than 3 enlarged areas*
>120
STAGE B Haemoglobin ≥100g/l. Platelets ≥ 100 x109/l 3 or more enlarged areas*
61 STAGE C Haemoglobin < 100g/l
and/or platelets < 100 x109/l. Any number of
enlarged areas*
32
* incorporating cervical, axillary, inguinal lymph nodes, spleen and liver
Table 6 The modified Binet staging system showing clinical stage of CLL and classification of symptoms at each stage as defined by Binet (Binet et al. 1981)
It was postulated by Binet that it is possible to combine the two systems of
classification, Rai stages 0 – III being assigned to Binet stage A, Rai stage IV being grouped with Binet stage C and the remaining patients from Rai stage II being separated into stag A or B depending on physical signs and symptoms (Binet et al.
1981).
Page | 22
characterised by a lymphocyte count < 30 x109/l and a haemoglobin >120g/l.
Approximately 80% of stage A patients fall into this category. Stage A" is categorised by either a lymphocyte count of > 30 x109/l or a haemoglobin < 120g/l. The
remaining 20% of stage A patients falling into this category.
Page | 23
0 points 1 point
Membrane marker
Moderate/Strong Weak
Surface Immunoglobulin expression strength
Negative Positive
CD5 expression
Negative Positive
CD23 expression
Positive Negative
FMC7 expression
Moderate/Strong Weak/Negative
CD79b expression
[image:36.595.83.513.69.330.2]Score 4-5: Typical CLL Score 3-4: Atypical CLL Score <3: Non-CLL
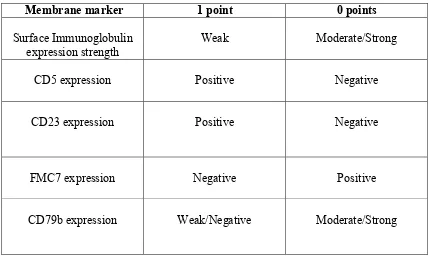
Table 7: The scoring system for CLL. Points are allocated to patients depending on presence or absence of surface antigens on malignant cell population. Total score aids in differentiation between typical CLL, atypical CLL and other forms of leukaemia (Matutes et al. 1994).
1.3.2 Newer prognostic factors
Although the use of these staging and scoring systems for the classification of CLL is now well established, they are not completely satisfactory and have been subject to regular modification (Chiorassi, Rai and Ferrarini 2005). Consideration of clinical and therapeutic factors, notably performance status and presence of adverse
prognostic factors, is assuming increasing importance in the development of staging systems (Auer, Gribben and Cotter 2007).
Page | 24
such as CD38 and the 70kDa Zeta associated protein (ZAP-70) (Razzenti, Lang-Huynh and Toy 2004, Razzenti et al. 2008; Parker and Strout 2011). This is important, as more than 80% of cases of CLL are diagnosed at early disease stage. These developments have however created uncertainty for clinicians who hope to incorporate the use of these markers into standard clinical practice (Binet, Caligaris-Cappio and Catovsky 2006). It is recognised that further research is needed to better understand if intrinsic differences in cell biology and analysis of the expression of molecular and cellular markers in CLL can be of prognostic use (Montserrat et al.
2006; Parker and Strout 2011).
There is also a need in the field of CLL treatment to identify factors that define outcome and refine disease categories (Caporaso et al. 2007). The Rai and Binet clinical staging systems are used to define disease extent and prognosis but new biological prognostic factors have become increasingly important, especially in early stage CLL. New prognostic factors continue to appear in the literature i.e. smudge cells, CAT scan abnormalities and new molecular and genetic markers (Nowakowski
et al. 2007; Halek 2008). Any new prognostic information that can be proven to be of worth will independently add information to the many other traditional factors that are documented to influence CLL prognosis such as morphology, cytogenetics, lymphocyte doubling time and serum markers of rapid cell turnover, including elevated thymidine kinase and β-2 microglobulin (Binet, Caligaris-Cappio and Catovsky 2006).
Page | 25
unchanged until death. A comparison between patients diagnosed with CLL in the period 1960 – 1979 against those diagnosed 1980 – 1989 shows significant differences. In the later cohort of patients, diagnosis was made at a later age, more patients were diagnosed in low risk groups and survival time was more than double (Rozman, Bosch and Montserrat 1997). As newer diagnostic tools have become available, their application has greatly influenced changes in both the accuracy and the speed of diagnosis. In particular the increased use of molecular techniques has introduced an opportunity to study the disease and its prognosis. It has been demonstrated that telomerase, an enzyme that mediates the repair and preservation of telomeres within chromosomes and thus prevent the ageing process normal in somatic cells, has significantly higher activity in B cells in CLL patients compared to normal controls. This enhances the ability of CLL cells to survive longer and continually repair DNA, not only by preventing the erosion of telomeres, but by actually restoring telomere length (Bechter et al. 1998). It is envisioned that the measurement of telomerase activity may in the future become and important variable in the new generation of prognostic factors, allowing for better and more accurate diagnosis and prognosis.
1.4 Toll Like Receptors
In the 1980’s researchers in Germany working on the development of the fruit fly
Drosophila found that the fly could not develop correct dorsal-ventral axis without the protein Toll, which is a trans-membrane signal receptor protein. The word Toll
Page | 26
hence these became known as ‘Toll like receptors’ (Werling and Jungi 2003, Zhang and Ghosh 2001).
Toll like receptors (TLR) are pattern recognition receptors that trigger innate immunity, signalling via TLR playing a critical role in defence against pathogens and innate activation of the adaptive immune response (Akira and Takeda 2004).
TLR are membrane spanning proteins that consist of an exterior region, a membrane spanning region and an interior domain. To date 13 TLR have been discovered in humans and functions determined for 11 of them (Lu 2010). The current information relating to TLR is summarised in table 8. Each TLR detects a distinct repertoire of highly conserved pathogen molecules; the complete set can detect a broad variety of viruses, bacteria, protozoa and fungi. The ligands that bind to TLR’s are invariably an indispensable component of the pathogen in question, thus pathogens do not have the option of mutating to forms that lack the essential building blocks recognised by TLR. When a pathogen activates a TLR by binding to the extracellular domain a signal transduction pathway is activated which results in the induction of an innate immune response. This response includes promotion of the expression of genes that contribute to inflammation, induction of changes to antigen presenting cells (APC) to make them more efficient at antigen presentation and it also causes the synthesis and export of extracellular signalling molecules that affect a variety of cells involved with the immune response such as leucocytes (Underhill 2003). Activated pathways involved in this response include the NF-κB pathway (IκBα phosphorylation, translocation of
NF-κB p65 to the nucleus), mitogen activated protein kinases p38, Jun-N-terminal
Page | 27
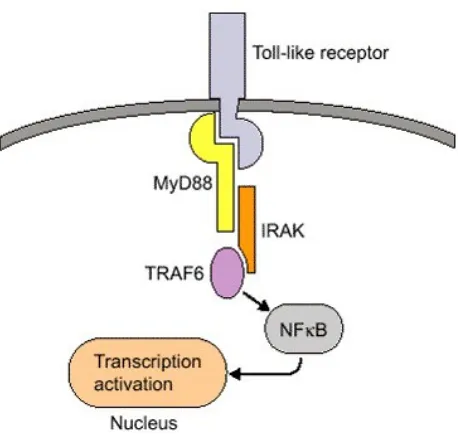
Figure 3: TLR structure showing signal transduction pathway From: Kuby Immunology, 7/e, by Judy Owen (Haverford College) , Jenni Punt (Haverford College) , Sharon Stranford (Mount Holyoke College), Copyright 2013 by W.H. Freeman and Company. Used by Permission of the publisher.
1.4.1 TLR function
The 13 different TLR currently identified in humans share similarities in their structure and function but respond differently to microbial components ((Kawai and Akira 2011)
Bacterial cell wall components are recognised by five TLR (1,2,4,5 and 6) and are termed extracellular TLR due to their expression on the cell surface and their extracellular domain, by contrast, TLR 3,7,8 and 9 are located in the cytoplasm and depend on the capacity of pathogens to penetrate the cell membrane . These internal TLR recognise both double and single stranded RNA, unmethylated DNA sequences and other motifs found predominantly in the bacterial genome. Together the
Page | 28
The TLR signalling pathway consists of a myeloid differentiation factor 88 (MyD88) dependant pathway which is common to all TLR and a MyD88 independent pathway selective to TLR 3 and 4.
Activation of MyD88 initiates a signalling cascade, which leads to the downstream activation of kinases and the translocation of the central transcription factors (NF)-kB and interferon regulatory factor (IRF)-3. Following this, MyD88 associates with Toll/interleukin (IL)-1 receptor (TIR) domain-containing adapter protein to form a complex that then recruits IL-1 receptor-associated kinase and subsequently tumor necrosis factor (TNF) receptor associated factor (TRAF)-6. This results in activation of the ikB kinase (IKK) complex.
In MyD88-independent signalling, the adaptor molecule TIR domain-containing adaptor-inducing interferon (TRIF) is recruited to the intracellular part of TLR3 directly or to TLR4 via TRIF-related adaptor molecule (TRAM), which consequently leads to activation of both tank-binding kinase 1 (TBK-1) and TRAF-6, this being a crucial checkpoint for the induction of a NF-kB controlled immune response or an IRF-3 controlled response with thyp 1 IFN activation pattern.
Activation of NF-kB is then one of the central signalling pathways after recognition of TLR ligands. This activation promotes phagocytosis of pathogens and
Page | 29
activation of TLR also enhances co-stimulatory expression of accessory molecules such as CD80 and CD86 which provides a second signal for a full immune response.
Receptor Ligand(s) Ligand
location
Location Cell types
TLR1 Lipopeptides, soluble factors
Bacteria, mycobacteria
Cell surface Monocytes, T & B lymphocytes, dendritic cells TLR2 Glycolipids,
lipoproteins, peptidoglycans
Gram positive bacteria, fungi
Cell surface Monocytes, T & B lymphocytes, dendritic cells,
mast cells TLR3 Double stranded
RNA Viruses compartment Cell B lymphocytes, monocytes, dendritic cells TLR4 Lipopolysacchride,
heat shock protein, fibrinogen
Gram negative bacteria
Cell surface Monocytes, T lymphocytes, dendritic cells,
mast cells, intestitial epithelium TLR5 Flagellin Bacteria Cell surface Monocytes,
dendritic cells, intestinal epithelium TLR6 Diacyl lipopeptides Gram positive
bacteria, fungi Cell surface Monocytes, mast cells TLR7 Single stranded
RNA Viruses, synthetic compounds Cell compartment Monocytes, dendritic cells, B
lymphocytes TLR8 Single stranded
RNA Viruses, synthetic compounds Cell compartment Monocytes, dendritic cells, B
lymphocytes TLR9 CpG-containing
DNA
Bacteria Cell compartment
Monocytes, dendritic cells, T&B lymphocytes TLR10 Not determined Unknown Cell Surface Monocytes, B cells TLR11 Profilin Uropathogenic
bacteria
Unknown Monocytes, liver/kidney cells, bladder epithelium TLR12 Not determined Unknown Unknown Unknown TLR13 Not determined Unknown Unknown
Page | 30
TLR control the activation of innate immunity through the induction of antimicrobial activity and the production of inflammatory cytokines (Yamamoto et al. 2002). They also control the generation of adaptive immunity through the induction of antigen-presenting (MHC class II) and co-stimulatory molecules such as CD80 and CD86 and specific cytokines such as Interleukin 6, on APC (Pasare and Medzhitov 2005). Gene targeting studies examining TLR and their cognate downstream signalling molecules provides evidence that the expression and activation of TLR in vivo contributes to host defence and the generation of specific antibodies following vaccination (Krutzik
et al. 2005).
Despite the advances in understanding of the role TLR plays in host defence and the specific signalling events initiated following TLR activation, factors that regulate TLR expression and function are poorly understood (Lancaster et al. 2005). However a number of specific molecules are known to be involved in the TLR signalling
pathway. These include adapter molecules such as MyD88, MyD88 adapter-like
(Mal), also known as Toll/IL-1R (TIR) domain-containing adaptor protein (TIRAP),
and TIR domain-containing adapter inducing interferon (TRIF), also known as
TICAM1. Other key signalling proteins include IL-1 receptor associated kinases
(IRAKs) such as IRAK1, 2, and 4, transforming growth factor kinase (TAK-1), IκB
kinases (IKKs), and TRAFs (TNF receptor associated factors) (Zhang et al. 2004).
Page | 31
TLR, a process which is dependant on the production of type 1 interferons (Miettinen 2001). Other studies have shown that differential TLR expression and activation is regulated by activation via type 1 and type 2 cytokines (Krutzik et al. 2005).
Three key discoveries have confirmed the central role that TLR perform in innate immunity. Firstly the observation that the mutations in Toll which play a role in fly development also make the fly highly susceptible to lethal pathogens. This discovery demonstrates the importance of pathogen triggered immune response in invertebrate organisms.
Secondly it was discovered that human proteins with cytoplasmic domain homology with Toll activated the expression of immune response genes when transfected into a human experimental cell line. This demonstrated conservation of an immune response pathway between invertebrates and humans. And thirdly, studies with mutant mice homozygous for the lps locus were resistant to lipopolysacchride (LPS) also known as endotoxin, which is found in the cell walls of gram negative bacteria. Mutant strains of mice were susceptible to septic shock from endotoxins released from gram negative bacteria, the mouse lps gene encodes for a TLR, thus providing unequivocal evidence that TLR’s play a central role in normal immunophysiology (Salaun, Romero and Lebecque 2007).
1.4.2 Toll like receptors and CLL
Page | 32
TLR signalling plays an important role in the biology of B cells. It is postulated that they may be involved in the regulation of the B cell differentiation process (Hayashi, Akira and Nobrega 2005). TLR stimulation is also required as signal for the activation of naïve B cells (Ruprecht and Lanzavecchia 2006). In naïve B cells, TLR are expressed at low levels, but the expression of some TLR is induced upon BCR triggering, the effect of which is that some memory B cells express TLR at high levels. It has been suggested that TLR expression by memory B cells is crucial for the maintenance of long lived memory B cells (Bernasconi, Traggiai and Lanzaveccia 2002). TLR have also been reported to induce BCR independent B cell activation, and increase the immunogenicity of B cells by upregulating costimulatory molecules (Mansson et al. 2006). A role has also been identified for TLR in T lymphocyte function in the T helper cell related control of inflammation (McGettrick and O’Neill 2007).
Page | 33
populations; studies have indicated that B CLL cells display similar patterns of TLR as normal B cells but with different levels of expression (Grandjenette et al. 2007). To date however, there has not been a concise study of TLR expression patterns comparing B CLL and normal B cells (Rožková et al. 2010).
1.5 Project aims and hypothesis
It has long been accepted that improved understanding of prognostic factors in CLL should accelerate the development of risk adapted treatment strategies that also take into account more traditional prognostic indicators (Montserrat 2002, Parker 2011). A major review of the aetiology of CLL in 2007 concluded that the timely assessment of new leads in the study of the disease was due (Linet et al. 2007).
Chronic lymphocytic leukaemia is frequently associated with immune disturbances ( Hodgson et al. 2011), the pathogenesis of the disease appearing to involve
dysfunctional regulation of humoral and cellular immunology with subsequent development of genetic aberrations (Dearden et al. 2008). Since TLR are thought to bridge these two elements of the immune system, the aim of the project was to collect data on the expression of TLR on a variety of cells in CLL patients and age/gender matched controls, in an attempt to establish links between TLR expression and autoimmune involvement.
The hypothesis of this study is that there is a link between TLR expression levels on lymphocytes & monocytes and the disease process in CLL. In particular it is
Page | 34
TLR function and as such there will be a differential expression of TLR between patient and age/sex matched controls.
Page | 35
2 Materials
All flow cytometric consumables including flow sample tubes, sheath reagent and wash/dilution fluids were obtained from Becton Dickinson (Oxford UK). Blood collection equipment, including needles and Vacutainer brand sample tubes were also obtained from BD.
All monoclonal antibodies used in the first line diagnostic CLL panel were obtained from Dako (Cambridge UK), as were the fixation and permeability solutions and the Isotype negative controls.
The anti-TLR monoclonal antibodies were sourced from the following companies: Anti-TLR 1, 3 and 4 from RandD systems (Minneapolis USA), Anti TLR 2 and 9 from Insight Biotechnology (Wembley UK).
Patient and control samples were obtained from blood samples collected at the Royal Cornwall Hospital Haematology (RCH) outpatients department. Between January 2007 and May 2010 a total of 129 patients (82 males, 47 females), age 50-94 years, (mean age 71.5 years) with newly diagnosed CLL presenting at the Haematology department of the RCH, were recruited for the study. None of the study group had any history of malignancy prior to presentation. An equal number of age and sex matched case controls, with no previous history or current evidence of haematological
Page | 36
were required to have normal blood film morphology and Immunophenotyping (i.e. a Matutes CLL score of 0).
Only patients with a confirmed diagnosis of B-CLL, determined by morphology and immunophenotype, and having a Matutes CLL score of 3-5 were included in the study. The data from those patients subsequently found to fall outside these diagnostic criteria were excluded from further analysis.
A summary of key demographic details are attached as appendix i and summarised in table 9.
Demographic factor Results from this study National average figures for CLL
Average age 71.5 (Range 50-94) 72
Male: female ratio 1.75:1 (82♂:47♀) 2:1
Patients <55 years old 6.2% 11%
Table 9: Summary of key patient demographic data (National average figures from Oscier et al 2012)
Page | 37
3 Methods
The methods used in the study are detailed below; these were adopted following an extensive developmental period, details of which are recorded in the method development chapter.
3.1 Sample analysis
Patients were routinely diagnosed with CLL by the Haematology laboratory at RCH using the series of diagnostic tests described below, a diagnosis of CLL being based on a combination of lymphocyte morphology, the presence of >5 x10⁹/l circulating clonal B cells and a characteristic immunophenotype (Eichhorst et al. 2011; Oscier et al. 2012)
3.1.1 Full blood count
A full blood count (FBC) was produced using the Advia 2010 automated blood count system (Bayer, New York, USA), which enumerates a number of parameters
Page | 38
suggesting the presence of a malignant haematological clone, the sample was referred for confirmatory testing by Immunophenotyping using multiparametric flow
cytometry.
3.1.2 Immunophenotyping
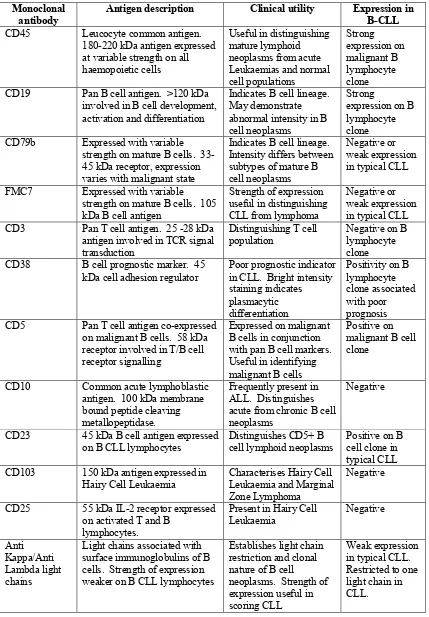
A panel of monoclonal antibodies (shown in table 10 below) was used on samples and the matched control to confirm a diagnosis of CLL and to provide information to generate a CLL score. The panel of antibodies was chosen to allow assessment of disease stage and included markers to allow exclusion of other lymphoid
Page | 39 Monoclonal
antibody Antigen description Clinical utility Expression in B-CLL
CD45 Leucocyte common antigen.
180-220 kDa antigen expressed at variable strength on all haemopoietic cells
Useful in distinguishing mature lymphoid neoplasms from acute Leukaemias and normal cell populations Strong expression on malignant B lymphocyte clone CD19 Pan B cell antigen. >120 kDa
involved in B cell development, activation and differentiation
Indicates B cell lineage. May demonstrate abnormal intensity in B cell neoplasms
Strong
expression on B lymphocyte clone
CD79b Expressed with variable
strength on mature B cells. 33-45 kDa receptor, expression varies with malignant state
Indicates B cell lineage. Intensity differs between subtypes of mature B cell neoplasms
Negative or weak expression in typical CLL
FMC7 Expressed with variable
strength on mature B cells. 105 kDa B cell antigen
Strength of expression useful in distinguishing CLL from lymphoma
Negative or weak expression in typical CLL
CD3 Pan T cell antigen. 25 -28 kDa
antigen involved in TCR signal transduction
Distinguishing T cell
population Negative on B lymphocyte clone
CD38 B cell prognostic marker. 45
kDa cell adhesion regulator Poor prognostic indicator in CLL. Bright intensity staining indicates plasmacytic differentiation
Positivity on B lymphocyte clone associated with poor prognosis
CD5 Pan T cell antigen co-expressed
on malignant B cells. 58 kDa receptor involved in T/B cell receptor signalling
Expressed on malignant B cells in conjunction with pan B cell markers. Useful in identifying malignant B cells
Positive on malignant B cell clone
CD10 Common acute lymphoblastic
antigen. 100 kDa membrane bound peptide cleaving metallopeptidase.
Frequently present in ALL. Distinguishes acute from chronic B cell neoplasms
Negative
CD23 45 kDa B cell antigen expressed
on B CLL lymphocytes Distinguishes CD5+ B cell lymphoid neoplasms Positive on B cell clone in typical CLL
CD103 150 kDa antigen expressed in
Hairy Cell Leukaemia Characterises Hairy Cell Leukaemia and Marginal Zone Lymphoma
Negative
CD25 55 kDa IL-2 receptor expressed
on activated T and B lymphocytes.
Present in Hairy Cell
Leukaemia Negative
Anti Kappa/Anti Lambda light chains
Light chains associated with surface immunoglobulins of B cells. Strength of expression weaker on B CLL lymphocytes
Establishes light chain restriction and clonal nature of B cell
neoplasms. Strength of expression useful in scoring CLL
[image:52.595.85.514.70.687.2]Weak expression in typical CLL. Restricted to one light chain in CLL.
Table 10: Diagnostic monoclonal antibody panel used to confirm diagnosis of CLL and construct
Page | 40
Following a diagnosis of CLL being made using the above criteria a number of additional investigations were routinely performed on each patient including bone marrow biopsy (where appropriate) to assess degree of infiltration, cytogenetic analysis to identify common risk factors and histology which is considered important to obtain a definitive diagnosis (Dronca et al. 2010). Bone marrow biopsy and histology were performed locally and analysed by the hospital histopathology
department and cytogenetic analysis was performed by a regional cytogenetics centre at Bristol. These investigations did not form part of the study and were performed as part of a standard diagnostic protocol. The results of these investigations were however used to confirm a diagnosis of CLL. Additionally a direct antiglobulin test (DAG) was performed as part of the study to assess autoimmune status, this test also being one of those recommended in diagnostic guidelines (Oscier et al. 2012). The DAG results were recorded and analysed as part of the study.
Using the results of tests detailed above, coupled with physical findings on
Page | 41
CLL score and no evidence of a CD5/CD19 co-positive B cell population were included in the study.
The distribution of CLL scores among the patient group are summarised below (full results attached as appendix i),
CLL Score Number of patients Classification
5 62 Typical CLL
4 59 Typical CLL
3 8 Atypical CLL
Table 11: Distribution of CLL scores amongst patient group in this study
3.1.3 Toll like receptor analysis
Page | 42
3.1.4 Flow cytometry protocol (CLL phenotype)
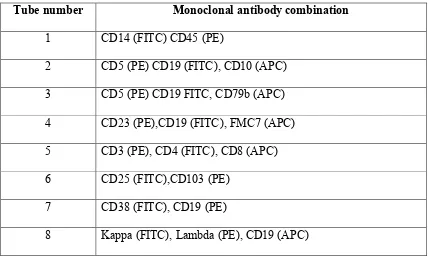
Samples of EDTA anticoagulated whole blood were manually aliquoted into 100 microlitre volumes and stained with a 10 microlitres mixture of appropriate directly conjugated monoclonal antibody (as detailed in table 12) and incubated for 15 minutes in the dark at room temperature. All monoclonal antibodies used in the diagnostic panel had previously been titred to find the optimal concentration for flow cytometric analysis and the volume adjusted to allow for a standard volume of 10 microlitres of each monoclonal antibody to be used in each test.
Tube number Monoclonal antibody combination
1 CD14 (FITC) CD45 (PE)
2 CD5 (PE) CD19 (FITC), CD10 (APC) 3 CD5 (PE) CD19 FITC, CD79b (APC) 4 CD23 (PE),CD19 (FITC), FMC7 (APC) 5 CD3 (PE), CD4 (FITC), CD8 (APC) 6 CD25 (FITC),CD103 (PE)
7 CD38 (FITC), CD19 (PE)
[image:55.595.84.512.345.607.2]8 Kappa (FITC), Lambda (PE), CD19 (APC)
Table 12: Diagnostic flow cytometry panel (flourochrome conjugates shown in parentheses)
Page | 43
isotonic saline (pH 7.4) to remove the lysing solution, red cell debris and any unbound antibody, the supernatant was removed following centrifugation at 320g for 45
seconds, and the remaining cells resuspended in 2 ml of BD Facsflow flow cytometry fluid (pH 7.2) prior to immediate analysis using a FACSCalibur (BD New York, USA).
For each sample, a standard 50,000 events were collected. The flow speed of the instrument was set to a low rate to avoid the false positive events that are frequently associated with high cell count samples (Bartle 2011).
Standard CD45 vs. side scatter/CD14 gating strategies were employed to identify the lymphocyte and monocyte populations in each sample in preparation for analysis, an isotype negative control was also analysed alongside each sample in line with international guidelines (Béné et al. 2011). For all monoclonal antibodies, both the percent positive cells and the mean fluorescent intensity were recorded to allow enumeration of cell subsets and strength of antigen expression per cell.
3.1.5 Flow cytometry protocol (TLR phenotype)
Since TLR 1, 2 and 4 monoclonal antibodies were available as pre-conjugated reagents and the target antigen in each case was expressed on the cell surface, the protocol for sample preparation was identical to that used for the CLL phenotype described in section 3.1.4. The antibody and flourochrome combinations used in this portion of the study are summarised in table 13.
Page | 44
The Intracellular Fixation & Permeabalization technique is designed for use in intracellular staining and flow cytometric analysis and has been formulated to reduce non-specific staining of fluorochrome-labelled antibodies and increase fluorescence signal to noise ratios. In the first step live cells are fixed with a fixation Buffer, containing a 4% solution of formaldehyde which cross- links proteins. The second step uses a permeabalization Buffer which contains 0.1% saponin, which creates holes in the membrane thereby allowing the intracellular staining antibodies to enter the cell effectively.
In order to prepare cells for analysis, 100 microlitres aliquots of EDTA
anticoagulated whole blood were pre-treated with Dako intrastain (Dako, Cambridge UK). 100 microlitres of intrastain solution A (containing formaldehyde) was added to the cells followed by a 15 minute incubation in the dark at room temperature. This step allowed for stabilisation of the cell membrane and was followed by the addition of 2mls of PBS (to quench the reaction), centrifugation at 320g for 5 minutes and discard of the supernatant containing the excess solution A. At this stage there followed the addition of 100 microlitres intrastain solution B (containing saponin) to the centrifuged cells, along with the appropriate monoclonal antibody mix.
Subsequent incubation washing and analysis was the same in every respect to the protocol used for the analysis of the CLL phenotype described in section 3.1.4.
Page | 45
microlitres of anti-mouse FITC flourochrome (R &D systems Minneapolis USA), was included. Subsequent preparation was the same as that used in the TLR 9 preparation protocol described above.
3.1.6 Detailed protocols for preparation of TLR panel Protocol 1: Preparation for TLR 1, 2 & 4 analysis
For each TLR, 3 tubes were prepared for each patient and control, into each was placed 100 microlitres of fresh whole blood collected in EDTA.
10 microlitres of the appropriate pre-conjugated anti TLR monoclonal antibody was added to the each tube and mixed well by gentle vortexing.
To the first tube 10 microlitres of pre-conjugated CD3 was added. To the second tube 10 microlitres of pre-conjugated CD19 was added.
In each case the flourochrome conjugate of the second antibody added was different to that on the anti-TLR antibody.
Samples were incubated for 15 minutes in the dark at room temperature.
After this incubation step 2ml of a lysing solution comprising of 16% Ammonium chloride was added to each tube and the mixture was incubated for a further 15 minutes at room temperature in the dark.
Page | 46
Protocol 2: Preparation for TLR 9 analysis
2 tubes