Fuzzy Exemplification of Hypertension Using Matrix Laboratory (MATLAB)
11
0
0
Full text
(3)
(4)
(5)
(6)
(7)
(8)
(9)
(10)
(11)
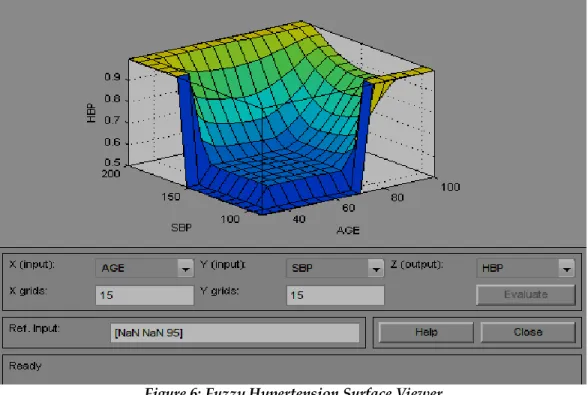
Figure
Related documents
Ameliorating Effect of Gamma Irradiated Chicory Against Carbon Tetra-Chloride Induced Kidney And Testis Damage In
Twelve candidate CNBPs were identified from Arabi- dopsis leaf and callus extracts using an affinity pull- Table 4 Gene ontology biological process annotations of the
that biotic uptake of LMWON is largely driven by microbial demand for C rather than N, particularly in soils with high N supply, with large 13 C losses via mineralisation and other
On the individual side of things, I was able to reflect on a few personal influences derived from different cultures, which have influenced my understanding and experience of Thai
It is difficult to determine the cause of the adverse events to be indeed glycyrrhizin (which is extracted from Glycyrrhiza uralensis ) for the fol- lowing reasons: (1) no
Actions of primary health care professionals to reduce maternal mortality in the Brazilian Northeast
Theme 1 was the actions that PHC professionals took to reduce maternal mortality; its central ideas were home visits, health education, active searches, consultations, referral
