www.impactjournals.com/oncotarget/ Oncotarget, Vol. 7, No. 28
Multiple-level validation identifies
PARK2
in the development of
lung cancer and chronic obstructive pulmonary disease
SeungBaek Lee1,*, Jun She2,3,*, Bo Deng3,4,*, JungJin Kim1,*, Mariza de Andrade3, Jie
Na3, Zhifu Sun3, Jason A. Wampfler3, Julie M. Cunningham5, Yanhong Wu5, Andrew
H. Limper6, Marie-Christine Aubry7, Chris Wendt8,9, Peter Biterman8, Ping Yang3
Zhenkun Lou1
1Division of Oncology Research, Mayo Clinic, Rochester, MN, USA
2Department of Pulmonary Medicine, Zhongshan Hospital, Fudan University, Shanghai, China 3Department of Health Sciences Research, Mayo Clinic, Rochester, MN, USA
4Department of Thoracic Surgery, Institute of Surgery Research, Daping Hospital, Third Military Medical University, Chongqing, China
5Genomics Shared Resource, Mayo Clinic, Rochester, MN, USA
6Division of Pulmonary and Critical Care Medicine, Mayo Clinic, Rochester, MN, USA 7Division of Anatomic Pathology, Mayo Clinic, Rochester, MN, USA
8Department of Medicine, Pulmonary Division, University of Minnesota, Minneapolis, MN, USA 9Department of Medicine, Pulmonary Section, Minneapolis VA Medical Center, Minneapolis, MN, USA *These authors have contributed equally to this work
Correspondence to: Ping Yang, email: [email protected] Zhenkun Lou, email: [email protected]
Keywords: lung cancer, chronic obstructive pulmonary disease, PARK2, inflammation Received: January 27, 2016 Accepted: May 09, 2016 Published: June 13, 2016
ABSTRACT
An important precursor to lung cancer development is chronic obstructive pulmonary disease (COPD), independent of exposure to tobacco smoke. Both diseases are associated with increased host susceptibility, inflammation, and genomic instability. However, validation of the candidate genes and functional confirmation to test shared genetic contribution and cellular mechanisms to the development of lung cancer in patients with COPD remains underexplored. Here, we show that loss of PARK2 (encoding Parkin) increases the expression of proinflammation factors as well as nuclear NF-κB localization, suggesting a role of PARK2 loss in inflammation. Additional exploration showed that PARK2 deficiency promotes genomic instability and cell transformation. This role of PARK2 in inflammation and chromosome instability provides a potential link among Parkin, COPD and lung cancer. A further comprehensive validation of 114 informative single nucleotide polymorphism (SNP) variants of PARK2, in 2,484 cases and controls with well-defined lung cancer and COPD phenotypes, found rs577876, rs6455728 and rs9346917 (p<0.01) to be significantly associated with lung cancer development in people with COPD. Our findings support the evidence that PARK2 might have a tumor suppressor role in the development of COPD and lung cancer.
INTRODUCTION
Lung cancer and chronic obstructive pulmonary disease (COPD) combined, present a major cause of morbidity and mortality globally that has persisted for several decades [1–3]. These two complex diseases are
lung cancer or COPD [5, 7–9]. Chronic inflammation plays a central role and key inflammatory cells such as
macrophages, neutrophils, and T lymphocytes are involved in COPD [10–14]. Macrophages from COPD patients
release higher levels of pro-inflammatory cytokines (TNF-α and IL-6) compared to nonsmoking control subjects [15, 16]. Inflammation and COPD together are
strongly associated with lung cancer but the molecular
basis for inflammation and cancer has not been established
yet.
Loss of function mutations in the gene PARK2
encoding Parkin, an E3 ubiquitin ligase, leads to death of dopaminergic neurons and causes Autosomal Recessive Juvenile Parkinsonism (AR-JP) [17, 18], the neuroprotective role of PARK2 is linked to mitophagy [19]. Recently, PARK2 has been suggested as a
haplo-insufficient tumor suppressor gene, based on the
frequent deletion or mutation in human cancer [20, 21]. Consistent with this notion, overexpression of PARK2 in hepatocarcinoma, glioblastoma, lung cancer, breast cancer and colon cancer cell lines repressed cell growth [20–24]. Furthermore, PARK2-null mice displayed increased
vulnerability to inflammation-induced degeneration when
exposed to chronic systemic lipopolysaccharide (LPS) [25]. Cancer cell lines that harbor a deleted PARK2 gene
show resistance to TNF-α induced cell death [16]. These
observations suggest a potential function of PARK2 as a regulator of immune response. However, how PARK2
functions in immune response and its relationship
to tumorigenesis remains unclear. In this study, we
investigated a potential role of PARK2 in inflammation,
COPD and lung cancer.
RESULTS
Loss of PARK2 maintains higher expression of
cytokines for inflammation
To assess the role of PARK2 in inflammation,
we generated PARK2 knockout (KO) in C57BL/6 mice
and assessed IL-6 levels in mouse serum. Notably, IL-6
levels in PARK2 KO mice were significantly higher than
those in wild type (WT) mice (Figure 1A). Similarly, mouse primary bronchus epithelial cells and mouse
embryonic fibroblasts (MEFs) from PARK2 KO mice
produced more IL-6 than controls (Figure 1B and 1C). Furthermore, the expression of other inflammation markers, IL-1β and TNF-α also increased in PARK2 deleted cells (Figure 1B and 1C). In addition, the
increases caused by PARK2 KO were reversed by exogenous expression of WT PARK2 (Figure 1D).
These results suggest that PARK2 has anti-inflammation
functions. We also performed immunohistochemistry
(IHC) in PARK2 wild type (WT) and knockout (KO) mouse at 10 months (Figure 1E). PARK2 KO mice
showed increased inflammation phenotypes, as evinced
by densely packed plasma cells around lung bronchia. This data suggested that PARK2 deficiency leads to increased inflammation.
Overexpression of PARK2 inhibits localization of
the nuclear NF-κB for inflammation
Nuclear factor kappa B (NF-κB) is a broadly
expressed transcription factor that induces cytokines
and immunoglobulin (Ig) gene expression in COPD-related inflammation [26]. Although NF-κB is present
in its inactive state in the cytoplasm, its p50–p65 heterodimer translocates to the nucleus and binds the
DNA (at the promoter region) when NF-κB is activated by carcinogens, tumor promoters, inflammatory
cytokines, and other chemotherapeutic agents [27]. To
understand PARK2’s role in inflammation, we monitored NF-κB localization in PARK2-depleted primary human
bronchial epithelial BEAS-2B cells using fluorescence
microscopy (Figure 2A and 2B) and immunoblot (Figure 2C). The depletion of PARK2 led to increased
nuclear NF-κB localization in the absence of stimuli (Figure 2A, 2B and 2C). In addition, TNF-α treatment-induced nuclear NF-κB translocation was significantly
blocked by the expression of WT PARK2 (Figure 2D
and 2E). Interestingly, expression of mutant PARK2 that inactivates its E3 ligase has a partial effect in blocking
NF-κB translocation. These results demonstrate that PARK2 suppresses NF-kB activation in an E3 ligase-dependent and -inligase-dependent manner.
We next explored how PARK2 suppresses NF-kB activation. Several papers reported involvement of PARK2 in the antioxidant defense [28, 29]. We
confirmed increased Reactive oxygen species (ROS)
levels in PARK2 KO MEFs (Figure 2F). ROS has been linked to increased Akt activation, and NF-kB activation [30–33]. Consistent with this, we found increased Akt S473 phosphorylation in PARK2 KO MEFs (Figure 2G). Treatment of PARK2 KO MEFs with NAC, ROS scavenger or MK 2206, Akt inhibitor (Figure 2H) decreased NF-kB translocation, suggesting that PARK2 suppresses NF-kB signaling through ROS/ Akt regulation [30, 32, 33].
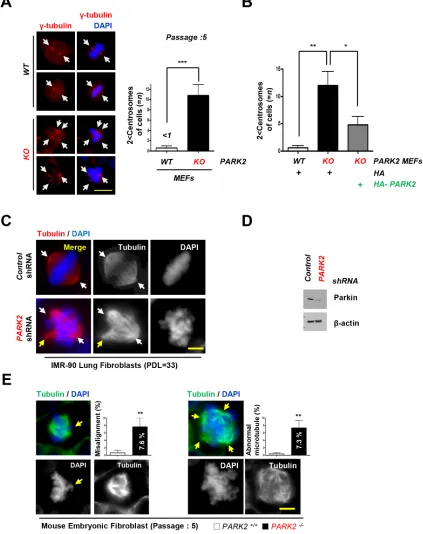
Deletion of PARK2 induced chromosome stability and tumor initiation
In addition to increased inflammation, PARK2 deficiency also resulted in genomic instability [15, 21,
34]. We found that loss of PARK2 induced centrosome
duplication. Using an antibody to γ-tubulin, we compared
the number of centrosome in PARK2 KO and wild-type MEFs at Passage 5. Our data showed that 11 % of
PARK2 corrected the centrosome abnormities (Figure
3B). Similar results were obtained using IMR-90 lung fibroblasts (PDL=33) or MEFs supporting the idea that PARK2 deficiency results in genomic instability (Figure
3C, 3D and 3E).
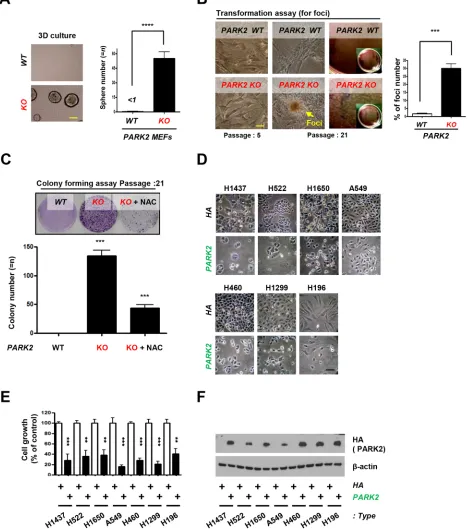
Our results suggest that PARK2 deficiency results in increased inflammation and genomic instability, both
of which are potential drivers of tumorigenesis [20,
21, 23, 25]. To confirm whether PARK2 contributes to
tumorigenesis in ex-vivo models, we seeded PARK2 WT or KO MEFs in 3-D organoid culture system. Culture of cells as three-dimensional (3-D) aggregates can enhance
[image:3.612.72.545.171.650.2]in vitro tests for basic biological research as well as mimics tissue organization condition in vivo [35, 36]. We found that PARK2 KO MEFs, but not WT MEFs, formed colonies in 3-D culture (Figure 4A).Furthermore, we found that PARK2 knockout MEFs became transformed and promoted cancer cell growth by foci and colony
Figure 1: Loss of PARK2 maintains higher expression of cytokines for inflammation.A-C. Cytokines, IL-6, IL-1β or TNF-α
protein or mRNA levels in serum from C57BL/6 mice (A), mouse primary bronchus epithelial cells (B), MEFs (C) of PARK2 WT or KO
were analyzed by ELISA or qRT-PCR. D. After infection with the indicated plasmids, cytokines in the cultured MEFs supernatants were
Figure 2: Overexpression of PARK2 inhibits localization of the nuclear NF-κB for inflammation.A-C. After infection with
the indicated shRNAs, Primary and immortalized (BEAS-2B) human bronchial epithelial cell lysates were fixed for immunofluorescence assay or blotted with the indicated antibodies. (A) Representative images of the cells with indicated localization of the nuclear NF-κB (white arrows). Cells were fixed and stained with DAPI. TNF-α-treated cells were shown as positive controls. Scale bar, 20 μm. (B) Analysis of numerical nuclear NF-κB events. 100 cells were counted in each experiment. **, p < 0.01 and ***,p < 0.001 by one-way ANOVA. (C)
Immunoblot analysis with indicated antibodies after nuclear fractionation. D. After transfection with the indicated plasmids, Beas-2B cells
were selected by G418 to select stable transfectants, cells were treated with TNF-α and cells lysates were fixed for immunofluorescence
assay or cell lysates were analyzed immunobloting. Representative images of the cells with indicated localization of the nuclear
NF-κB (white arrows). Cells were fixed and stained with DAPI. TNF-α-treated cells were shown as negative controls. Scale bar, 20 μm. Quantification of the nuclear NF-κB localization. Results are shown as means (±SEM), and at least three experiments were performed for all experiments. *, p < 0.05, **, p < 0.01 and ***, p < 0.001 by one-way ANOVA. E. After nuclear fractionation, NF-κB, Lamin B1 and β–tubulin expression was measured by immunoblot. Lamin B1, nuclear marker; β–tubulin, cytosol marker. F. Cells were stained with
DCF-DA, fixed and analyzed by immunofluorescence. G. Cells were harvested and analyzed by immunobloting. H. Cells were treated with
Figure 3: Deletion of PARK2 induced chromosome instability.A. PARK2 deficiency results in centrosome amplification in MEFs
at passage 5. (left) Immunofluorescence staining shows impaired mitoses in MEFs depleted of PARK2. Red, γ-tubulin; White arrows, centrosome in mitosis. The scale bar is 20 μm. (right) Quantification of 2 < centrosomes cells. ***, p < 0.001 by one-way ANOVA. n=10. B. After infection with the indicated plasmids, MEFs lysates were fixed for immunofluorescence assay. Quantification of 2 < centrosomes cells using γ-tubulin. Results are shown as means (±SEM), and at least three experiments were performed for all experiments. *, p < 0.05
and **, p < 0.01 by one-way ANOVA. C. Immunofluorescence staining shows impaired mitoses in IMR 90 lung fibroblast cells depleted
of PARK2. White arrows, centrosome in mitosis. Yellow arrows, abnormal chromosome. The scale bar is 20 μm. D. Cell were harvested at indicated times and analyzed by immunobloting. E. Impaired mitoses including multipolar spindles, misalignment and abnormal
Figure 4: PARK2 loss leads to tumor initiation and overexpression of PARK2 inhibits cell proliferation in lung cancer cell lines.A. Primary MEFs were applied on 3-D cultures system for 2 weeks and counted the sphere of the cells. (top) Representative images indicate the sphere cells. (bottom) Quantification of the sphere number. ****, p < 0.0001 by one-way ANOVA. n=6. (B. and C.) PARK2 WT and KO MEFs were analyzed for foci formation at passage 5 and 21 (B), and colony formation at passage 21 C. The scale bar
is 20 μm. Results are shown as means (±SEM), and at least three experiments were performed for all experiments. NAC, ROS scavenger. ***, p < 0.001 by one-way ANOVA. D. The growth of lung cancer cell lines (H1437, H522, H1650, A549, H460, H1299 and H196) was inhibited through infection with PARK2. Cells were transfected with the indicated plasmids, and then cell lysates were blotted with the indicated antibodies. E. The percentage of lung cancer cell growth compared to controls after transfected PARK2. Results shown as means
(± SEM), and at least three experiments were performed for all experiments. **, p < 0.01 and ***, p < 0.001 by one-way ANOVA. F. PARK2
formation assay, where the frequency of foci number and colony number were increased (Figure 4B and 4C), suggesting a role of PARK2 loss in tumor initiation. Treatment of PARK2-deficient MEFs with N-acetyl-l-cysteine (NAC), ROS scavenger, significantly decreased
colony formation, suggesting that ROS is a contributing factor in cellular formation induced by PARK2 loss. We next examined the potential role of PARK2 on the growth of lung cancer cells. After the PARK2 gene was expressed in seven lung cancer cell lines (H1437, H522, H1650, A549, H460, H1299 and H196), the growth of
tumor cell lines was significantly inhibited compared
to controls (Figure 4D, 4E and 4F), which suggests that PARK2 overexpression plays a critical role in the inhibition of lung cancer cell proliferation [28]. Multiple
PARK2 mutations have also been identified in human
lung cancer (Supplementary Table S1). These results suggest that PARK2 deficiency might contribute to lung
cancer development.
PARK2 as a potential target to reduce the risk of COPD and lung cancer
As PARK2 deficiency results in both increased inflammation and genomic instability [37–39], we
assessed a potential role of PARK2 in lung cancer and COPD through a comprehensive validation study of 114 informative single nucleotide polymorphism (SNP) variants of PARK2 (Supplementary Table S2 ) in
2,484 cases and controls with well-defined lung cancer (LC) and COPD phenotypes (Table 1). For specific
comparisons, we assigned the four groups into the six models as follows: Model 1: LC+COPD+ vs. LC-COPD- (cases with both compared to controls with neither); Model 2: LC+COPD- vs. LC-COPD- (cases with LC compared to controls with neither); Model 3: LC-COPD+ vs. LC-COPD- (cases with COPD compared to controls with neither); Model 4: LC+COPD+ vs. LC-COPD+ (cases with both compared to controls with COPD); Model 5: LC+ vs. (LC cases compared to LC-free controls, adjusting for COPD and other covariates including age, sex, and smoking history); and Model 6: COPD+ vs. (COPD cases compared to COPD-free controls, adjusting for LC and other covariates including age, sex, and smoking history). After using two methods of minimizing false positive results and a penalized logistic regression analysis [40–42], rs577876, rs6455728 and rs9346917 (p<0.01) were confirmed to
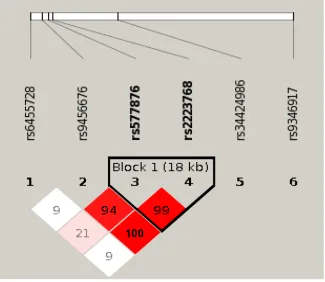
be associated with lung cancer development in people with COPD (in Model 4 only, Table 2 ). Figure 5 shows
the LD haplotype blocks of five SNPs that were tested significant in Model 4. Noted is rs34424986 [24, 43],
which lies between rs2223468 and rs9346917.
This is the first study that presents lung cancer
with COPD as a separate disease entity from the lung cancer or COPD phenotype [44]. We found the PARK2
gene associates with the phenotype of lung cancer with COPD, compared to COPD patients. Notably, altered PARK2 expression induced chromosomal instability and
increased inflammation, similar to that found in the COPD
phenotype. We demonstrated that PARK2 may be a bona
fide tumor suppressor gene that may be responsible for
the development of progression lung cancer with COPD, suggesting PARK2 as a potential target to reduce the risk of COPD and lung cancer. Our results evinced the biological plausibility as well as the common and unique mechanisms in lung cancer with COPD development [45].
DISCUSSION
Our analysis of PARK2, located at 6q25.2-q27,
revealed four significant yet independent SNPs to be
associated with lung cancer with COPD. Although the function of PARK2 in lung cancer remains unknown, we
suggest that PARK2-deficiency induced inflammation
and genomic instability are possible factors contributing to lung cancer. PARK2 mutations are known to cause
Parkinson’s disease and have also been identified in
human malignancies, including lung cancer, and are associated with the potential to inhibit cancer cell growth
invitro [21], suggesting that PARK2 may function as a tumor suppressor gene. Additionally, a SNP in PARK2 was associated with a decline in forced expiratory volume in 1 second (FEV1) and a recurrent PARK2 mutation was recently reported [24, 46]. Our study demonstrated that
PARK2 expression significantly inhibited cell growth
in lung cancer cells lines compared to controls, while
abnormal inflammation and cell division was induced by PARK2 deficiency. This result could be interpreted as a role in cancer initiation, progression or both. As inflammation
and chromosomal instability are a driving forces for tumor initiation, it is possible that PARK2 mutation/loss may also involved in lung cancer progression and prognosis (Supplementary Figure S1).
In conclusion, our multi-level validation study
suggests a critical role of PARK2 in the development of lung cancer with COPD. We showed that PARK2 inhibiting role in inflammation, lung cancer cell growth,
and the chromosomal instability that might contribute to tumor initiation when PARK2 expression is altered. We used strict inclusion criteria in the study. Lung cancer
diagnoses were re-confirmed by pulmonary pathologists and COPD was confirmed by lung function testing. The definition of COPD phenotype based on lung function tests
minimizes the phenotypic heterogeneity caused by the use of clinical records or patient reported symptoms. As a result, the reliability and validity of our study is sound.
These findings have advanced the current understanding
Table 1: Distribution of lung cancer (LC) and chronic obstructive pulmonary diseases (COPD) in 2484 cases and controls
COPD + COPD - Total
LC + n +/+ (573) n +/− (612) 1185
LC − n −/+ (537) n −/− (762) 1299
[image:8.612.61.556.196.282.2]Total 1110 1374 2484
Table 2: Significant results of Testing 114 Informative PARK2 SNPs PARK2 Gene
(Chromosome 6)SNP rs-ID Alleles(major: minor) controls*MAF cases*MAF Penalized regressionOR P-value
PARK2 rs577876 A:G 0.41 0.35 0.73 5.49x10⁻⁴
PARK2 rs6455728 G:T 0.29 0.24 0.70 3.28x10⁻³
PARK2 rs9346917 C:T 0.35 0.30 0.68 1.66x10⁻³
* MAF is Minor Allele Frequency calculated from the controls (LC+COPD-) and cases (LC+COPD+).
Figure 5: Linkage disequilibrium (LD) plot of 6 SNPs in PARK2 gene. Among the six SNPs, five (SNPs 1-4 and 6) are tested significant in our Model 4 that comparing cases with lung cancer and chronic obstructive pulmonary diseases (COPD) to controls with
COPD only. One SNP rs34424986, which was recently reported from an independent study [24] but not included on GWAS panels, is
shown relative position among the five tested significant SNPs. Numbers shown in blocks are D’ values (i.e., D’x100; 99 means D’ = 0.99),
which measures the strength of LD between two neighboring SNPs. The higher of D’ value, the more statistically associated between two
SNPs. Because the high LD between rs9456676, rs577876 and rs2223768, final results of penalized regression model removed two SNPs
(rs9456676 and 2223768). LOD, means logarithm of odds score, is a statistical test used in genetic linkage analysis. Legends: White -
[image:8.612.145.470.344.626.2]MATERIALS AND METHODS
Mouse strains and MEFsAll animal procedures were approved by the
Institutional Animal Care and Use Committee which
also approved experimental procedures. Mouse strains were described previously [34, 47]. PARK2 KO C57BL/6 (6–8 weeks old, female) mice were purchased from the Jackson Laboratory (Bar Harbor, ME, USA) and
mated. Mouse embryonic fibroblasts were isolated from
individual day 11.5-13.5 (E11.5 - E13.5) embryos by uterine dissection. Each embryo was washed gently with 1x PBS (pH 7.2), followed by removal of the mouse embryo’s head and liver. The embryo body was suspended in 0.5 ml of 0.25 % Trypsin-EDTA, and then forced through a 1 ml syringe with an 18-gauge needle. The tissue homogenate was incubated for 30 min at 37 °C, triturated by drawing the suspension through a pipette, and then evenly divided into two 10
cm tissue culture dishes in Dulbecco’s modified Eagle’s
medium (DMEM) with 15 % fetal bovine serum (FBS). Early-passage MEFs (passage 1–5) were used for all experiments, and at least three lines were examined for all studies. Animals were housed in a pathogen-free barrier environment throughout the study.
Cells and cell lines and reagent
All cell lines were sourced from the American Type Culture Collection (ATCC, Manassas, VA). These included seven lung cancer cells, H1437, H522, H1650, A549, H460, H1299 and 196, and one normal human
lung fibroblast cell line, IMR-90. c. For the human lung fibroblast IMR-90 cells ranging from 29 to 34 in
population doubling level (PDL) were used. Cell lines were maintained in Eagle’s minimal essential media
(EMEM, Gibco-Invitrogen, Grand Island, NY) and contained 10 % (15 % for IMR-90 cells) heat-inactivated FBS (Gibco-Invitrogen), sodium bicarbonate (2 mg/ml;
Sigma-Aldrich, St Louis, MO), penicillin (100 units/
ml), and streptomycin (100 μg/ml; Gibco-Invitrogen). An ELISA kit (R&D Systems) was used to assay IL-6
production, according to the manufacturer’s instructions.
The concentrations of IL-6 were normalized to the cell numbers in the cell culture. 2’,7’- dichlorofluorescein
diacetate (DCF-DA) was obtained from Molecular Probes. MK 2206 was obtained from selleckchem. N-acetylcystein (NAC) was obtained from
Gibco-Invitrogen.
Immunoblotting and antibodies
For immunoblotting, extraction of proteins from
cultured cells with a modified buffer was followed
by immunoblotting with corresponding antibodies.
Briefly, protein samples were fractionated on 10 - 15
% SDS polyacrylamide gels and electroblotted onto Hybond ECL nitrocellulose membranes (Amersham Pharmacia Biotech) using a semidry transfer apparatus (Bio-Rad). Rabbit polyclonal antibodies recognizing PARK2 (ab15954), were obtained from Abcam. Mouse monoclonal antibody recognizing PARK2 (sc-32282) and Lamin B1 (sc-20682) were purchased from Santa Cruz Biotechnology. Rabbit polyclonal antibody recognizing
NF-κB (sc-372) was obtained from Santa Cruz Biotechnology. Anti-β-tubulin and HA mouse antibodies
were purchased from Sigma.
Immunofluorescence
For immunofluorescence staining, MEF or IMR90, Beas-2B cells were plated on glass coverslips
and transfected with the indicated constructs. Cells
were then fixed in 3.7 % Paraformaldehyde for 10
min at room temperature and stained using standard
protocols. Immunofluorescence images were taken using fluorescent microscopy (Nikon Microscope,
Melville, New York).
Plasmid and gene silencing by lentiviral shRNAs
The pMX retroviral vector containing the human cDNAs for HA-PARK2 was obtained from Addgene (plasmid 38248, Cambridge, MA). PARK2 vectors were obtained from Sigma-Aldrich and Open Biosystems.
Colony formation or foci assay
For colony formation or foci assay, early-passage MEFs (passage 5) cells were plated at low density into
60-mm cell culture plates. When sufficient colonies
were visible, typically after 2-3 weeks, cells were
washed twice in PBS before fixing in ice-cold 70 %
methanol for 30 min, stained by 0.2 % Crystal violet for 2-3 h. The following day cells were rinsed in PBS and air-dried.
Cell fractionation assay
Cell preparations were described previously. [31] The Nuclear extract kit (California, USA) was used to perform cellular fractionation in accordance with the manufacturer’s instructions. The purity of the extract was
confirmed by western blot analysis against anti-cytosol-specific-tubulin-actin (Sigma-Aldrich) or anti-nuclear-specific-Lamin B1.
3-dimensional (3-D) organoid culture Assay
For 3-dimensional (3-D) assays, PARK2 WT or KO
MEFs were cultured on NanoCulture plates (SCIVAX
Corp.). After seeding cells, cell were cultured in same condition with 2-D culture and observe cell images and recover sample 0, 3, 5, 7 days after seeding. Cells were lysed in Spheroid Lysis Buffer (Scivax).
Phenotype definitions
Lung cancer cases were pathologically diagnosed
as defined by the World Health Organization [48].
COPD diagnosis was based on the criteria of the Global
Initiative for Chronic Obstructive Lung Disease (GOLD)
[49], i.e., subjects with a FEV1/FVC < 70 % by lung function test (PFT) as COPD+ regardless of sub-groups (emphysema and/or chronic bronchitis). All subjects provided written informed consent, and the study
protocol was approved by the Mayo Clinic Institutional
Review Board.
Experimental design for PARK2 SNPs validation
Subject selection and detailed phenotyping
A total of 2,484 well-defined subjects were
included in the current study following a 4-step sampling strategy in order to minimize the confounding factors and maximize the uncommon groups: [1] enriching never-smoking cases; [2] balancing three phenotype groups, i.e., COPD only (COPD+), lung cancer only (LC+), both COPD and lung cancer (LC+COPD+) and controls (LC-COPD-); [3] matching on current vs. former smoking history with gender and age; and [4] for former smokers, matching on
quitting years. To minimize the heterogeneity due to
population stratification, we restricted our study to subjects of European descent [9, 44, 50–52]. In total,
the study consisted of 612 with LC+, 537 COPD+, 573 LC+COPD+, and 762 controls; yielding 1,110 COPD cases and 1,185 lung cancer cases.
Genome wide analysis and candidate SNPs validation Using GWAS Data from two Illumina platforms
(OmniExpress, 610k and 370k Human BeadChips;
Illumina, San Diego, California, USA) we performed
genome-wide association analyzes using the models described above Concordance between platforms was > 99.5 %. We removed samples with genotyping call rates < 95 % from structure analysis. SNP quality control removed SNPs with a call rate < 95 %, minor allele frequencies (MAF) < 0.01, Hardy-Weinberg equilibrium test p < 0.0001. A quantile-quantile plot was generated using logistic regression for additive genetic model, and
4 sets of above-defined group comparisons of genomic inflation factors (λGC) were 1.006, 1.011, 0.98122, 0.98185, respectively. A total of 114 candidate SNPs for the PARK2 gene were matched in our genotyping platforms, after removing the redundant SNPs using linkage disequilibrium (LD) test (r2≥0.8) [53].
Real time PCR
RNA preparation, cDNA, and qRT-PCR were described previously [31]. The following primers were used:
Primers Used for Real-Time PCR
IL-6 Primer sequence: Forward 5’-CCTGCGTTTAAATA
ACATCAGCTTTAGCTT-3’, Reverse 5’-GCACAATGTGACGT CGTTTAGCATCGAA-3’,
IL-1β Primer sequence: Forward 5’-CACAGCAGCA
CATCAACAAG-3’,
Reverse 5’-GTGCTCATGTCCT CATCCTG-3’,
TNF-α Primer sequence: Forward 5’-CCAGCCAGCAG
AAGCTCCCTCAGCGAG-3’, Reverse 5’-GCGGATCATGCT TTCTGTGCTCATGGTGTC-3’
Statistical analysis
Each assay was performed in triplicate and independently repeated at least three times. The results
are presented as mean ± standard error of mean (SEM).
Statistical analyses were performed using GraphPad Prism software (version 4.02; GraphPad Software, San Diego, CA). One-way analysis of variance (ANOVA) followed by T-test was used to compare the results. A difference was
ACKNOWLEDGMENTS
The study was supported by the National Heart,
Lung, and Blood Institute (NHLBI) grant,
R01-HL107612 (Yang and Wendt), and National Cancer
Institute grants, R01-CA80127 (Yang), R01-CA84354
(Yang), R01-CA130996 (Lou), R01-CA108961 (Lou) and R01-CA148940 (Lou), and Mayo Clinic Foundation Funds (Yang and Lou), Mayo Clinic Cancer Center grant CA15083. We thank Dr. Thomas C. Smyrk (Mayo
clinic) for IHC analysis. Jun She was supported by the
National Natural Science Foundation for Young Scholars
of China, No. 81200051 and Scientific Project for Fudan
University, No. 20520133474. Bo Deng was supported by National Natural Science Foundation of China, No. 81101782 and Third Military Medical University MiaoPu project. Ola Larsson was supported by the Swedish Research Council and the Wallenbberg Academy Fellows Programme. Andrew Limper was supported by funds from the Annenberg Foundation. Biospeciens accessioning and processing, genotyping and RNA microarray analysis were supported partly by the Mayo Clinic Cancer Center grant CA15083.
CONFLICTS OF INTEREST
The authors declare no conflict of interest.
REFERENCES
1. Wang H, Dwyer-Lindgren L, Lofgren KT, Rajaratnam JK, Marcus JR, Levin-Rector A, Levitz CE, Lopez AD
and Murray CJ. Age-specific and sex-specific mortality
in 187 countries, 1970-2010: a systematic analysis for the Global Burden of Disease Study 2010. Lancet. 2012; 380:2071-2094.
2. Zhong N, Wang C, Yao W, Chen P, Kang J, Huang S, Chen B, Wang C, Ni D, Zhou Y, Liu S, Wang X, Wang D, Lu J, Zheng J and Ran P. Prevalence of chronic obstructive pulmonary disease in China: a large, population-based survey. American journal of respiratory and critical care medicine. 2007; 176:753-760.
3. She J, Yang P, Hong Q and Bai C. Lung cancer in China: challenges and interventions. Chest. 2013; 143:1117-1126. 4. Yang P, Sun Z, Krowka MJ, Aubry MC, Bamlet WR,
Wampfler JA, Thibodeau SN, Katzmann JA, Allen MS,
Midthun DE, Marks RS and de Andrade M.
Alpha1-antitrypsin deficiency carriers, tobacco smoke, chronic
obstructive pulmonary disease, and lung cancer risk. Archives of internal medicine. 2008; 168:1097-1103. 5. Soler Artigas M, Wain LV, Repapi E, Obeidat M, Sayers I,
Burton PR, Johnson T, Zhao JH, Albrecht E, Dominiczak AF, Kerr SM, Smith BH, Cadby G, Hui J, Palmer LJ,
Hingorani AD, et al. Effect of five genetic variants
associated with lung function on the risk of chronic
obstructive lung disease, and their joint effects on lung function. American journal of respiratory and critical care medicine. 2011; 184:786-795.
6. Young RP, Hopkins RJ, Christmas T, Black PN, Metcalf P and Gamble GD. COPD prevalence is increased in lung cancer, independent of age, sex and smoking history. The European respiratory journal. 2009; 34:380-386.
7. Subramanian J and Govindan R. Lung cancer in never smokers: a review. Journal of clinical oncology. 2007; 25:561-570.
8. McKay JD, Hung RJ, Gaborieau V, Boffetta P, Chabrier A, Byrnes G, Zaridze D, Mukeria A, Szeszenia-Dabrowska N, Lissowska J, Rudnai P, Fabianova E, Mates D, Bencko V, Foretova L, Janout V, et al. Lung cancer susceptibility locus at 5p15.33. Nature genetics. 2008; 40:1404-1406.
9. Li Y, Sheu CC, Ye Y, de Andrade M, Wang L, Chang SC, Aubry MC, Aakre JA, Allen MS, Chen F, Cunningham JM, Deschamps C, Jiang R, Lin J, Marks RS, Pankratz VS, et al. Genetic variants and risk of lung cancer in never smokers: a genome-wide association study. The Lancet Oncology. 2010; 11:321-330.
10. Barnes PJ. Immunology of asthma and chronic obstructive pulmonary disease. Nature reviews Immunology. 2008;
8:183-192.
11. Barnes PJ, Shapiro SD and Pauwels RA. Chronic obstructive pulmonary disease: molecular and cellular mechanisms. The European respiratory journal. 2003; 22:672-688.
12. Hogg JC, Chu F, Utokaparch S, Woods R, Elliott WM, Buzatu L, Cherniack RM, Rogers RM, Sciurba FC, Coxson HO and Pare PD. The nature of small-airway obstruction in chronic obstructive pulmonary disease. The New England journal of medicine. 2004; 350:2645-2653.
13. Jeffery PK. Comparison of the structural and inflammatory
features of COPD and asthma. Giles F. Filley Lecture. Chest. 2000; 117:251S-260S.
14. Saetta M, Turato G, Baraldo S, Zanin A, Braccioni F, Mapp CE, Maestrelli P, Cavallesco G, Papi A and Fabbri
LM. Goblet cell hyperplasia and epithelial inflammation
in peripheral airways of smokers with both symptoms of
chronic bronchitis and chronic airflow limitation. American
journal of respiratory and critical care medicine. 2000; 161:1016-1021.
15. Shapiro SD. The macrophage in chronic obstructive pulmonary disease. American journal of respiratory and critical care medicine. 1999; 160:S29-32.
16. Pauwels RA, Buist AS, Calverley PM, Jenkins CR and Hurd SS. Global strategy for the diagnosis, management, and prevention of chronic obstructive pulmonary disease.
NHLBI/WHO Global Initiative for Chronic Obstructive
17. Kitada T, Asakawa S, Hattori N, Matsumine H, Yamamura Y, Minoshima S, Yokochi M, Mizuno Y and Shimizu N. Mutations in the parkin gene cause autosomal recessive juvenile parkinsonism. Nature. 1998; 392:605-608. 18. Lucking CB, Durr A, Bonifati V, Vaughan J, De Michele
G, Gasser T, Harhangi BS, Meco G, Denefle P, Wood
NW, Agid Y and Brice A. Association between early-onset Parkinson’s disease and mutations in the parkin gene. The New England journal of medicine. 2000; 342:1560-1567.
19. Winklhofer KF. Parkin and mitochondrial quality control: toward assembling the puzzle. Trends Cell Biol. 2014; 24:332-41. doi: 10.1016/j.tcb.2014.01.001.
20. Poulogiannis G, McIntyre RE, Dimitriadi M, Apps JR, Wilson CH, Ichimura K, Luo F, Cantley LC, Wyllie
AH, Adams DJ and Arends MJ. PARK2 deletions occur frequently in sporadic colorectal cancer and accelerate adenoma development in Apc mutant mice. Proceedings of the National Academy of Sciences of the United States of America. 2010; 107:15145-15150.
21. Veeriah S, Taylor BS, Meng S, Fang F, Yilmaz E, Vivanco
I, Janakiraman M, Schultz N, Hanrahan AJ, Pao W, Ladanyi
M, Sander C, Heguy A, Holland EC, Paty PB, Mischel PS, et al. Somatic mutations of the Parkinson’s disease-associated gene PARK2 in glioblastoma and other human malignancies. Nature genetics. 2010; 42:77-82.
22. Radulescu S, Ridgway RA, Appleton P, Kroboth K, Patel S,
Woodgett J, Taylor S, Nathke IS and Sansom OJ. Defining
the role of APC in the mitotic spindle checkpoint in vivo:
APC-deficient cells are resistant to Taxol. Oncogene. 2010;
29:6418-6427.
23. Wang F, Denison S, Lai JP, Philips LA, Montoya D, Kock N, Schule B, Klein C, Shridhar V, Roberts LR and Smith
DI. Parkin gene alterations in hepatocellular carcinoma.
Genes, chromosomes & cancer. 2004; 40:85-96.
24. Xiong D, Wang Y, Kupert E, Simpson C, Pinney SM, Gaba CR, Mandal D, Schwartz AG, Yang P, de Andrade M, Pikielny C, Byun J, Li Y, Stambolian D, Spitz MR, Liu Y, et al. A recurrent mutation in PARK2 is associated with familial lung cancer. American journal of human genetics. 2015; 96:301-308.
25. Frank-Cannon TC, Tran T, Ruhn KA, Martinez TN, Hong
J, Marvin M, Hartley M, Trevino I, O’Brien DE, Casey B, Goldberg MS and Tansey MG. Parkin deficiency increases vulnerability to inflammation-related nigral
degeneration. The Journal of neuroscience. 2008; 28:10825-10834.
26. Rom O, Avezov K, Aizenbud D and Reznick AZ.
Cigarette smoking and inflammation revisited. Respiratory
physiology & neurobiology. 2013; 187:5-10.
27. Hah N, Benner C, Chong LW, Yu RT, Downes M and Evans
RM. Inflammation-sensitive super enhancers form domains
of coordinately regulated enhancer RNAs. Proceedings of the National Academy of Sciences of the United States of America. 2015; 112:E297-302.
28. Palacino JJ, Sagi D, Goldberg MS, Krauss S, Motz C, Wacker M, Klose J and Shen J. Mitochondrial dysfunction
and oxidative damage in parkin-deficient mice. The Journal
of biological chemistry. 2004; 279:18614-18622.
29. Zhang C, Lin M, Wu R, Wang X, Yang B, Levine AJ, Hu W and Feng Z. Parkin, a p53 target gene, mediates the role of p53 in glucose metabolism and the Warburg effect. Proceedings of the National Academy of Sciences of the United States of America. 2011; 108:16259-16264. 30. Zha L, Chen J, Sun S, Mao L, Chu X, Deng H, Cai
J, Li X, Liu Z and Cao W. Soyasaponins can blunt
inflammation by inhibiting the reactive oxygen species-mediated activation of PI3K/Akt/NF-kB pathway. PloS
one. 2014; 9:e107655.
31. Lee SB, Kim JJ, Chung JS, Lee MS, Lee KH, Kim BS and Do Yoo Y. Romo1 is a negative-feedback regulator of Myc. Journal of cell science. 2011; 124:1911-1924.
32. Wang BJ, Sheu HM, Guo YL, Lee YH, Lai CS, Pan MH and Wang YJ. Hexavalent chromium induced ROS formation, Akt, NF-kappaB, and MAPK activation, and TNF-alpha
and IL-1alpha production in keratinocytes. Toxicology
letters. 2010; 198:216-224.
33. Yang J, Li Q, Zhou XD, Kolosov VP and Perelman JM. Naringenin attenuates mucous hypersecretion by modulating reactive oxygen species production and
inhibiting NF-kappaB activity via EGFR-PI3K-Akt/ERK
MAPKinase signaling in human airway epithelial cells. Molecular and cellular biochemistry. 2011; 351:29-40. 34. Lee SB, Kim JJ, Nam HJ, Gao B, Yin P, Qin B, Yi SY, Ham H,
Evans D, Kim SH, Zhang J, Deng M, Liu T, Zhang H, Billadeau DD, Wang L, et al. Parkin Regulates Mitosis and Genomic Stability through Cdc20/Cdh1. Molecular cell. 2015; 60:21-34. 35. Jechlinger M. Organotypic culture of untransformed and
tumorigenic primary mammary epithelial cells. Cold Spring Harbor protocols. 2015; 2015:457-461.
36. Haycock JW. 3D cell culture: a review of current approaches and techniques. Methods Mol Biol. 2011; 695:1-15. 37. Houghton AM. Mechanistic links between COPD and lung
cancer. Nature reviews Cancer. 2013; 13:233-245. 38. Moghaddam SJ, Barta P, Mirabolfathinejad SG,
Ammar-Aouchiche Z, Garza NT, Vo TT, Newman RA, Aggarwal BB, Evans CM, Tuvim MJ, Lotan R and Dickey BF. Curcumin
inhibits COPD-like airway inflammation and lung cancer
progression in mice. Carcinogenesis. 2009; 30:1949-1956. 39. Bao Z, Xiong J, Li W, Chen Z, Shen H and Ying S.
Genomic instability in chronic airway inflammatory
diseases. Biomedical journal. 2015; 38:117-124.
40. Benjamini Y and Hochberg Y. Controlling the False Discovery Rate: A Practical and Powerful Approach to Multiple Testing. Journal of the Royal Statistical Society Series B (Methodological). 57:289-300.
42. Tibshirani R. Regression Shrinkage and Selection via the Lasso. Journal of the Royal Statistical Society (Series B). 1996; 58:267-288.
43. Barrett JC, Fry B, Maller J and Daly MJ. Haploview: analysis and visualization of LD and haplotype maps. Bioinformatics. 2005; 21:263-265.
44. Young R, Hopkins R, Etzel C and El-Zein R. Genetics of lung cancer susceptibility and COPD. The Lancet Oncology. 2011; 12:622-623.
45. Tracy RP. ’Deep phenotyping’: characterizing populations in the era of genomics and systems biology. Current opinion in lipidology. 2008; 19:151-157.
46. Curjuric I, Imboden M, Nadif R, Kumar A, Schindler C,
Haun M, Kronenberg F, Kunzli N, Phuleria H, Postma DS, Russi EW, Rochat T, Demenais F and Probst-Hensch NM. Different genes interact with particulate matter and tobacco smoke exposure in affecting lung function decline in the general population. PloS one. 2012; 7:e40175.
47. Goldberg MS, Fleming SM, Palacino JJ, Cepeda C, Lam HA, Bhatnagar A, Meloni EG, Wu N, Ackerson LC, Klapstein GJ, Gajendiran M, Roth BL, Chesselet MF, Maidment NT, Levine MS and Shen J.
Parkin-deficient mice exhibit nigrostriatal deficits but not loss of
dopaminergic neurons. The Journal of biological chemistry. 2003; 278:43628-43635.
48. Travis WD, World Health Organization., International Agency for Research on Cancer., International Association
for the Study of Lung Cancer. and International Academy
of Pathology. (2004). Pathology and genetics of tumours
of the lung, pleura, thymus and heart. (LyonOxford:IARC
PressOxford University Press (distributor)).
49. Haughney J, Gruffydd-Jones K, Roberts J, Lee AJ, Hardwell A and McGarvey L. The distribution of COPD
in UK general practice using the new GOLD classification.
The European respiratory journal. 2014; 43:993-1002. 50. de Andrade M, Li Y, Marks RS, Deschamps C, Scanlon PD,
Olswold CL, Jiang R, Swensen SJ, Sun Z, Cunningham JM,
Wampfler JA, Limper AH, Midthun DE and Yang P. Genetic
variants associated with the risk of chronic obstructive pulmonary disease with and without lung cancer. Cancer prevention research. 2012; 5:365-373.
51. Sun Z, Aubry MC, Deschamps C, Marks RS, Okuno SH, Williams BA, Sugimura H, Pankratz VS and Yang P. Histologic grade is an independent prognostic factor for survival in non-small cell lung cancer: an analysis of 5018 hospital- and 712 population-based cases. The Journal of thoracic and cardiovascular surgery. 2006; 131:1014-1020. 52. Swensen SJ, Jett JR, Sloan JA, Midthun DE, Hartman
TE, Sykes AM, Aughenbaugh GL, Zink FE, Hillman SL, Noetzel GR, Marks RS, Clayton AC and Pairolero PC. Screening for lung cancer with low-dose spiral computed tomography. American journal of respiratory and critical care medicine. 2002; 165:508-513.