www.impactjournals.com/oncotarget/ Oncotarget, Vol. 7, No. 24
INTRODUCTION
Lung cancer is the most common malignant tumor and the leading cause of cancer death worldwide, with 1.6 million new cases and 1.38 million deaths annually [1, 2]. Non-small cell lung cancer (NSCLC) accounts for 80–85% of all lung malignancies and the overall 5-year survival of patients with NSCLC remains approximately 15–20% [3, 4]. Although the driver mutations including epidermal growth factor receptor (EGFR) and anaplastic lymphoma kinase (ALK) have revolutionized the treatment and prognosis of NSCLC, it just focused on the cancer cell intrinsic properties [5, 6]. More and more recent studies have begun to investigate the prognostic and clinicopathological role of tumor microenvironment (TME) in NSCLC [7, 8]. In the past, it had been supposed that
the tumorigenesis and failure of cancer immunotherapy
was due to the insufficient activation of immune system.
Recently, increasing evidence indicates that inhibitory function plays the crucial role in the TME [6, 9]. One of
the most significant inhibitory components is the regulatory
T cells (Tregs).
Tregs are one of the most important cells in the TME. Tregs-mediated suppression of tumor-associated antigens has been proposed as a potential mechanism to explain the failure of anti-cancer immunity and the expansion of Tregs was found to be an hindrance to successful tumor immunotherapy [10]. The clinicopatnological and prognostic value of Tregs in patients with NSCLC have been a long-standing topic of debate. Several studies have
suggested that tumor infiltrating Tregs could predict the
clinical outcomes in patients with NSCLC. Some of them
Clinicopathological and prognostic significance of regulatory
T cells in patients with non-small cell lung cancer: A systematic
review with meta-analysis
Sha Zhao1,*, Tao Jiang1,*, Limin Zhang1, Hui Yang1, Xiaozhen Liu1, Yijun Jia1,
Caicun Zhou1
1Department of Medical Oncology, Shanghai Pulmonary Hospital, Tongji University School of Medicine, Tongji University
Medical School Cancer Institute, Shanghai, China
*These authors contributed equally to this work
Correspondence to: Caicun Zhou , email: [email protected]
Keywords:regulatory T cells, Foxp3+, non-small cell lung cancer, prognosis, systematic review
Received: February 03, 2016 Accepted: April 11, 2016 Published: April 28, 2016
AbsTRACT
The prognostic and clinicopathological value of regulatory T cells (Tregs) infiltration in patients with non-small cell lung cancer (NSCLC) remains undetermined. A comprehensive literature search of electronic databases (up to December 2015) was conducted. Relationship between Tregs infiltration and clinicopathological features, recurrence-free survival (RFS) and overall survival (OS) was investigated by synthesizing the qualified data. A total of 1303 NSCLC patients from 11 studies were included. The pooled hazard ratio (HR) for survival showed that high Tregs infiltration had no effect on RFS (HR = 2.03, 95% CI: 0.61–3.44, P = 0.708) and OS (HR = 1.20, 95% CI: 0.58–1.62, P = 0.981). High FoxP3+ Tregs infiltration was significantly associated with poor OS in NSCLC (HR = 3.88, 95% CI: 2.45–5.40, P = 0.000). Test methods, ethnicity and types of specimens had no effect on predicting prognosis of Tregs infiltration. While high Tregs infiltration was significantly correlated with smoking status [odds ratios (ORs) = 1.54, 95% CI: 1.15–2.08; P = 0.004], none of other clinicopathological characteristics such as gender, histological type, lymph node metastasis status, tumor size, vascular invasion, lymphatic invasion and pleural invasion were associated with Tregs infiltration. The present study demonstrated that high FoxP3+ Tregs infiltration was significantly associated with poor prognosis in NSCLC and smoking status.
showed that high Tregs infiltration was associated with
poor prognosis [11, 12], while others revealed that high
Tregs infiltration was correlated with better prognosis
[13–15]. Moreover, there are some studies reported no
significant association between the presence of Tregs and patient survival [16]. Whether Tregs infiltration had
the prognostic potential in patients with NSCLC remains controversial.
The X-linked gene forkhead box P3 (FOXP3), encoding the transcription factor Foxp3, serves as a lineage
specification factor for the development and function of
CD4+CD25+ Tregs [17, 18]. To date, Foxp3 is considered
to be the most specific Tregs marker. Foxp3+ Tregs have
been shown to the essential suppressors of the anti-tumor responses by interfering with the release of cytolytic granule by cytotoxic T lymphocytes (CTLs) [19]. High tumor
infiltration of Foxp3+ Tregs is supposed to be correlated
with the poor outcomes. Indeed, this relationship has been demonstrated in a number of publications [13–15, 20]. However, a recent study showed that high Foxp3+ Tregs
infiltration was significantly associated with improved
survival in patients with NSCLC [12]. Whether Foxp3+
Tregs infiltration had the prognostic value in patients with NSCLC also remains conflicting.
Although there has been a meta-analysis on this topic, they analyzed the prognostic value of Foxp3+ Tregs in different types of cancer and only two publications referred to NSCLC [21]. There have been more than nine papers published since this meta-analysis was conducted. Moreover, it did not perform the subgroup analysis on NSCLC and the
relationship between Tregs infiltration and clinicopathological
features in patients with NSCLC. For these reasons, we conducted this meta-analysis to derive a more precise estimation of the clinicopathological and prognostic
significance of regulatory T cells in patients with NSCLC.
REsULTs
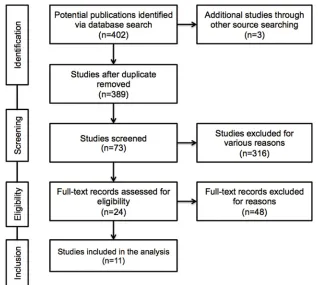
study selectionThe result of literature inclusion was showed in Figure 1. A total of 405 potentially relevant articles were found, and 11 studies were included in this analysis after screening [11–16, 20, 22–25]. Most of the excluded abstracts were
reviews, letters or studies with insufficient data.
Characteristics of the included studies
In the present analysis, a total of 1303 cases from 11
studies were met with our defined criteria and included. The
main features of each eligible study were extracted (Table 1). Most of the studies (9/11) dealt with patients with stage from I to III/IV of NSCLC, and the rest of the studies (2/11) were focused on the patients with early stage I. Eight studies reported that surgery was performed on patients and two study mentioned that no prior treatment was applied,
while only one had no relevant reports at all. The popular kinds of specimens included peripheral blood, regional
lymph nodes and paraffin-embedded surgical tissues. The most commonly used test methods for Tregs infiltration are immunohistochemistry (IHC) and flow cytometry
(FCM). Still, one study used the quantitative real time-polymerase chain reaction (qRT-PCR). Tregs markers refer to the different combinations of CD4+CD25+ and FoxP3+ or alone. One study had used the Helios+ as the specific marker of Tregs. The cutoff points of high Tregs infiltration
were heterogeneous and only two studies used the median number of Tregs as the cutoff point. Eight included studies indicated RFS and/or OS and clinicopathological details. Among the eleven studies, three of them reported neither OS nor DFS, but presented clinicopathological features.
The prognostic effect of Tregs on survival
Data of survival extracted from seven eligible studies were included in the meta-analysis. Since most of the included patients were with resection, patients with advanced stage in two studies were excluded when we performed the meta-analysis [22, 24]. Two of them reported
the relationship between high Tregs infiltration and RFS,
while six of them published the data of OS. Interestingly, meta-analysis found that the NSCLC patients with high
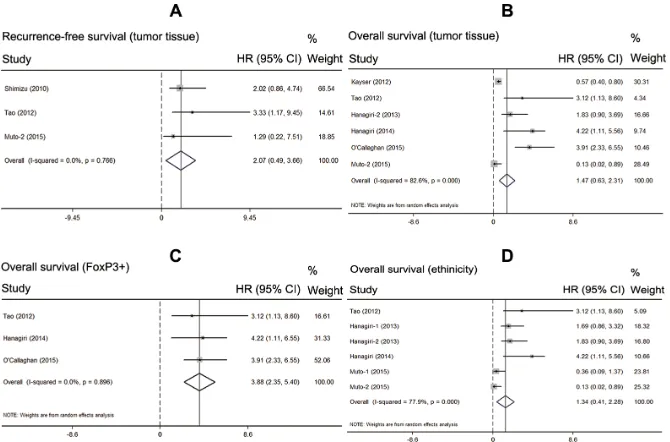
Tregs infiltration showed no superior RFS than those with low Tregs infiltration (HR = 2.03, 95% CI: 0.61–3.44, P = 0.708, fixed model) (Figure 2A). Also patients with high Tregs infiltration showed no superior OS than those with low Tregs infiltration (HR = 1.20, 95% CI: 0.58–1.62, P = 0.981, random model) (Figure 2B).
subgroup analysis of the prognostic effect of Tregs
Considering the high heterogeneity of pooled analysis on OS (I2 = 78.4%; P = 0.000), we performed the subgroup analysis of the prognostic effect of Tregs infiltration. Firstly, we analyzed the test method of Tregs infiltration and found no significant effect on OS (HR = 2.29, 95% CI:
0.33–4.90, P = 0.087). Then, we just included the studies used tumor tissues to test the Tregs infiltration. The pooled result showed that types of specimens had no significant
effect on RFS and OS (n = 251, HR = 2.07, 95% CI: 0.49– 3.66, P = 0.256; n = 869, HR = 1.47, 95% CI: 0.63–2.31,
P = 0.681; respectively) (Figure 3A–3B). After that, we
just included the studies used FoxP3+ as the markers of
Tregs. The pooled result indicated that high FoxP3+ Tregs infiltration was associated with significantly poorer OS in
patients with NSCLC (n = 415, HR = 3.88, 95% CI: 2.45– 5.40, P = 0.000). In addition the results showed no obvious
The relationship between Tregs infiltration and
clinicopathological features
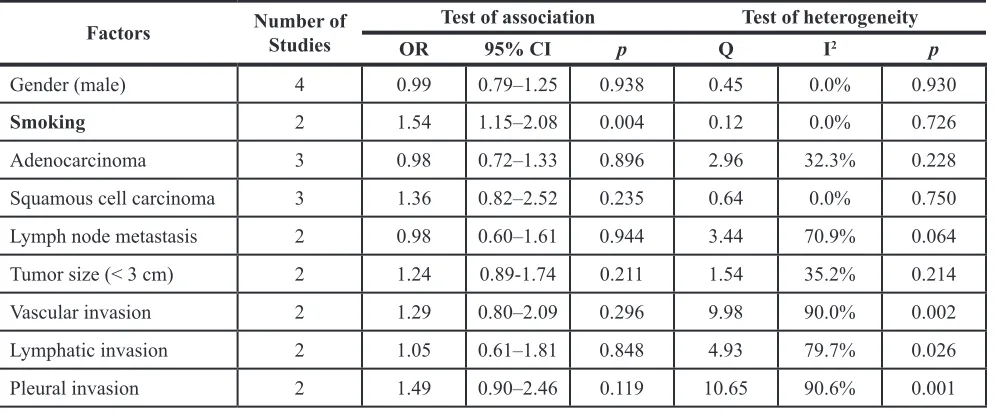
Four studies provided the information of various clinicopathological parameters and their correlation with
Tregs infiltration was summarized in Table 2. Three studies
had the statistical data on gender of patients. However, none of them reported the association between gender and high
Tregs infiltration. Likewise, three studies demonstrated that there was no correlation between high Tregs infiltration and
histology. In addition, Tao et al. showed that patients with smoking habits showed higher Tregs accumulation than non-smokers (P = 0.040). However, another two studies showed
that there is no relationship between smoking history and FoxP3+ Tregs infiltration. Hence, we performed the meta-analysis and found that smoking status was significantly
correlated with high FoxP3+ Tregs infiltration (OR = 1.54, 95% CI: 1.15–2.08; P = 0.004). Except for these
above-mentioned parameters, controversies also existed on the correlation among tumor size (< 3 cm), lymph node metastasis, vascular invasion, lymphatic invasion and pleural invasion. The results of meta-analysis demonstrated
that no correlation was found between the infiltration of
FoxP3+ Tregs and tumor size (OR = 1.24, 95%CI: 0.89–1.74; P = 0.211), lymph node metastasis (OR = 0.98, 95%CI:
0.60–1.61; P = 0.944), vascular invasion (OR = 1.29, 95%CI:
0.80–2.09; P = 0.296), lymphatic invasion (OR = 1.05, 95% CI: 0.61–1.81; P = 0.848) and pleural invasion (OR = 1.49, 95% CI: 0.90–2.46; P = 0.119) (Table 2).
DIsCUssION
Although a series of studies have discussed the prognostic value of Tregs in NSCLC, the results remains discordant. In the present article, the results indicated that when we ignored the different combinations of Tregs’ marker (including CD4+, CD25+ and Foxp3+), high
Tregs infiltration had no effect on RFS and OS in NSCLC.
However, when we just included studies used Foxp3+ alone or combined with CD4+ and CD25+ as the Tregs’
marker, we found that high Foxp3+ Tregs infiltration was significantly associated with OS in patients with NSCLC.
Our results are consistent with these observations from other investigators. Previous studies have reported that
NSCLC patients with high Foxp3+ Tregs infiltration
were not only at increased risk of disease relapse but also correlated with unfavorable outcome [13–15, 26]. These
studies confirm the prognostic value of Foxp3+ Tregs infiltration in patients with NSCLC.
Our study also found that high Foxp3+ Tregs
infiltration was significantly associated with smoking status,
and this correlation was in line with the studies that the increase in Tregs was related to smoking [13, 27, 28]. The mechanism of this phenomenon is not yet clear. One possible explanation revealed that cigarette smoking could promote the mobilization and accumulation of (MDSCs) and increase
the level of interferon-γ in TME [29]. Meanwhile, other
[image:3.612.147.465.417.702.2]studies demonstrated that MDSCs could induce Foxp3+ Tregs development and expansion via the production of
cytokines, such as IFN-γ, or direct cell-cell interactions
[30–32]. Taken together, we can hypothesize that cigarette
smoking can induce Foxp3+ Tregs infiltration via promoting
accumulation of MDSCs. Nevertheless, this hypothesis need
rigorously designed basic research to confirm.
Tregs are a heterogeneous population and consist of
at least two subsets: natural Tregs (nTregs) and induced
[image:4.612.60.556.67.593.2]or adaptive Tregs (iTregs) [33]. More and more evidences show that two Tregs types play the different roles in the anti-tumor immune response [18, 34]. The nTregs originate in the thymus and are thought to recognize self-antigens [35]. The iTregs develop from conventional naïve T cell precursors at extra-thymic sites and are considered to suppress the immune response [36]. Therefore, clear
Table 1: General characteristics of included studies
Author Year Country No. of Patients
speci
mens methods MarkersTest Cut- off
Treg Positive Expression
(%)
stage therapyPre- comesOut
Liu et al. 2006 China 61 PB FCM CD25+CD4+ < 3% 29.4 I–IV Not appli cable Overall survival
Shimizu
et al. 2010 Japan 100
Tumor tissues,
RLN IHC Foxp3+
> 3 in 10
HPFs 51.0 I–III Surgery
Recurrence-free survival
Erfani
et al. 2012 Iran 23 PB FCM
CD4+ CD25+ Foxp3+ Not appli cable Not
applicable II–IV No prior treatment Not appli cable
Kayser
et al. 2012 Germany 232 Tumor tissues IHC CD25+CD4+
> median
number 50.0 I–IV Surgery
Overall survival
Tao
et al. 2012 Japan 87 Tumor tissues IHC Foxp3+
> 25 in 10
HPFs 31.0 I–III Surgery
Recurrence-free survival, overall survival Hanagiri
et al. 2013 Japan 158 PB, RLN FCM
CD4+ CD25+ Foxp3+ > 0.5% of PBL, > 1.1% of RLNL Not
applicable I–III Surgery Overall survival
Kinoshita
et al. 2013 Japan 200 Tumor tissues IHC Foxp3+ > 6 in 1 HPFs 46.5 I Surgery
Recurrence-free survival, overall survival Hanagiri
et al. 2014 Japan 131
Tumor tissues,
PB, RLN qRT-PCR Foxp3+ 2
–ΔCT
> 0.06 25.2 I Surgery Overall survival
He et al. 2015 China 50 PB FCM CD25+CD4+ Not appli
cable
Not
applicable I–IV No prior treatment Overall survival O’
Callaghan
et al. 2015 Australia 197
Tumor tissues,
RLN IHC Foxp3+
> median
value* 43.9
I–
IIIA Surgery Overall survival
Muto
et al. 2015 Japan 64
Tumor tissues, PB IHC, FCM CD4+ Foxp3+ Helios-> median
number 50.0 I–IV
Surgery, chem therapy Recurrence-free survival, overall survival
PB: peripheral blood; RLN: regional lymph nodes; FCM: flow cytometry; IHC: immunohistochemistry; HPFs: high-power fields; qRT-PCR: quantitative real time-polymerase chain reaction.
Figure 2: Prognostic value of high Tregs infiltration in NSCLC. (A) meta-analysis of high Tregs infiltration and recurrence-free survival in NSCLC; (b) meta-analysis of high Tregs infiltration and overall survival in NSCLC.
[image:5.612.139.474.459.680.2]discrimination between these two Tregs types is important for assessing their value in predicting prognosis. In the included study, Muto et al. used the Helios, a member of the
Ikaros gene family, as a marker to distinguish iTregs from nTregs and found that Foxp3+Helios- Tregs could affect immune suppression, even in early stage NSCLC [12]. Moreover, their results suggested that patients with low
level of Helios in Tregs had significantly poorer survival (HR = 0.13, P = 0.04). However, recent studies indicated
that nTregs from iTregs are not distinguished only by Helios expression [37]. Other molecular markers should be given
fully consideration including epigenetic Tregs-specific demethylated region (TSDR) modifications and neuropilin
1 [38–40]. Despite of these studies, a determined marker for nTregs has not been found so far.
Recently, several studies aimed to improve the
therapeutic efficacy via depleting Tregs in patients with
cancer. Some researchers attempted to inhibit Tregs function by using anti-CD25 antibody and by suppressing the cytotoxic T lymphocyte antigen 4 (CTLA4) pathway, which is an important inhibitory signal for activated T cells [41], but the results were disappointed. The reason may include that these strategies could not only deplete Tregs but also affect activated effector T cells function [42]. Of note, a recent study revealed that tumor-induced Tregs could proliferate via vascular endothelial growth factor (VEGF)/ VEGF receptor (VEGFR) pathway in colorectal cancer [43]. VEGF/VEGFR pathway blockade did not eradicate all Tregs but simply restored their proportion to physiology levels. Therefore, it would be interesting to combine anti-angiogenic agents inhibiting VEGF/VEGFR pathway with other immunotherapeutic strategies [44, 45]. This approach would selectively suppress Tregs and avoid the depletion of effector T cells and minimize the occurrence of autoimmune mediated adverse effects correlated with a total of Treg depletion [43].
The present systematic review with meta-analysis has some limitations that should be acknowledged. Firstly, the number of the included studies was relatively small. Secondly, there may be some degree of publication bias
in this area of research. We identified several abstracts
describing articles that were not further detailed in standard publications. We have tried to contact authors of primary studies. However, we have not received any reply. Thirdly, there is clearly a multitude of confounding factors (test technique, specimen storage, laboratory condition and so
on) that make experiment comparisons difficult. Last but
not least, there is statistical heterogeneity among the studies
regarding the prognostic value of Tregs infiltration. Studies
may have differed with regard to the baseline characteristics of the patients included histological type, tumor size, disease stage, prior treatment and adjustments for other cofactors. Fortunately, we found that the heterogeneity may be due to the lack of standard test methods and evaluation criteria. In conclusion, the current study suggests that high
Foxp3+ Tregs infiltration may be a promising prognostic
factor to patients with NSCLC. High Foxp3+ Tregs
infiltration seems to correlate with smoking status instead
of gender, histological type, lymph node metastasis status, tumor size, vascular invasion, lymphatic invasion and pleural invasion. Depletion of Tregs is an attractive strategy
in future cancer treatment. In addition, the specific and
exclusive surface molecule of Tregs should be illustrated clearly before large-scale clinical studies being performed.
MATERIALs AND METHODs
Publication search strategyWe performed a comprehensive publication search
through the PubMed, EMBASE, Web of Science, and
[image:6.612.59.557.64.271.2]Cochrane library up to December 31, 2015, without
Table 2: Meta-analysis of the reported clinicopathological factors in the included studies
Factors Number of studies Test of association Test of heterogeneity
OR 95% CI p Q I2 p
Gender (male) 4 0.99 0.79–1.25 0.938 0.45 0.0% 0.930
smoking 2 1.54 1.15–2.08 0.004 0.12 0.0% 0.726
Adenocarcinoma 3 0.98 0.72–1.33 0.896 2.96 32.3% 0.228
Squamous cell carcinoma 3 1.36 0.82–2.52 0.235 0.64 0.0% 0.750
Lymph node metastasis 2 0.98 0.60–1.61 0.944 3.44 70.9% 0.064
Tumor size (< 3 cm) 2 1.24 0.89-1.74 0.211 1.54 35.2% 0.214
Vascular invasion 2 1.29 0.80–2.09 0.296 9.98 90.0% 0.002
Lymphatic invasion 2 1.05 0.61–1.81 0.848 4.93 79.7% 0.026
Pleural invasion 2 1.49 0.90–2.46 0.119 10.65 90.6% 0.001
language limitations. The following contextual query
language was used: (“lung cancer”) AND (“regulatory T cells” OR “Foxp3”) AND (“prognosis” OR “mortality” OR “survival”). Titles and abstracts were reviewed to identify
reports, which examined the association of Tregs expression with clinical outcomes, such as overall survival (OS), recurrence-free survival (RFS), disease free survival (DFS)
and clinicopathological features. Reference lists of identified
studies and reviews were also hand-searched. We have made any effort to contact authors of primary studies. This analysis was performed in accordance with Preferred Reporting
Items for Systematic Reviews and Meta-Analyses: the
PRISMA Statement [46].
Inclusion and exclusion criteria
The criteria for inclusion were listed as follows: studies must have (1) been published as original articles; (2) evaluated human subjects; (3) Tregs was detected on
tumor tissue or peripheral blood via testing the markers of CD4+CD25+, FoxP3+ or CD4+CD25+FoxP3+, rather than in the cell lines or any other kinds of specimens; (4) reported association of high and low Tregs infiltration with OS, DFS, or RFS; and (5) contained the minimum information
necessary to estimate the effects (i.e., hazard ratio) and a
corresponding measure of uncertainty (i.e., confidence
interval, P-values, standard errors or variance). As an additional criterion, when a single population was reported in multiple reports, only the report with the most complete data was included to avoid duplication. Studies were
excluded if they were: (1) reviews, case-only studies, or familial studies; (2) lacking sufficient data for calculation of incidence and/or HR with 95% confidence intervals (CIs);
and (3) duplication of previous publications or replicated samples. Two reviewers determined study eligibility independently. Disagreements were solved by consensus.
Data extraction
From each study, the following information was
extracted: first author’s name, year of publication, study population, Tregs infiltration assessment methods, cut-off definition, and incidence of high Tregs infiltration with 95%
CIs, HR for OS, and/or DFS with corresponding 95% CIs. If the HRs and CIs were not reported, the total observed death events and the numbers of patients in each group were extracted to calculate HR and its variance indirectly. In order to guarantee the accuracy of collected data, studies for which only Kaplan-Meier curves would not be included. When both univariate analysis and multivariate analysis were reported to get the HR, the results of multivariate analysis were selected. Two reviewers extracted the data independently, using a
predefined Excel form. Disagreements were resolved by
consensus after discussion. If they can’t get the consensus, the article would be excluded.
Quality assessment
Two reviewers assessed the study quality
independently by using the following factors: (1) distinct definition of the study population; (2) clear definition of the test method and the cut-off value of high Tregs infiltration; (3) sample size larger than ten and (4) clear definition of the
outcome assessment (if applicable). Studies lacking any of these criteria were excluded.
statistical analysis
Overall survival (OS) was measured from the date of surgery until the date of death from any cause or the date on which the patient was last known to be alive. The recurrence-free survival (RFS) time was measured as the interval between the date of surgery and the date of recurrence, the date of death from any cause, or the most recent date on which the patient was last known to be disease-free. For time-to-event data, the HRs with their 95% CIs were directly extracted from the research article or calculated using previously published methods proposed by
Tierney et al. [47]. The χ2 test was used to test for statistical
heterogeneity and the I2 statistic was used to assess the extent
of variability attributable to statistical heterogeneity across trials. P > 0.1 for the χ2 test and I2 < 25% were interpreted
as signifying low-level heterogeneity. When there was no
statistically significant heterogeneity, a pooled effect was calculated with a fixed-effects model; otherwise, a
random-effects model was used.
To investigate the source of heterogeneity,
predefined subgroup analyses were performed based on assessment method, cut-off definition, types of specimens
and markers of Tregs. Sensitivity analyses were performed to assess the stability of the results, namely, a
single study was deleted each time to reflect the influence
of the individual data set on the results. Furthermore, we explored performed subgroup analysis on the relationship
between high Tregs infiltration and clinicopathological
parameters.
Statistical analysis was performed by STATA v12.0 (Stata Corporation, TX) and Review Manager 5.0 software. All data were analyzed using the Statistical Package for Social Sciences (SPSS) software (version 20.0 for Windows). P < 0.05 was considered statistically significant
except for the Q-test.
ACKNOWLEDGMENTs
CONFLICTs OF INTEREsT
The authors have declared no conflicts of interest.
GRANT sUPPORT
This study was supported by grants from the National Natural Science Foundation of China (No. 81372392) and the key project of the Science and Technology Commission of Shanghai Municipality (No. 11JC1411301).
REFERENCEs
1. Jemal A, Bray F, Center MM, Ferlay J, Ward E, Forman D. Global cancer statistics. CA Cancer J Clin. 2011; 61:69–90. 2. Torre LA, Bray F, Siegel RL, Ferlay J, Lortet-Tieulent J,
Jemal A. Global cancer statistics, 2012. CA Cancer J Clin. 2015; 65:87–108.
3. Chen Z, Fillmore CM, Hammerman PS, Kim CF, Wong KK. Non-small-cell lung cancers: a heterogeneous set of diseases. Nat Rev Cancer. 2014; 14:535–46.
4. Herbst RS, Heymach JV, Lippman SM. Lung cancer. N Engl J Med. 2008; 359:1367–80.
5. Zochbauer-Muller S, Gazdar AF, Minna JD. Molecular pathogenesis of lung cancer. Annu Rev Physiol. 2002; 64:681–708.
6. Mittal V, El Rayes T, Narula N, McGraw TE, Altorki NK, Barcellos-Hoff MH. The Microenvironment of Lung Cancer and Therapeutic Implications. Adv Exp Med Biol. 2016; 890:75–110.
7. Liu R, Wei S, Chen J, Xu S. Mesenchymal stem cells in lung cancer tumor microenvironment: their biological properties, influence on tumor growth and therapeutic implications. Cancer Lett. 2014; 353:145–52.
8. Wood SL, Pernemalm M, Crosbie PA, Whetton AD. The role of the tumor-microenvironment in lung cancer-metastasis and its relationship to potential therapeutic targets. Cancer Treat Rev. 2014; 40:558–66.
9. Turley SJ, Cremasco V, Astarita JL. Immunological hallmarks of stromal cells in the tumour microenvironment. Nat Rev Immunol. 2015; 15:669–82.
10. Pardoll DM. The blockade of immune checkpoints in cancer immunotherapy. Nat Rev Cancer. 2012; 12:252–64. 11. Kayser G, Schulte-Uentrop L, Sienel W, Werner M, Fisch P,
Passlick B, Zur Hausen A, Stremmel C. Stromal CD4/CD25 positive T-cells are a strong and independent prognostic factor in non-small cell lung cancer patients, especially with adenocarcinomas. Lung Cancer. 2012; 76:445–51. 12. Muto S, Owada Y, Inoue T, Watanabe Y, Yamaura T,
Fukuhara M, Okabe N, Matsumura Y, Hasegawa T, Osugi J, Hoshino M, Higuchi M, Suzuki H, et al. Clinical significance of expanded Foxp3+ Helios- regulatory T cells in patients with non-small cell lung cancer. Int J Oncol. 2015; 47: 2082–90.
13. Tao H, Mimura Y, Aoe K, Kobayashi S, Yamamoto H, Matsuda E, Okabe K, Matsumoto T, Sugi K, Ueoka H. Prognostic potential of FOXP3 expression in non-small cell lung cancer cells combined with tumor-infiltrating regulatory T cells. Lung Cancer. 2012; 75:95–101.
14. Hanagiri T, Fukumoto M, Koyanagi Y, Furutani Y, Tanaka F. Regulatory T-cells and micrometastasis in lymph nodes of stage I NSCLC. Anticancer Res. 2014; 34:7185–90. 15. O’Callaghan DS, Rexhepaj E, Gately K, Coate L, Delaney D,
O’Donnell DM, Kay E, O’Connell F, Gallagher WM, O’Byrne KJ. Tumour islet Foxp3+ T-cell infiltration predicts poor outcome in nonsmall cell lung cancer. Eur Respir J. 2015; 46:1762–72.
16. Hanagiri T, Shigematsu Y, Shinohara S, Takenaka M, Oka S, Chikaishi Y, Nagata Y, Iwata T, Uramoto H, So T, Tanaka F. Clinical significance of the frequency of regulatory T cells in regional lymph node lymphocytes as a prognostic factor for non-small-cell lung cancer. Lung Cancer. 2013; 81:475–9. 17. Fontenot JD, Gavin MA, Rudensky AY. Foxp3 programs
the development and function of CD4+CD25+ regulatory T cells. Nat Immunol. 2003; 4:330–6.
18. von Boehmer H, Daniel C. Therapeutic opportunities for manipulating T(Reg) cells in autoimmunity and cancer. Nat Rev Drug Discov. 2013; 12:51–63.
19. Mempel TR, Pittet MJ, Khazaie K, Weninger W, Weissleder R, von Boehmer H, von Andrian UH. Regulatory T cells reversibly suppress cytotoxic T cell function independent of effector differentiation. Immunity. 2006; 25:129–41. 20. Kinoshita T, Ishii G, Hiraoka N, Hirayama S, Yamauchi C,
Aokage K, Hishida T, Yoshida J, Nagai K, Ochiai A. Forkhead box P3 regulatory T cells coexisting with cancer associated fibroblasts are correlated with a poor outcome in lung adenocarcinoma. Cancer Sci. 2013; 104:409–15. 21. Shang B, Liu Y, Jiang SJ, Liu Y. Prognostic value of
tumor-infiltrating FoxP3+ regulatory T cells in cancers: a systematic review and meta-analysis. Sci Rep. 2015; 5:15179.
22. Liu L, Yao J, Ding Q, Huang S. CD4+CD25high regulatory cells in peripheral blood of NSCLC patients. J Huazhong Univ Sci Technolog Med Sci. 2006; 26:548–51.
23. Shimizu K, Nakata M, Hirami Y, Yukawa T, Maeda A, Tanemoto K. Tumor-infiltrating Foxp3+ regulatory T cells are correlated with cyclooxygenase-2 expression and are associated with recurrence in resected non-small cell lung cancer. J Thorac Oncol. 2010; 5:585–90.
24. Erfani N, Mehrabadi SM, Ghayumi MA, Haghshenas MR, Mojtahedi Z, Ghaderi A, Amani D. Increase of regulatory T cells in metastatic stage and CTLA-4 over expression in lymphocytes of patients with non-small cell lung cancer (NSCLC). Lung Cancer. 2012; 77:306–11.
25. He LY, Li L, Guo ML, Zhang Y, Zhang HZ. Relationship between CD4+CD25+ Treg and expression of HIF-1alpha and Ki-67 in NSCLC patients. Eur Rev Med Pharmacol Sci. 2015; 19:1351–5.
regulatory T-cells are associated with recurrence in pathologic stage I NSCLC patients. Cancer. 2006; 107:2866–72. 27. Barcelo B, Pons J, Ferrer JM, Sauleda J, Fuster A, Agusti AG.
Phenotypic characterisation of T-lymphocytes in COPD: abnormal CD4+CD25+ regulatory T-lymphocyte response to tobacco smoking. Eur Respir J. 2008; 31:555–62. 28. Granville CA, Memmott RM, Balogh A, Mariotti J, Kawabata S,
Han W, Lopiccolo J, Foley J, Liewehr DJ, Steinberg SM, Fowler DH, Hollander MC, Dennis PA. A central role for Foxp3+ regulatory T cells in K-Ras-driven lung tumorigenesis. PLoS One. 2009; 4:e5061.
29. Kumar S, Torres MP, Kaur S, Rachagani S, Joshi S, Johansson SL, Momi N, Baine MJ, Gilling CE, Smith LM, Wyatt TA, Jain M, Joshi SS, et al. Smoking accelerates pancreatic cancer progression by promoting differentiation of MDSCs and inducing HB-EGF expression in macrophages. Oncogene. 2015; 34:2052–60.
30. Yang R, Cai Z, Zhang Y, Yutzy WHt, Roby KF, Roden RB. CD80 in immune suppression by mouse ovarian carcinoma-associated Gr-1+CD11b+ myeloid cells. Cancer Res. 2006; 66:6807–15.
31. Huang B, Pan PY, Li Q, Sato AI, Levy DE, Bromberg J, Divino CM, Chen SH. Gr-1+CD115+ immature myeloid suppressor cells mediate the development of tumor-induced T regulatory cells and T-cell anergy in tumor-bearing host. Cancer Res. 2006; 66:1123–31.
32. Gabrilovich DI, Nagaraj S. Myeloid-derived suppressor cells as regulators of the immune system. Nat Rev Immunol. 2009; 9:162–74.
33. Curotto de Lafaille MA, Lafaille JJ. Natural and adaptive foxp3+ regulatory T cells: more of the same or a division of labor? Immunity. 2009; 30:626–35.
34. Josefowicz SZ, Lu LF, Rudensky AY. Regulatory T cells: mechanisms of differentiation and function. Annu Rev Immunol. 2012; 30:531–64.
35. Apostolou I, Sarukhan A, Klein L, von Boehmer H. Origin of regulatory T cells with known specificity for antigen. Nat Immunol. 2002; 3:756–63.
36. Bilate AM, Lafaille JJ. Induced CD4+Foxp3+ regulatory T cells in immune tolerance. Annu Rev Immunol. 2012; 30:733–58.
37. Zabransky DJ, Nirschl CJ, Durham NM, Park BV, Ceccato CM, Bruno TC, Tam AJ, Getnet D, Drake CG. Phenotypic and functional properties of Helios+ regulatory T cells. PLoS One. 2012; 7:e34547.
38. Kim YC, Bhairavabhotla R, Yoon J, Golding A, Thornton AM, Tran DQ, Shevach EM. Oligodeoxynucleotides stabilize Helios-expressing Foxp3+ human T regulatory cells during in vitro expansion. Blood. 2012; 119:2810–8.
39. Weiss JM, Bilate AM, Gobert M, Ding Y, Curotto de Lafaille MA, Parkhurst CN, Xiong H, Dolpady J, Frey AB, Ruocco MG, Yang Y, Floess S, Huehn J, et al. Neuropilin 1 is expressed on thymus-derived natural regulatory T cells, but not mucosa-generated induced Foxp3+ T reg cells. J Exp Med. 2012; 209:1723–42, S1.
40. Yadav M, Louvet C, Davini D, Gardner JM, Martinez-Llordella M, Bailey-Bucktrout S, Anthony BA, Sverdrup FM, Head R, Kuster DJ, Ruminski P, Weiss D, Von Schack D, et al. Neuropilin-1 distinguishes natural and inducible regulatory T cells among regulatory T cell subsets in vivo. J Exp Med. 2012; 209:1713–22, S1–19.
41. Buchbinder E, Hodi FS. Cytotoxic T lymphocyte antigen-4 and immune checkpoint blockade. J Clin Invest. 2015; 125:3377–83.
42. Mougiakakos D, Choudhury A, Lladser A, Kiessling R, Johansson CC. Regulatory T cells in cancer. Adv Cancer Res. 2010; 107:57–117.
43. Terme M, Pernot S, Marcheteau E, Sandoval F, Benhamouda N, Colussi O, Dubreuil O, Carpentier AF, Tartour E, Taieb J. VEGFA-VEGFR pathway blockade inhibits tumor-induced regulatory T-cell proliferation in colorectal cancer. Cancer Res. 2013; 73:539–49.
44. Yasuda S, Sho M, Yamato I, Yoshiji H, Wakatsuki K, Nishiwada S, Yagita H, Nakajima Y. Simultaneous blockade of programmed death 1 and vascular endothelial growth factor receptor 2 (VEGFR2) induces synergistic anti-tumour effect in vivo. Clin Exp Immunol. 2013; 172:500–6. 45. Liu XD, Hoang A, Zhou L, Kalra S, Yetil A, Sun M, Ding Z,
Zhang X, Bai S, German P, Tamboli P, Rao P, Karam JA, et al. Resistance to Antiangiogenic Therapy Is Associated with an Immunosuppressive Tumor Microenvironment in Metastatic Renal Cell Carcinoma. Cancer Immunol Res. 2015; 3:1017–29.
46. Liberati A, Altman DG, Tetzlaff J, Mulrow C, Gotzsche PC, Ioannidis JP, Clarke M, Devereaux PJ, Kleijnen J, Moher D. The PRISMA statement for reporting systematic reviews and meta-analyses of studies that evaluate health care interventions: explanation and elaboration. Ann Intern Med. 2009; 151:W65–94.