ORIGINAL RESEARCH
Dynamic CT Perfusion Imaging in Subarachnoid
Hemorrhage–Related Vasospasm
A.M. Laslo J.D. Eastwood F.-X. Chen T.-Y. Lee
BACKGROUND AND PURPOSE:Nimodipine is a therapy that reduces morbidity and mortality in patients with subarachnoid hemorrhage (SAH), though the mechanisms by which it does so are not well understood. In a rabbit model of SAH, we studied the effects of nimodipine by using functional CT imaging. We hypothesized that the nimodipine treatment group would have (1) increased mean basilar artery diameter, (2) less diminished cerebral blood flow (CBF) following vasospasm, and (3) better neurologic outcomes.
METHODS: SAH was induced in 26 New Zealand White rabbits randomized to 2 groups: treated (nimodipine) or control (no treatment). CT perfusion and CT angiography were used to measure CBF and basilar artery diameter at baseline, 10, 30, and 60 minutes after SAH, and on days 3, 5, 7, 9, and 16. Neurologic assessments were performed on each day of scanning.
RESULTS: Basilar artery diameter in the treated group was greater than in the control group post-SAH (P⬍.05). When vasospasm was⬎15%, CBF in the nimodipine group was significantly greater than in the control group in the brain stem, cerebellum, parieto-occipital cerebrum, and deep gray matter (P⬍.05). Neurologic scores in the nimodipine group were significantly better than in the control group on days 5 and 9 (P⬍.05).
CONCLUSION:Animals treated with nimodipine showed (1) increased mean basilar artery diameter, (2) improved neurologic outcome, and (3) increased mean CBF despite no significant difference in the incidence and severity of delayed vasospasm. These data provide a basis for future studies comparing the efficacy of new treatments for SAH to that of nimodipine.
S
ubarachnoid hemorrhage (SAH) due to aneurysm rupture is a debilitating condition with serious sequelae. Approx-imately 70% of patients with SAH will die or remain severely disabled.1Currently, there are few effective therapies availableto improve the poor clinical outcomes associated with SAH. Delayed ischemic deficits (DIDs) arising within the first 2 weeks of hemorrhage contribute significantly to the high rate of morbidity and mortality associated with SAH.2Vasospasm
and subsequent cerebral ischemia have been identified as ma-jor causes of DIDs and deteriorating neurologic status during this time.3-6
In many institutions, nimodipine is used to help prevent ischemic deficits in patients with SAH.7Nimodipine is a
cal-cium-channel blocker that, along with medically induced hy-pertension, hemodilution, and hypervolemia, has been shown to improve outcomes in SAH patients significantly.8-10
De-spite these encouraging results, in some patients with SAH, nimodipine has been ineffective in preventing or minimizing DIDs.9,11
Inconsistencies in clinical outcome following nimodipine treatment may be because the mechanisms by which nimodip-ine produces its clinical benefits have yet to be identified. Ma-jor hypotheses suggest that nimodipine increases cerebral blood flow (CBF), functions as a neuroprotective agent, or
works as some combination of both.12,13It has also been
sug-gested that nimodipine may increase the diameter of large ce-rebral vessels affected by vasospasm.8Nimodipine, however,
might not act through a single mechanism; rather, it may pro-duce a clinical effect through a comprehensive relationship between several variables. In this regard, further studies of nimodipine use in SAH are needed to optimize care and to elucidate therapeutic pathways likely to yield improved pa-tient outcomes.14
As new therapies become available for the treatment of DIDs associated with SAH, it will be necessary to develop a method to assess the need for, and the response to, therapy. Recent developments in CT technology offer investigators ac-cess to a rapid method of measuring both vessel diameter and tissue blood flow. CT perfusion (CTP) imaging is a widely available and simple way to measure CBF in patients with SAH.15 Likewise, CT angiography (CTA) has been used to identify cerebral vasospasm subsequent to SAH.16CTP and
CTA have the potential to identify the effects of new treat-ments for SAH when used in combination with, or when com-pared with nimodipine.
The purpose of this study was to determine the effects of nimodipine on vessel diameter, CBF, and neurologic function in a rabbit model of SAH-related vasospasm. We hypothesized that the nimodipine-treated group would have (1) greater basilar artery diameter than the control group, (2) less-dimin-ished CBF than the control group, and (3) better neurologic outcome than the control group.
Methods
Induction of Experimental SAH
Ethical approval was obtained from the (Canadian) Council on Ani-mal Care and the AniAni-mal Use Subcommittee at the University of
Received May 20, 2005; accepted after revision August 10.
From the Department of Medical Biophysics, University of Western Ontario (A.M.L., F.-X.C., T.-Y.L.), Imaging Research Laboratories, Robarts Research Institute (A.M.L., F.-X.C., T.-Y.L.), and Imaging Division, Lawson Health Research Institute (A.M.L., F.-X.C., T.-Y.L.), London, Ontario, Canada; and the Department of Radiology, Duke University Medical Center (J.D.E.), Durham, NC.
Grant support: American Society of Neuroradiology—Foundation Scholar Award (to J.D.E.) and Canadian Institutes of Health Research, Ontario Research and Development Challenge Fund (BRAIN consortium).
Western Ontario. Anesthesia was induced in specific pathogen–free New Zealand White (NZW) rabbits (weight range, 2.5–3.5 kg; mean weight, 3.04⫾0.36 kg) by using 4% isoflurane; an intravenous injec-tion of ketamine/diazepam (valium) mixture (3 mg/kg and 0.3 mg/kg, respectively) was used for intubation. Animals were mechanically ventilated and maintained on 2% isoflurane with vecuronium bro-mide (0.15 mg/kg). End-tidal CO2was maintained between 35 and 45
mm Hg and temperature was maintained between 38° and 40°C with a circulating water blanket. Mean arterial pressure (MAP), arterial partial pressure of carbon dioxide (pCO2), arterial partial pressure of
oxygen (pO2), and pH were continuously monitored throughout the
procedure.
Animals were placed in a prone position on a custom device with their heads secured at a downward angle of 30°. SAH was induced by injecting a single bolus of autologous arterial blood into the cisterna magna.17In brief, the occipital protuberance was used as a palpable
landmark to identify the injection site. By using an aseptic technique, a 23-gauge needle attached to a butterfly catheter was inserted through the skin inferior to the occipital protuberance. When the needle passed into the cisterna magna, slight negative pressure was applied with a 3-mL syringe until clear CSF was observed in the cath-eter line. As much as 1.5 mL of CSF was withdrawn into the syringe to minimize the effect of volume change during subsequent injection of autologous blood. With the needle still in place, the syringe contain-ing the CSF was replaced with another syrcontain-inge containcontain-ing autologous arterial blood taken from the central ear artery. During a 3–5-minute interval, 1.5 mL/kg of blood was injected into the subarachnoid space. The 30° downward tilt of the head, because of gravity, facilitated the formation of a clot around the basilar artery. Unenhanced axial CT images collected immediately following induction of the SAH were used to verify the presence of hyperattenuated blood in the basilar cistern.
Nimodipine Administration
Animals were randomized to a control group (12) or nimodipine-treated group (14). All animals in the treatment group received 2.5 mg/kg of nimodipine (Nimotop) by subcutaneous injection. The first dose was given 1 hour after successful induction of SAH, and there-after every 24 hours for the duration of the study, to keep plasma concentrations of nimodipine about the target therapeutic level of 7 ng/mL.18The concentration of nimodipine in the plasma samples was
determined with high performance liquid chromatography (HPLC) analysis.18
CT Imaging
All imaging was performed by using a LightSpeed Plus 4 section clin-ical CT scanner (General Electric HealthCare). Baseline CTA and CTP scanning were performed before SAH induction on day 0. Acute vasospasm (day 0, following SAH) was assessed with CTA scans at 10, 30, and 60 minutes subsequent to the induction of SAH. Develop-ment of acute vasospasm confirmed adequate clot formation, thereby ensuring that animals in both treated and untreated groups experi-enced a similar degree of acute injury. One CTP scan was performed 45 minutes following SAH to determine the acute CBF response.
Delayed vasospasm was assessed with a CTA and CTP scan on days 3, 5, 7, 9, and 16 after induction of SAH. A scout image was used to verify the general position of the head, and axial images were col-lected to determine the precise locations for CTA and CTP imaging. Nonionic iodinated contrast agent (Omnipaque, 300 mg/mL) was used for both CTA and CTP imaging.
CTA
Two consecutive helical scans through the posterior fossa were per-formed. The first set of images collected were noncontrast enhanced (NECT). A second, contrast-enhanced scan (ECT) was performed to acquire images at the same section locations as the nonenhanced im-ages while contrast was injected through a catheter in the femoral vein (0.5 mL/s). Section locations were chosen such that the first section was inferior to the vertebrobasilar junction and the last section was superior to the terminal bifurcation of the basilar artery into the pos-terior cerebral arteries. Image acquisition parameters were as follows: 120 kVp and 60 mA; 512⫻512 image matrix; 12-cm field of view. Because the couch moved through the gantry at a rate of 3.75 mm/s, approximately 70 images were collected with a section thickness of 2.5 mm. Images were overlapped by 2 mm to give a resultant image in-terval of 0.5 mm in thezaxis.
CTP
A 2-cm slab of tissue from the level of the pons to the parieto-occipital cerebrum that included the brain stem, cerebellum, deep gray matter, and parieto-occipital cerebrum was selected and scanned. A total of 99 images were collected during a 25.5-second period at each of 4 5-mm section locations within the slab while the couch remained stationary. The images were acquired at 120 kVp and 60 mA, 512⫻ 512 image matrix, 12-cm field of view, 1 second per rotation, and a section thickness of 5 mm. Contrast was injected at a rate of 1 mL/s through the femoral vein catheter at the beginning of the 25.5 seconds scan duration.
Neurologic Scoring
A single trained observer blinded to the study design performed all neurologic assessments. The initial assessment was completed be-tween 6 and 12 hours after the SAH (day 0); subsequent assessments were completed on the following days: days 2–3; days 4 –5; day 7; day 9; and day 16. For assessments obtained on scanning days, scoring was performed either before or at least 6 hours after anesthesia. The neu-rologic scale used for the assessments was based on previous work with NZW rabbits.19,20In brief, clinical observations (spontaneous
behavior, reaction to handling, posture, gait, limb hypertonia, right-ing reflexes, and feedright-ing behavior) were each given a score: 0 (absent); 1 (mild); 2 (moderate); or 3 (severely impaired). Similarly, front and back reflexes were scored: 0 (normal); 1 (brisk); 2 (spreading); or 3 (clonus). Nystagmus was also observed: 0 (absent) or 1 (present). An overall score was calculated as the sum of the individual observations; a greater score denotes more significant neurologic impairment, and a lower score denotes a lesser degree of neurologic impairment.
Data Analysis
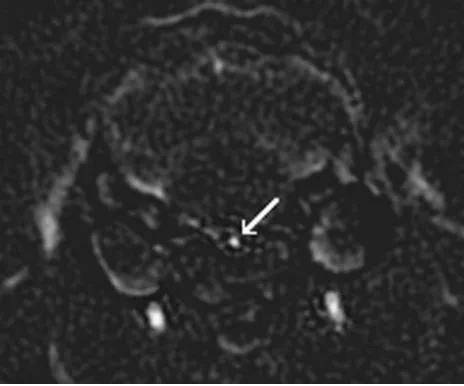
CTA.ECT images were subtracted from NECT images to create a set of digitally subtracted CTA images. In the subtracted CT angio-graphic images, any structures common to both the ECT and NECT images, such as bone and soft tissue, were eliminated, thus allowing the contrast enhanced basilar artery to be clearly identified (Fig 1). Adequate coverage of the basilar artery was ensured by choosing 3 individual segments for analysis: proximal, middle, and distal. Each segment contained 5 cross-sections. By using software developed in our lab (IDL version 5.6, Research Systems Inc.), vertical and hori-zontal measurements were obtained from each of the 5 sections within each segment.
Horizontal (right-left direction) and vertical (anteroposterior di-rection) measurements were then averaged together to obtain a single
BRAIN
ORIGINAL
measurement of basilar artery diameter for each of the 5 sections contained within the selected proximal, middle, and distal artery seg-ments. To determine the inner diameter of the basilar artery at each location, measurement units were converted from pixels to millime-ters by using an equation derived from phantom experiments previ-ously carried out in our lab (authors’ unpublished data). For each individual segment, measurements from the 5 sections were averaged to provide one distal, one middle, and one proximal measurement of the inner diameter of the basilar artery.
The segment (proximal, middle, or distal) showing the greatest degree of arterial narrowing was identified on the basilar artery to ensure that focal vasospasm (arterial narrowing in only one segment) was measured as well as diffuse vasospasm (arterial narrowing in more than one segment). For each animal, we defined maximum acute vasospasm as the greatest degree of basilar artery narrowing occurring after SAH on day 0. Similarly, we defined maximum de-layed vasospasm as the greatest degree of basilar artery narrowing in any one of the 3 segments occurring on post-SAH day 3, 5, 7, 9, or 16. For consistency, the segment (proximal, middle, or distal) in which the greatest degree of maximum delayed vasospasm occurred pro-vided the measurements at all other time points for that individual animal.
Degree of vasospasm was defined as the percent decrease in basilar artery diameter from baseline diameter. We defined 3 categories of vasospasm severity: (1) minimal (vasospasm⬍15%); (2) moderate (vasospasm 15%–30%); and (3) severe (vasospasm⬎30%).
CTP.CBF functional maps were calculated by using CTP software (version 2.6.2, GEHC). Arterial concentration curves were obtained from a 2⫻2 pixel region of interest positioned centrally within the internal carotid artery (ICA). Of the 4 sections in each cine scan, the section containing the ICA with the earliest arrival of contrast was used as the arterial input. To correct for partial volume averaging, a 2⫻2 pixel region of interest was placed on the vessel with the greatest concentration of contrast (the greatest difference between peak atten-uation and baseline attenatten-uation on the vessel time-attenatten-uation curve), which was, in all cases, either the superior sagittal sinus or the ICA. A deconvolution between the arterial input curve and the tissue curve provided the brain tissue CBF in 2⫻2 pixel square regions of interest.
By using software developed in our laboratory (IDL version 5.6), regions of interest were hand drawn around the brain regions (brain stem; cerebellum; deep gray matter; parieto-occipital cerebrum) on functional maps of cerebral blood volume (CBV), which were calcu-lated at the same time as the CBF maps. The regions of interest were automatically positioned onto the corresponding blow flow maps to obtain measurements of CBF (Fig 2). This sequence of drawing re-gions of interest on CBV maps before positioning them on CBF maps was chosen to limit the effects of large blood vessels on CBF measure-ments by applying vascular pixel elimination to first exclude regions with CBV⬎8.0 mL/100 g and then regions with CBF⬎250 mL/100 g/min.21
CBF was measured in each region at each time point. Mean CBF values at each time were determined by calculating the average of the individual CBF measurements made in each region.
Statistical Analysis
Statistical operations were performed by using the SPSS Statistics software package for Windows (version 12.0.1; SPSS Inc., Chicago, Ill). Repeated-measures analysis of variance was used as an omnibus test to identify significant main effects and interactions between the treatment and control group for data collected with CTP and CTA, as well as arterial blood gas parameters and neurologic scores. For the post hoc analyses of the effect of time, pairedttests were used in both the treated and control group. Independentttests were used to verify differences in parameters between animals in the control group and animals that received nimodipine. Differences in the severity and in-cidence of maximum vasospasm, as well as mortality rate, were ana-lyzed by using the Fisher exact test. Differences were considered sig-nificant atP⬍.05.
Results
Mortality
Five of 12 (42%) of animals in the control group died or were euthanized within 48 hours of SAH induction compared with 6/14 (43%) of animals in the nimodipine group; this differ-ence was not significant (P⬎.05, Fisher exact test). The re-maining animals in both groups (8 in the nimodipine group and 7 in the control group) survived the duration of the 16-day experiment.
Arterial Blood Gas
There were no differences between the nimodipine and con-trol groups in mean arterial pH, pCO2or pO2at any point in
time during or following induction of SAH. At 10, 30, and 60 minutes after SAH, arterial pH decreased significantly from baseline in both the nimodipine and control groups (P⬍.05), though arterial pH remained within normal range (7.35–7.45).
Plasma Nimodipine Concentration
In 5 of the nimodipine-treated animals, blood samples were taken throughout the study to measure nimodipine concen-trations in the blood. On the day of sampling, blood samples (1.5 mL) were drawn 22.3⫾3.5 hours after the previous ni-modipine dose was given to measure trough concentrations. The mean trough concentration of nimodipine was 10.6⫾4.2 ng/mL.
[image:3.585.54.286.43.236.2]Neurologic Assessments
[image:4.585.57.533.42.281.2]Average neurologic scores for each group are shown in the Table. Repeated measures analysis indicated significant effects of time (P⬍.05) and treatment (P⬍.05) on neurologic score. The neurologic scores obtained on day 0, 6 –12 hours after the SAH procedure and recovery from anesthesia, were not signif-icantly different between the control and nimodipine-treated group (P⬍.05). In the nimodipine group, scores were signif-icantly lower than day 0 scores on each follow-up day (P⬍ .05). Scores for the nimodipine group were significantly lower (less neurologic deficit) than in the control group on day 5 and day 9 (P⬍.05).
CTA
Acute Vasospasm.The treated and control group exhib-ited similar changes in basilar artery diameter in the acute stage of SAH, before nimodipine treatment; there were no significant differences in basilar artery diameter between the 2 groups at baseline, 10, 30, or 60 minutes after SAH (P⬎.05). The severity of acute vasospasm seen within 1 hour of SAH induction was similar between the control group and the ni-modipine group before treatment. In the nini-modipine group, maximum acute vasospasm was 28⫾18.1%, which was not significantly different from that of the control group, where maximum acute vasospasm was 33⫾22.4% (P⬎.05).
Basilar artery diameter was significantly less than baseline measurements in both groups at 10, 30, and 60 minutes (P
⬍.05). There was no significant correlation between the se-verity of acute vasospasm and mortality within each group (P
⬎.05).
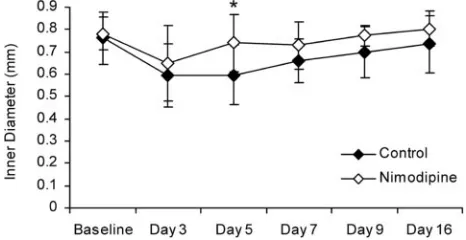
Delayed Vasospasm.Overall, there was a significant differ-ence in basilar artery diameter between animals in the nimo-dipine group and control animals (P⬍.05). Specifically, basi-lar artery diameter in the nimodipine group was significantly greater than in the control group on day 5 (P⬍.05; Fig 3).
There was a significant overall effect of time in both the nimodipine and the control group. Basilar artery diameter was significantly smaller than baseline on days 3, 5, and 7 in the control group (P⬍.05). In the nimodipine treated group, basilar artery diameter was significantly smaller than baseline on day 3 only (P⬍.05).
Maximum delayed vasospasm in the nimodipine group (20⫾6.6%) was less than in the control group (28⫾16.6%), though this difference was not statistically significant (P
⬍.05). In the nimodipine group, 5/8 animals had moderate vasospasm and 3/8 had minimal vasospasm. In the control group, 2/7 had severe vasospasm, 2/7 had moderate vaso-spasm, and 3/7 had minimal vasospasm. The incidence of an-imals that experienced either moderate or severe delayed va-sospasm was not different between groups (P⬎.05, Fisher exact test).
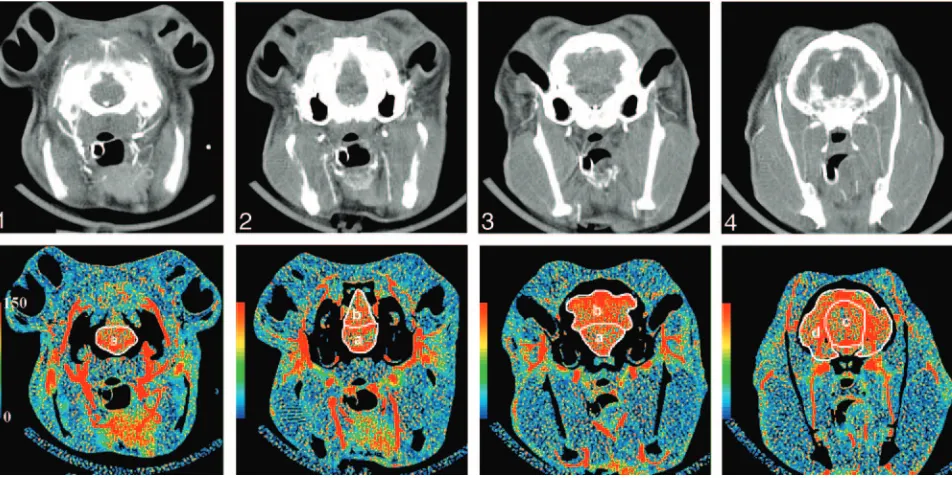
CTP.Time and region were identified as significant within-subjects factors in the repeated measures analysis (P⬍.05). Mean baseline CBF values did not differ in any region between the nimodipine and control groups: 63⫾10.4 mL/min/100 g versus 61⫾12.2 mL/min/100 g respectively (P⬎.05). In all regions (brain stem, cerebellum, deep gray matter, and parie-to-occipital cerebrum), there was a significant decrease in CBF 45 minutes after SAH in both groups (P⬍.05). The mean CBF value for all regions at 45 minutes was significantly lower than Fig 2.Top row,Images from a coronally oriented cine CT scan of the rabbit brain from the level of the pons (section 1) to the parieto-occipital cerebrum (section 4).Bottom row,CTP CBF maps corresponding to the CT images. Regions of interest (white) outline the regions in which CBF is quantified in ml/100 g/min.A,brain stem;B,cerebellum;C,deep gray matter; D,parieto-occipital cerebrum.
Neurological scores
Control Nimodipine
Day 0 15⫾4.3 12⫾6.2
Day 3 11⫾2.4 9⫾4.8
Day 5* 9⫾2.8 5⫾2.3
Day 7 6⫾2.4 5⫾2.7
Day 9* 6⫾0.6 3⫾1.7
Day 16 5⫾2.5 3⫾2.6
[image:4.585.53.284.327.416.2]baseline values in both the nimodipine (52⫾11.3 mL/100 g/min) and control (44 ⫾ 11.0 mL/100 g/min) groups (P⬍.05).
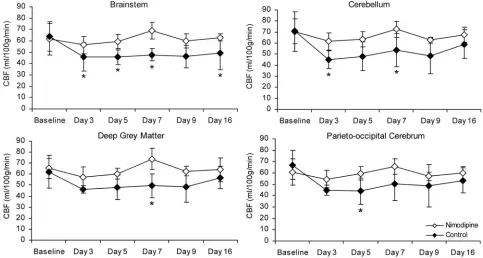
In animals with either moderate or severe maximum de-layed vasospasm, mean CBF values were significantly higher in the nimodipine-treated group than in the control group (P
⬍.05; Fig 4). In particular, mean CBF values were greater in the nimodipine-treated group in the brain stem (days 3, 5, 7, and 16), cerebellum (days 3 and 7), parieto-occipital cerebrum (day 5), and deep gray matter (day 7) (P⬍.05). In animals with either minimal vasospasm or no vasospasm, there was no difference in mean CBF value between treated and untreated groups (P⬎.05).
Discussion
In this rabbit model of SAH, we observed acute and delayed vasospasm and changes in CBF by using CTA and CTP imag-ing. Furthermore, with this CT imaging protocol, we were able to quantify the effect of nimodipine on both delayed vaso-spasm and CBF after SAH. Our results showed that nimodip-ine treatment shortened the duration of delayed basilar artery vasospasm, increased CBF in animals with delayed angio-graphic vasospasm, and improved neurologic condition, vali-dating our 3 study hypotheses.
Cerebral vasospasm and ischemia are 2 important interre-lated factors that lead to the development of DIDs in SAH patients.2The time course and pathophysiology of vasospasm
have been extensively studied in animal models and clinical studies.6,22-25Delayed angiographic vasospasm occurs in
ap-proximately 70% of patients with SAH and reaches peak se-verity approximately 4 –10 days after SAH26; evidence of
de-layed vasospasm has also been shown in several animal models of SAH.17,27-29Acute and delayed reductions in CBF have been
shown to occur in patients with SAH; however, patterns of CBF changes after SAH appear to be more heterogeneous and do not necessarily correlate with vasospasm or neurologic out-come in patients.30,31Results from previous studies of human
subjects show that CBF may decrease,26exhibit no change,32 or increase because of a hyperemic response after SAH.30In
addition, there are conflicting reports of the correlation be-tween angiographic vasospasm and neurologic outcome.8,33,34
Still, the presence and severity of cerebral vasospasm and isch-emia remain important prognostic factors that influence treatment decisions after SAH.35
Nimodipine therapy is part of the standard treatment for
SAH patients in most centers.7The rationale for use of nimo-dipine as a treatment for SAH-related vasospasm was based on the hypothesis that it would block calcium channels in arterial smooth muscle, thereby reducing the incidence and severity of arterial narrowing and the resulting DIDs subsequent to SAH.36Despite this rationale, evidence from studies in
ani-mals and humans does not consistently show that angio-graphic vasospasm is reduced with nimodipine treatment. Notwithstanding the lack of clear effect on angiographic vaso-spasm, nimodipine does reduce neurologic deficits and im-prove clinical outcomes in patients with SAH.14
Understanding how nimodipine affects the relationship between angiographic (large vessel) vasospasm, cerebral isch-emia, and clinical outcome after SAH could aid in the optimi-zation of nimodipine treatment regimens and suggest syner-gistic therapies to improve outcomes in SAH patients. Furthermore, as new therapies become available, it is likely that study designs will include patients who receive nimodip-ine together with newer therapies. Thus, more detailed knowl-edge of nimodipine’s effects on vessel diameter and CBF are becoming increasingly important.37
In response to this need, we have shown that CTP and CTA are feasible methods of quantifying vasospasm and CBF in a rabbit model of SAH-related vasospasm. CTP and CTA imag-ing are advantageous for repeated study of the angiographic and hemodynamic effects of delayed vasospasm because they do not require sacrifice of the animal to obtain data, allowing for measurements of artery diameter and CBF over the course of 2 weeks in individual rabbits. This strategy is both humane and economical, because the high statistical power of a re-peated measures design minimizes the necessary number of animals.
Consistent with previous reports, our model showed the development of acute vasospasm within 10 minutes of SAH induction as well as a corresponding acute reduction in CBF.38
Both groups experienced similar degrees of acute basilar artery narrowing, CBF reduction, and acidosis after SAH induction and before nimodipine treatment. This is important because it means that subsequent differences measured between groups were not likely due to a difference in initial SAH severity be-tween the treated and the control group.
We examined the effect of nimodipine on both basilar ar-tery diameter over the course of post SAH vasospasm and maximum severity of delayed vasospasm (at the time of max-imum arterial narrowing). Overall, nimodipine reduced vaso-spasm after SAH. The repeated measures analysis showed a statistically significant decrease in basilar artery diameter in the untreated group compared with the nimodipine-treated group (Fig 3). Thus, one effect of nimodipine was to decrease basilar artery narrowing post-SAH.
The effect of nimodipine on maximal severity of vasospasm was less conclusive. Although a smaller mean maximal reduc-tion was measured in the nimodipine group (20% vs 28% in the untreated group) this difference did not reach statistical significance. Additional study will be necessary to determine whether nimodipine reduces maximal vasospasm severity in this model.
Our data suggested an effect of nimodipine on the time course of delayed vasospasm in this model. Specifically, nimo-dipine appears to shorten the duration of time that significant Fig 3.Basilar artery diameter measured with CTA in the delayed stage of SAH. Error bars
[image:5.585.52.285.44.164.2]vasospasm is present. Basilar artery diameter in control ani-mals remained significantly lower than baseline until 9 days after SAH; in contrast, basilar artery diameter in the nimodip-ine group was significantly lower than baselnimodip-ine on day 3 only. This suggests that nimodipine treatment decreased the dura-tion of delayed vasospasm by promoting a faster recovery of the basilar artery to near-normal diameter.
Oxyhemoglobin, a potent vasoconstrictor, peaks in the CSF within 3 days of SAH and begins to decrease before max-imum delayed vasospasm.4,39,40The time course of
oxyhemo-globin concentration may be relevant to understanding why significant decreases in basilar artery diameter were evident in the nimodipine-treated group 3 days after SAH but not on later days.
We found that nimodipine had a beneficial effect on CBF after SAH in animals with moderate or severe vasospasm. In a previously published study of normal NZW rabbits, Haws et al showed that there was no significant increase in CBF 30 min-utes after an intravenous infusion of nimodipine.41Our find-ing of no significant differences in CBF between treated and control animals with minimal vasospasm is consistent with the findings of Haws et al. Nimodipine does not augment CBF when there are minor or no changes in the cerebrovasculature; however, it enhances CBF in animals with more severe vaso-spasm, likely through the dilation of cerebral arterioles. It would follow then, that in the absence of angiographic vaso-spasm, autoregulatory function in distal arterioles remains in-tact negating any potential effects of nimodipine. Our data also support this notion, as a significant effect of nimodipine was ap-parent only after stratifying the animals into groups based on the presence of moderate or severe delayed vasospasm.
Nimodipine treatment reduced neurologic impairment in this study. Few previously published animal studies have used neurologic scoring to study neurologic deficits after SAH, with
or without nimodipine treatment.27,42 We advocate using
neurologic scoring as a measure that has greater potential clin-ical relevance than solely angiographic measurements.
With functional CT imaging, one can acquire in vivo data that are relevant to the clinical problem of SAH. CTP is a widely available method that provides quantitative informa-tion about cerebral hemodynamics. It has been used to mea-sure CBF in both SAH and acute stroke patients.15,35,43-45
Clin-ical studies have shown that CTP can accurately identify ischemic regions in the brain after stroke with a specificity of 93%.44CTA is gaining acceptance as a standard method of diagnosing vasospasm and aneurysm location in SAH pa-tients. The ability of CTA to identify vasospasm appears to be similar to that of the “gold standard” test, digital subtraction angiography (DSA).16,46In addition, studies have indicated that CTA can detect aneurysms with a sensitivity of 100%.47,48
Compared to DSA, CTA is noninvasive and carries lower risk. The functional imaging protocol we used in this study dif-fers somewhat from CTA and CTP scanning protocols in hu-mans. The duration of CTP scanning in human patients is longer (2 minutes) than in our animal protocol (25.5 sec-onds).15This discrepancy is likely due to the longer circulation
time in humans compared with rabbits. This difference in cir-culation time also explains why CTA in humans requires a 25-second delay between contrast injection and data acquisi-tion, whereas only an 8-second delay was necessary for CTA in rabbits.48
[image:6.585.50.533.42.300.2]with human CTA would not require subtraction because1the larger vessel size makes it unnecessary for a qualitative assess-ment of vessel stenosis, and2 patient respiratory motion is
greater, making subtraction a less-effective strategy for im-proving the signal intensity to noise ratio of resultant angio-gram images.
There are some practical limitations to the techniques used in this study. First, although most of the blood pooled around the basilar artery in the posterior fossa, as seen on unenhanced CT immediately following SAH induction, we could not fully control for the final location of subarachnoid clot. Second, neurologic assessments are difficult to perform in rabbits. Al-though our neurologic evaluations were completed by a trained observer blinded to treatment status, there was some degree of subjectivity to the scoring scheme. Third, our re-peated measures study design, while efficient for studying va-sospasm, made monitoring of intracranial pressure during CBF measurements impractical. In conjunction with MAP, intracranial pressure has a direct effect on cerebral perfusion pressure.
Conclusion
In a rabbit model of SAH-related vasospasm, we showed that nimodipine treatment increased CBF, improved neurologic outcome, and reduced the duration of delayed vasospasm. We also demonstrated the utility of CTP and CTA imaging tech-niques for evaluating nimodipine’s effect on SAH and assess-ing the potential of new therapies in the presence of, or in comparison to, nimodipine.
Acknowledgments
We thank Dominique Ouimet and Jennifer Hadway for their assistance with the animals used in this study. We also thank Brad Urquhart and David Freeman (Department of Physiol-ogy and PharmacolPhysiol-ogy, University of Western Ontario) for analyzing the plasma samples collected in this study.
References
1. Hanel RA, Xavier AR, Mohammad Y, et al.Outcome following intracerebral hemorrhage and subarachnoid hemorrhage.Neurol Res2002;24(suppl 1): S58 – 62
2. Grasso G.An overview of new pharmacological treatments for cerebrovascu-lar dysfunction after experimental subarachnoid hemorrhage.Brain Res Brain Res Rev2004;44:49 – 63
3. Dorsch NW.Therapeutic approaches to vasospasm in subarachnoid hemor-rhage.Curr Opin Crit Care2002;8:128 –33
4. Mayberg MR.Cerebral vasospasm.Neurosurg Clin North Am1998;9:615–27 5. Kassell NF, Torner JC, Haley EC Jr, et al.The International Cooperative Study
on the Timing of Aneurysm Surgery. Part 1. Overall management results.
J Neurosurg1990;73:18 –36
6. Mendelow AD.Pathophysiology of delayed ischaemic dysfunction after sub-arachnoid haemorrhage: experimental and clinical data.Acta Neurochir Suppl (Wien)1988;45:7–10
7. Toyota BD.The efficacy of an abbreviated course of nimodipine in patients with good-grade aneurysmal subarachnoid hemorrhage.J Neurosurg1999;90: 203– 06
8. Allen GS, Ahn HS, Preziosi TJ, et al.Cerebral arterial spasm–a controlled trial of nimodipine in patients with subarachnoid hemorrhage.N Engl J Med1983; 308:619 –24
9. Petruk KC, West M, Mohr G, et al.Nimodipine treatment in poor-grade an-eurysm patients: results of a multicenter double-blind placebo-controlled trial.J Neurosurg1988;68:505–17
10. Auer LM.Acute surgery of cerebral aneurysms and prevention of symptom-atic vasospasm.Acta Neurochir (Wien)1983;69:273– 81
11. Mee E, Dorrance D, Lowe D, et al.Controlled study of nimodipine in aneurysm patients treated early after subarachnoid hemorrhage.Neurosurgery1988;22: 484 –91
12. Sahlin C, Brismar J, Delgado T, et al.Cerebrovascular and metabolic changes during the delayed vasospasm following experimental subarachnoid hemor-rhage in baboons, and treatment with a calcium antagonist.Brain Res1987; 403:313–32
13. Hauerberg J, Rasmussen G, Juhler M, et al.The effect of nimodipine on auto-regulation of cerebral blood flow after subarachnoid haemorrhage in rat.Acta Neurochir (Wien)1995;132:98 –103
14. Rinkel GJ, Feigin VL, Algra A, et al.Calcium antagonists for aneurysmal sub-arachnoid haemorrhage (Cochrane Review).Cochrane Database Syst Rev2002; CD000277
15. Nabavi DG, LeBlanc LM, Baxter B, et al.Monitoring cerebral perfusion after subarachnoid hemorrhage using CT.Neuroradiology2001;43:7–16 16. Anderson GB, Ashforth R, Steinke DE, et al.CT angiography for the detection
of cerebral vasospasm in patients with acute subarachnoid hemorrhage.
AJNR Am J Neuroradiol2000;21:1011–15
17. Baker KF, Zervas NT, Pile-Spellman J, et al.Angiographic evidence of basilar artery constriction in the rabbit: a new model of vasospasm.Surg Neurol1987; 27:107–12
18. Laslo AM, Eastwood JD, Urquhart B, et al.Subcutaneous administration of nimodipine improves bioavailability in rabbits.J Neurosci Methods2004;139: 195–201
19. Strong MJ, Wolff AV, Wakayama I, et al.Aluminum-induced chronic myelop-athy in rabbits.Neurotoxicology1991;12:9 –21
20. Strong MJ, Garruto RM, Wolff AV, et al.N-butyl benzenesulfonamide: a neu-rotoxic plasticizer inducing a spastic myelopathy in rabbits.Acta Neuropathol (Berl)1991;81:235– 41
21. Kudo K, Terae S, Katoh C, et al.Quantitative cerebral blood flow measurement with dynamic perfusion CT using the vascular-pixel elimination method: comparison with H2(15)O positron emission tomography.AJNR Am J Neu-roradiol2003;24:419 –26
22. Veelken JA, Laing RJ, Jakubowski J.The Sheffield model of subarachnoid hem-orrhage in rats.Stroke1995;26:1279 – 83
23. Jakubowski J, Bell BA, Symon L, et al.A primate model of subarachnoid hemorrhage: change in regional cerebral blood flow, autoregulation carbon dioxide reactivity, and central conduction time.Stroke1982;13:601–11 24. Megyesi JF, Vollrath B, Cook DA, et al.In vivo animal models of cerebral
vasospasm: a review.Neurosurgery2000;46:448 – 60
25. Grubb RL Jr, Raichle ME, Eichling JO, et al.Effects of subarachnoid hemor-rhage on cerebral blood volume, blood flow, and oxygen utilization in hu-mans.J Neurosurg1977;46:446 –53
26. Hosoda K, Fujita S, Kawaguchi T, et al.Effect of clot removal and surgical manipulation on regional cerebral blood flow and delayed vasospasm in early aneurysm surgery for subarachnoid hemorrhage.Surg Neurol1999;51:81– 88 27. Endo S, Branson PJ, Alksne JF.Experimental model of symptomatic
vaso-spasm in rabbits.Stroke1988;19:1420 –25
28. Meguro T, Clower BR, Carpenter R, et al.Improved rat model for cerebral vasospasm studies.Neurol Res2001;23:761– 66
29. Macdonald RL, Weir BK, Grace MG, et al.Mechanism of cerebral vasospasm following subarachnoid hemorrhage in monkeys.Can J Neurol Sci1992;19: 419 –27
30. Minhas PS, Menon DK, Smielewski P, et al.Positron emission tomographic cerebral perfusion disturbances and transcranial Doppler findings among patients with neurological deterioration after subarachnoid hemorrhage.
Neurosurgery2003;52:1017–22
31. Sviri GE, Lewis DH, Correa R, et al.Basilar artery vasospasm and delayed posterior circulation ischemia after aneurysmal subarachnoid hemorrhage.
Stroke2004;35:1867–72
32. Dernbach PD, Little JR, Jones SC, et al.Altered cerebral autoregulation and CO2 reactivity after aneurysmal subarachnoid hemorrhage.Neurosurgery
1988;22:822–26
33. Kassell NF, Sasaki T, Colohan AR, et al.Cerebral vasospasm following aneu-rysmal subarachnoid hemorrhage.Stroke1985;16:562–72
34. Fisher CM, Kistler JP, Davis JM.Relation of cerebral vasospasm to subarach-noid hemorrhage visualized by computerized tomographic scanning. Neuro-surgery1980;6:1–9
35. Harrigan MR, Magnano CR, Guterman LR, et al.Computed tomographic per-fusion in the management of aneurysmal subarachnoid hemorrhage: new ap-plication of an existent technique.Neurosurgery2005;56:304 –17
36. Meyer FB.Calcium antagonists and vasospasm.Neurosurg Clin North Am
1990;1:367–76
37. Rinkel GJ, Feigin VL, Algra A, et al.Calcium antagonists for aneurysmal sub-arachnoid haemorrhage.Cochrane Database Syst Rev2002;CD000277 38. Roux S, Clozel M, Wolfgang R, et al.Comparative evaluation of acute cerebral
39. Philippon J, Grob R, Dagreou F, et al.Prevention of vasospasm in subarach-noid haemorrhage: a controlled study with nimodipine.Acta Neurochir (Wien)1986;82:110 –14
40. Yin W, Tibbs R, Tang J, et al.Haemoglobin and ATP levels in CSF from a dog model of vasospasm.J Clin Neurosci2002;9:425–28
41. Haws CW, Gourley JK, Heistad DD.Effects of nimodipine on cerebral blood flow.J Pharmacol Exp Ther1983;225:24 –28
42. Otsuji T, Endo S, Hirashima Y, et al.An experimental model of symptomatic vasospasm induced by oxyhemoglobin in rabbits.Stroke1994;25:657– 62 43. Galvez M, York GE, Eastwood JD.CT perfusion parameter values in regions of
diffusion abnormalities.AJNR Am J Neuroradiol2004;25:1205–10 44. Mayer TE, Hamann GF, Baranczyk J, et al.Dynamic CT perfusion imaging of
acute stroke.AJNR Am J Neuroradiol2000;21:1441– 49
45. Nabavi DG, Cenic A, Henderson S, et al.Perfusion mapping using computed tomography allows accurate prediction of cerebral infarction in experimental brain ischemia.Stroke2001;32:175– 83
46. Otawara Y, Ogasawara K, Ogawa A, et al.Evaluation of vasospasm after sub-arachnoid hemorrhage by use of multislice computed tomographic angiogra-phy.Neurosurgery2002;51:939 – 42
47. Chappell ET, Moure FC, Good MC.Comparison of computed tomographic angiography with digital subtraction angiography in the diagnosis of cerebral aneurysms: a meta-analysis.Neurosurgery2003;52:624 –31