ORIGINAL RESEARCH
A Potential Pitfall of MR Imaging for Assessing
Mandibular Invasion of Squamous Cell Carcinoma
in the Oral Cavity
A. Imaizumi N. Yoshino I. Yamada K. Nagumo T. Amagasa K. Omura N. Okada T. Kurabayashi
BACKGROUND AND PURPOSE: Whether MR imaging is superior to CT in evaluating the presence and extent of mandibular invasion by squamous cell carcinoma remains controversial. The purpose of this study was to directly compare the diagnostic accuracy of MR imaging and that of CT.
METHODS: MR and CT images in 51 patients with squamous cell carcinoma of the oral cavity were evaluated for the presence and extent of mandibular invasion. The results were correlated with histopathologic findings.
RESULTS: Twenty-five of 51 patients had histopathologic evidence of mandibular cortical invasion. The tumor involved both the cortex and the bone marrow in all 25 patients and involved the inferior alveolar canal in 5 patients. The sensitivity and specificity for mandibular cortical invasion were 96% and 54% for MR imaging and 100% and 88% for CT, respectively. Those for inferior alveolar canal involvement were 100% and 70% for MR imaging and 100% and 96% for CT, respectively. In both evaluations, the specificity of MR imaging was significantly lower than that of CT (McNemar test,P⫽.004 in the former andP⫽.002 in the latter). Chemical shift artifact by bone marrow fat was postulated to be the source of most false-positive cases on MR imaging findings for mandibular cortical invasion. Those for inferior alveolar canal involvement were due to MR imaging visualization of the tumor and surrounding inflammation with similar signal intensity.
CONCLUSION:In assessing the presence and extent of mandibular invasion by squamous cell carci-noma, the specificity of MR imaging was significantly lower than that of CT.
A
n important role of imaging for patients with squamous cell carcinoma of the oral cavity is evaluation of the pres-ence and the extent of mandibular invasion, because mandib-ular invasion influences surgical planning. Although a final decision regarding extent of resection will be made intraoper-atively, it is helpful for the surgeon to plan for either a marginal or a segmental mandibulectomy. Among various imaging mo-dalities, both CT and MR are commonly used to evaluate pa-tients with squamous cell carcinoma of the oral cavity. Many studies have reported the diagnostic accuracy of these modal-ities in evaluating tumor invasion into the mandible. It re-mains controversial, however, which technique is more ad-vantageous for evaluating mandibular invasion.1The purpose of this study was to compare the diagnostic accuracy of MR imaging and that of CT for assessing the pres-ence and extent of mandibular invasion in squamous cell car-cinoma of the oral cavity.
Methods
Patients
We retrospectively reviewed the imaging studies of 51 patients with squamous cell carcinoma of the oral cavity clinically fixed to the mandible and suspected of having mandibular invasion. All patients were examined by both MR imaging and CT examinations between October 1996 and December 2004. They included 39 men and 12
women, with a mean age of 61 years (range, 37– 84 years). The pri-mary site of carcinoma was the gingival mucosa in 24 patients, floor of the mouth in 21 patients, and buccal mucosa in 6 patients. After MR imaging and CT examinations, all patients underwent marginal (n⫽ 21) or segmental (n⫽30) mandibulectomy.
Of the 51 patients, 24 patients had undergone some form of pre-operative treatment: radiation therapy (n⫽7), chemotherapy (n⫽ 5), or radiation and chemotherapy (n⫽12). None of the patients had undergone mandibular surgery before MR imaging or CT.
The study protocol was approved by our institutional review board, and informed consent was obtained from all patients.
Imaging Protocol
MR images were obtained by using a 1.5T unit with a head and neck coil. In axial planes, T1-weighted spin-echo images (TR/TE⫽ 500 –700/14 milliseconds) and T2-weighted fast spin-echo images (3000 –5000/90 milliseconds; echo train length, 7) with fat saturation were obtained in all 51 patients. In coronal planes, T1-weighted (500 – 700/14 milliseconds) and/or T2-weighted images (3000 –5000/90 milliseconds) were obtained in all patients. In 41 of 51 patients, axial and coronal T1-weighted spin-echo images (500 –700/14 millisec-onds) with fat saturation after intravenous administration of 0.1 mmol/kg of body weight of gadolinium contrast agent were also ob-tained. All images were obtained with 3– 4-mm section thickness, a 0.3–1-mm intersection gap, a field of view (FOV) of 173⫻230 mm, and matrix of 154⫻256 (phase⫻frequency). Thus, we used a rect-angular FOV technique to save measurement time while maintaining the same spatial resolution as in a square image. For axial imaging, superior and inferior presaturation pulses were applied.
For CT examinations, a spiral CT scanner was used. In all patients, a 5-mm-thick axial spiral scan was performed from skull base to tho-racic inlet after intravenous administration of 60 –100 mL of iodine contrast agent, and contiguous 5-mm-thick axial images were
recon-Received March 9, 2005; accepted after revision June 10.
From the Departments of Oral and Maxillofacial Radiology (A.I., N.Y., T.K.), Diagnostic Radiology and Oncology (I.Y.), Diagnostic Oral Pathology (K.N., N.O.), Maxillofacial Surgery (T.A.), and Oral Surgery (K.O.), Graduate School, Tokyo Medical and Dental University, Bunkyo-ku, Tokyo, Japan.
structed with both soft-tissue and bone algorithms. In 35 cases in which the presence or extent of bone invasion was difficult to evaluate with the axial images alone, 1-mm-thick axial spiral scan for the man-dible was added and dental CT–reformatted images were also ob-tained by using Dental CT, or DentaScan, a CT software program specifically developed to evaluate dental implant patients that dis-plays multiple panoramic and cross-sectional images of the jaw bone.2
The average interval between MR imaging and CT was 13 days (range, 0 –79 days; median, 6 days). In 80% of the cases (41/51), the interval was within 20 days. The average interval between the day when both imaging examinations were completed and that of surgery was 8 days (range, 1–25 days; median, 6 days).
Imaging Assessment
Two radiologists, who were not given any information about the tumor except for the primary site, reviewed MR and CT images inde-pendently. The images were evaluated for the presence or absence of mandibular cortical invasion, bone marrow involvement, and infe-rior alveolar canal involvement by tumor. The observers were first asked to evaluate mandibular cortical invasion. When mandibular cortical invasion was regarded as positive, bone marrow involvement was evaluated. Likewise, when bone marrow involvement was re-garded as positive, inferior alveolar canal involvement was evaluated. When the tumor was regarded as negative for mandibular cortical invasion, it was also regarded as negative for bone marrow involve-ment and inferior alveolar canal involveinvolve-ment without further assess-ment of images.
The diagnostic criteria of MR imaging and CT are shown in Table 1. MR images used for the evaluation of mandibular cortical invasion were axial and coronal T1-weighted images, which are known to vi-sualize the cortical bone most clearly.3,4In 6 cases in which coronal T1-weighted images were not obtained, coronal T2-weighted images were used instead. For the evaluation of bone marrow involvement and inferior alveolar canal involvement, all of T1-, T2-, and contrast-enhanced T1-weighted images were used. On the other hand, for CT evaluation, 5-mm-thick bone algorithm axial images were used in all cases. In addition, dental CT–reformatted images and 1-mm-thick bone algorithm axial images were also used in 35 cases. When dis-agreement existed between the assessments of 2 observers, a consen-sus was reached by discussion. Interobserver agreement was evaluated withstatistics.
Pathologic Assessment
The presence and extent of bone invasion by tumor were defini-tively determined by histopathologic findings, which were used as the gold standard for this study. After fixation, mandibulectomy speci-mens were cut along the coronal plane at 5-mm intervals to include
the deepest area of tumor invasion. Then, after decalcification, the specimens were sectioned and stained with hematoxylin and eosin. Microscopic examinations were performed by one pathologist. As he was unaware of preoperative imaging findings, there was no attempt to precisely correlate imaging finding with a specific point on the bone at the pathologic assessment.
Statistical Analysis
MR imaging and CT findings were correlated with histopatho-logic findings. Sensitivity, specificity, positive and negative predictive values, and accuracy of each technique were calculated. To compare these 2 modalities for sensitivity and specificity, the McNemar test was used. APvalue⬍.05 was considered to indicate a statistically significant difference.
Thevalues were calculated for interobserver agreement. A value⬍0.40 was considered to indicate poor agreement, 0.40 – 0.59 fair agreement, 0.60 – 0.74 good agreement, and 0.75–1.00 excellent agreement.
Results
Twenty-five (49%) of the 51 tumors had histopathologic evidence of mandibular invasion, whereas the remaining 26 had no evidence of invasion. In all 25 cases with invasion, the tumor involved both the cortex and the bone marrow. In 5 of them, the tumor was histopathologically confirmed to involve the inferior alveolar canal. The primary site of 25 tumors with mandibular invasion was gingival mucosa in 21, floor of mouth in 3, and buccal mucosa in a single patient. All of these tumors involved or extended to the alveolar crest.
Interobserver agreement was good or excellent for both MR imaging and CT. In the assessment of mandibular cortical invasion, bone marrow involvement, and inferior alveolar canal involvement, thevalues for MR imaging were 0.65, 0.80, and 0.87, and those for CT were 0.80, 0.77, and 1.00, respectively.
Mandibular Cortical Invasion
Of the 25 tumors with histopathologically positive results, 24 were true-positive with both modalities (Fig 1). The re-maining one was true-positive with CT but false-negative with MR imaging. This was a case of gingival carcinoma that slightly involved the alveolar crest. The sensitivity of MR im-aging and CT was 96% and 100%, respectively, and the differ-ence was not significant (McNemar test,P⬎.05; Table 2).
On the other hand, of the 26 tumors with histopathologi-cally negative results, 14 were true-negative (Fig 2) and 3 were false-positive with both modalities. The remaining 9 tumors were true-negative with CT but false-positive with MR imag-ing (Figs 3–5). The specificity of MR imagimag-ing and CT was 54% and 88%, respectively (Table 2). The specificity of MR imaging was significantly lower than that of CT (P⫽.004). Seven of the 9 tumors in which only MR imaging showed false-positive results were anterior floor-of-mouth carcinomas. The mis-classification of these 7 cases with MR imaging seemed to be attributed to chemical shift artifacts induced by bone marrow fat. Namely, it was considered that the black line of the cortex adjacent to the tumor mass was obscured by spatial misplace-ment of fat (Figs 3 and 4). To confirm this hypothesis, we performed the validation study in which a normal volunteer Table 1: Diagnostic criteria of MR imaging and CT in evaluating
tumor invasion into the mandible
Mandibular cortical invasion
MRI, CT: Defect of the cortical bone adjacent to the tumor mass Bone marrow involvement
MRI: Abnormal signal intensity of bone marrow* contiguous to the cortical defect
CT: Trabecular disruption contiguous to the cortical defect Inferior alveolar canal involvement
MRI, CT: Bone marrow involvement reaching the inferior alveolar canal
* Hypointense on T1-weighted and hyperintense on fat-suppressed T2-weighted image, with enhancement after contrast administration.
HEAD
&
NECK
ORIGINAL
was imaged. The results are described later. The other false-positive cases, including 2 cases with only MR imaging and 3 with both modalities, were attributed to severe periodontal
[image:3.585.56.532.43.224.2]disease or secondary changes from tooth extraction. Such mis-classification was found in both modalities, though more commonly with MR imaging than with CT (Fig 5).
Table 2: Diagnostic accuracy of MR imaging and CT in evaluating bone invasion
TP TN FP FN Sensitivity Specificity PPV NPV Accuracy
No. of Cases %
Mandibular cortical invasion
MR imaging 24 14 12 1 96 54* 67 93 74
CT 25 23 3 0 100 88* 89 100 94
Bone marrow involvement
MR imaging 24 21 5 1 96 81 83 95 88
CT 25 23 3 0 100 88 89 100 94
Inferior alveolar canal involvement
MR imaging 5 32 14 0 100 70† 26 100 73
CT 5 44 2 0 100 96† 71 100 96
Note:—TP indicates true-positive; TN, true-negative; FP, false-positive; FN, false-negative; PPV, positive predictive value; NPV, negative predictive value. *P⫽.004;†P⫽.002 (McNemar test).
Fig 1.A 67-year-old man with left floor-of-mouth carcinoma, showing a true-positive result for cortical invasion with both MR imaging and CT.
A,Axial T1-weighted MR image (560/14).
B,Axial bone algorithm CT image.
Both MR and CT image reveal destruction of the cortex (arrows) adjacent to the tumor mass. These findings were histopathologically confirmed.
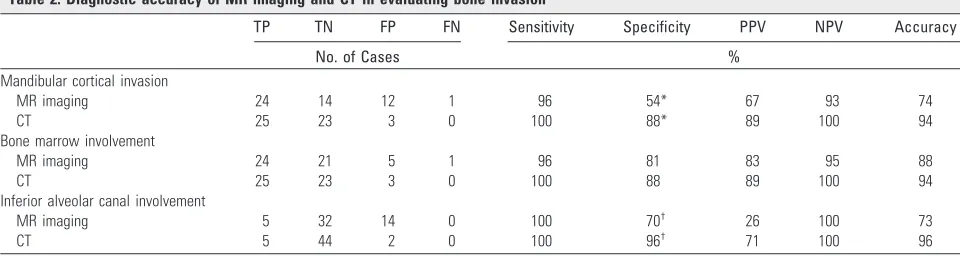
Fig 2.A 48-year-old woman with left floor-of-mouth carcinoma showing a true-negative result for cortical invasion with both MR imaging and CT.
A,Axial T1-weighted MR image (560/14).
B,Axial bone algorithm CT image.
[image:3.585.55.534.280.465.2] [image:3.585.53.533.542.670.2]Bone Marrow Involvement
The results with CT for bone marrow involvement were the same as those for cortical invasion. With regard to MR imag-ing, all 7 of the cases that showed false-positive results for cortical invasion due to chemical shift artifacts had true-neg-ative results for bone marrow invasion. The specificity of MR imaging and CT was 81% and 88%, respectively, and the dif-ference was not significant (P⬎.05; Table 2).
Inferior Alveolar Canal Involvement
Both MR imaging and CT correctly diagnosed the 5 tumors with histopathologic evidence of inferior alveolar canal in-volvement, providing the sensitivity of 100%. On the other hand, there were 14 false-positive cases with MR imaging, whereas 2 with CT. Thus, the specificity of MR imaging was
significantly lower than that of CT (70% for MR imaging and 96% for CT,P⫽.002; Table 2). MR imaging often showed the tumor and the surrounding inflammation in the bone marrow with similar signal intensity, resulting in overestimation of the tumor extent (Fig 6).
When the 24 patients who received preoperative radiation and/or chemotherapy were excluded from the study, the spec-ificity of MR imaging was still significantly lower than that of CT (68% for MR imaging and 96% for CT,P⫽.039).
Validation Study
To confirm our hypothesis that chemical shift artifact might obscure the lingual cortex of the midline mandible (Figs 3 and 4), MR imaging was performed in a normal volunteer. In this study, the mandible was imaged by the 3 different meth-Fig 3.A 70-year-old man with anterior floor-of-mouth carcinoma showing a false-positive result with MR imaging and true-negative result with CT for cortical invasion.
A,Axial T1-weighted MR image (700/14).
B,Axial bone algorithm CT image.
The lingual cortex (arrow) is suspected to be involved by the tumor mass on T1-weighted MR image, whereas it is intact on CT. Histopathologic examination after marginal mandibulectomy confirmed no tumor invasion into the mandible. Chemical shift artifacts induced by bone marrow fat are considered to account for the false-positive result with MR imaging. That is, the black line of the cortex adjacent to the tumor mass is thought to be obscured by spatial misplacement of bone marrow fat.
Fig 4.A 46-year-old man with anterior floor-of mouth carcinoma showing a false-positive result with MR imaging and true-negative result with CT for cortical invasion.
A,Axial T1-weighted MR image (560/14).
B,Axial bone algorithm CT image.
[image:4.585.57.533.42.223.2] [image:4.585.53.533.301.483.2]ods of T1-weighted spin-echo sequence shown in Fig 7. The study showed that the lingual cortex was lost on the ordi-nary T1-weighted image, whereas it remained intact when phase- and frequency-encoding directions were swapped or when fat saturation pulse was used. These findings confirmed our hypothesis.
Discussion
Because of their close anatomic relationship to the mandi-ble, squamous cell carcinomas of the oral cavity, except for those of the tongue, have a high tendency to invade the man-dible. When the tumor extends to the mandible, marginal or segmental mandibulectomy is necessary, depending on its ex-tent of involvement. Thus, for those tumors clinically close to the mandible, one of the most important roles of imaging is to evaluate accurately the presence and extent of tumor invasion into the mandible.
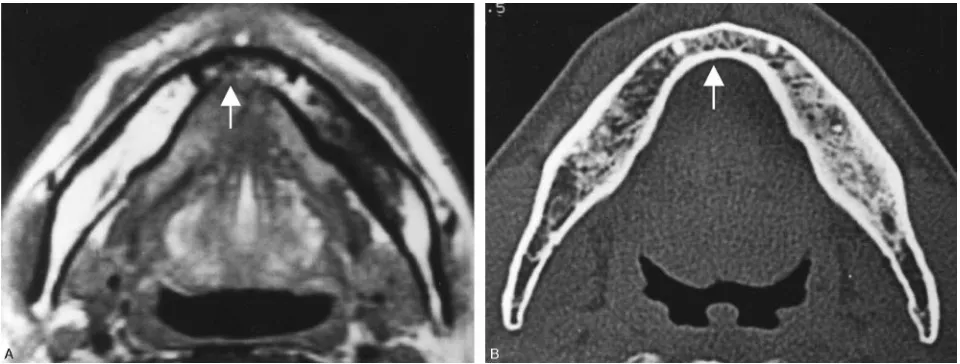
Among various imaging techniques available for patients with oral carcinoma, both CT and MR imaging are most com-monly used to evaluate mandibular invasion. The diagnostic accuracy of CT in detecting mandibular invasion varies widely, depending on the researchers. Some studies5,6 re-ported⬎30% false-positive and/or false-negative rates for CT, but these results are considered to be due to use of an inappro-priate CT technique. Mukherji et al1used 3-mm thick bone algorithm CT images and reported a sensitivity of 96% and specificity of 87%. Similarly, the studies in which overlapping 5-mm thick bone algorithm images7or dental CT–reformat-ted images8were used showed a high diagnostic accuracy of CT. Thus, as indicated by Mukherji et al,1CT seems to be a reliable imaging technique for evaluating mandibular inva-sion when appropriate CT techniques are used. On the other hand, the number of studies focusing on MR imaging is rela-tively limited. Among them, some researchers have reported a Fig 5.A 62-year-old man with left floor-of mouth carcinoma showing a false-positive result
with MR imaging and true-negative result with CT for cortical invasion.
A,Axial T1-weighted image (560/14).
B,Contrast-enhanced coronal T1-weighted image (700/14).
C, Axial bone algorithm CT image. D,Dental CT reformatted images.
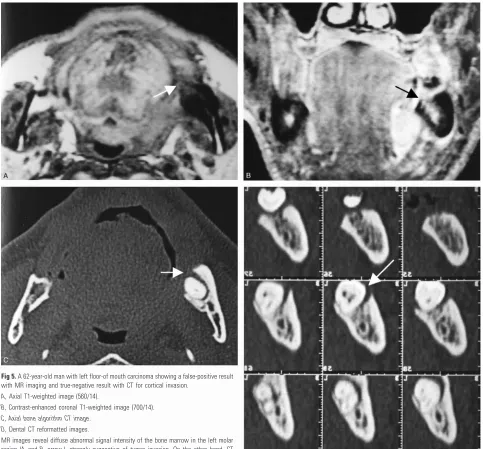
[image:5.585.52.535.41.490.2]high rate of false-positive studies with MR imaging.3,9,10 Campbell et al9showed that a positive predictive value of MR imaging was 67% for evaluating mandibular invasion. Simi-larly, Chung et al3reported that a positive predictive value of MR imaging was⬍70% for evaluating cortical invasion and ⬍50% for medullary invasion. However, Bolzoni et al11 re-cently reported a high diagnostic accuracy of MR imaging for detecting mandibular invasion, a sensitivity of 93% and spec-ificity of 93%. Most of the previous studies, including these reports, evaluated either CT or MR imaging alone and did not Fig 6.A 69-year-old man with left lower gingival carcinoma showing a false-positive result with MR imaging and true-negative result with CT for the involvement of inferior alveolar canal.
A,Axial T1-weighted image (560/14).
B,Contrast-enhanced coronal T1-weighted image (520/14).
C,Axial bone algorithm CT image.
D,Dental CT reformatted images.
E,Photomicrograph of the surgical specimen (Hematoxylin and eosin stain; original magnification,⫻5.3)
[image:6.585.53.531.34.676.2]compare these 2 imaging modalities simultaneously. To the best of our knowledge, the only study to have performed a direct comparison of CT and MR imaging is that of van den Brekel et al.12They reported that the respective sensitivity and specificity were 94% and 73% for MR imaging and 64% and 89% for CT and stated that neither of these 2 imaging modal-ities was accurate enough, though it seems that CT images used in their study were not optimal for the evaluation. Sigal et al13stated that CT depicts cortical bone invasion better and the extent of the medullary bone invasion is better defined with MR imaging, though no evidence was provided that supported their views. It is generally accepted that MR imaging is supe-rior to CT in demonstrating the soft tissue extent of the tumor in the oral cavity, because of its excellent soft-tissue contrast and multiplanar facility. Which technique better evaluates the presence and extent of mandibular invasion by tumor, how-ever, remains controversial. For this purpose, we directly com-pared the diagnostic accuracy between MR imaging and CT.
As shown in Table 1, we used the imaging criteria similar to those in most previous studies1,3,4,6,8,10-13for evaluating man-dibular invasion. When evaluating CT, bone algorithm axial images were used in all cases. In addition, in more than two thirds of the cases in which the presence and/or extent of man-dibular invasion was unclear on axial images, dental CT–re-formatted images were also obtained and used. It is difficult to evaluate the presence of the slight invasion of tumor into the
alveolar crest or the superoinferior extent of tumor invasion into the mandible with axial CT alone.1In our study, dental CT images were obtained in all cases in which such evaluation was needed. For evaluating MR imaging, we used unenhanced axial and coronal T1-weighted images to detect mandibular cortical invasion, because those images are known to demon-strate cortical destruction most clearly.3,4On the other hand, we used all MR images to detect tumor invasion into the bone marrow. Namely, in our study, bone marrow fat replacement on T1-weighted images alone was not regarded as medullary invasion, because such can be found in reactive bone sclerosis and idiopathic attenuated bone island, which are conditions commonly seen in the mandible.10
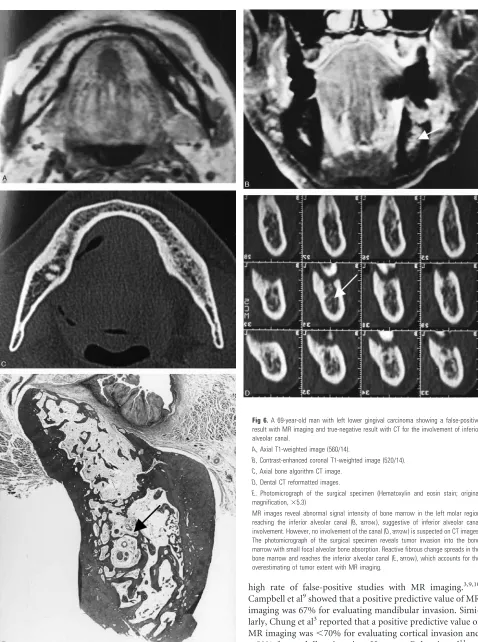
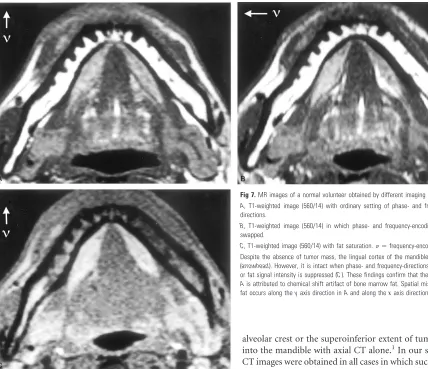
In the evaluation of mandibular cortical invasion, we found one false-negative study with MR imaging. In this case, dental CT–reformatted images were useful to detect slight in-vasion of a gingival carcinoma into the alveolar crest. We used a single helical CT with 1-mm-thick sections to reconstruct dental CT. The diagnostic accuracy may be further improved by the use of multidetector CT with thinner section thickness or cone-beam CT with minute voxel of approximately 0.125 mm cube.14On the other hand, we found 3 false-positive stud-ies with both modalitstud-ies and 9 with only MR imaging. The specificity of MR imaging was significantly lower than that of CT (54% for MR imaging and 88% for CT,P⫽.004). It has been reported that false-positive cases could be created by in-flammatory odontogenic disease, postextraction bone defect, osteoradionecrosis, some normal variations of the cortex, and partial volume effect.3,9-13In our study also, some false-posi-tive cases were attributed to severe periodontal disease or sec-ondary changes from tooth extraction. Although such mis-Fig 7.MR images of a normal volunteer obtained by different imaging methods
A,T1-weighted image (560/14) with ordinary setting of phase- and frequency-encoding directions.
B,T1-weighted image (560/14) in which phase- and frequency-encoding directions are swapped.
C,T1-weighted image (560/14) with fat saturation.⫽frequency-encoding direction Despite the absence of tumor mass, the lingual cortex of the mandible is obscured inA
(arrowhead). However, it is intact when phase- and frequency-directions are swapped (B) or fat signal intensity is suppressed (C). These findings confirm that the cortical defect in
[image:7.585.59.487.41.410.2]classification occurred in both modalities, it was more common with MR imaging than with CT. The bone defects due to these benign processes tend to show smooth margins on images, in contrast to those by malignant lesions, which generally show irregular or ill-defined margins. Therefore, they may be differentiated to some extent, on the basis of the imaging features.15,16It seemed that CT was superior to MR imaging in evaluating the contours of bone resorption in detail (Fig 5).
In addition to the well-known conditions simulating tu-mor invasion, our study showed that chemical shift artifact was a possible cause of false-positive results with MR imaging, as illustrated in Fig 7. Seven of 9 tumors in which only MR imaging showed false-positive results were anterior floor-of-mouth carcinomas. In these cases, the lingual cortex adjacent to the tumor mass was lost by spatial misplacement of bone marrow fat on MR images, whereas it was completely intact on CT (Figs 3 and 4). The hydrogen protons in fat precess at 3.5 parts per million lower frequency than those in water, result-ing in a spatial misplacement of the fat signal intensity to the lower level along the frequency-encoding direction. The dif-ference corresponds to 220 Hz when a 1.5T unit is used. Con-sidering other parameters in our study, including bandwidth of 32 kHz, FOV of 230 mm, and matrix of 256 pixels in the frequency-encoding direction (yaxis direction), the misplace-ment of fat is calculated as follows: 220 Hz/(32 kHz/256 pix-els)⫽1.8 pixels;1.8 pixels⫻230 mm/256 pixels⫽1.6 mm. This amount of the shift is thought to be large enough to ob-scure the black line of the cortex. When obtaining axial MR images in the head and neck region, it is recommended to set the phase- and the frequency-encoding directions alongxand yaxes, respectively, to minimize the effect of motion artifacts by globe movement or arterial blood flow.17,18In addition, if a rectangular FOV technique is applied, the frequency-encod-ing direction must be set along theyaxis because an image is longer inyaxis than inxaxis direction. If lower frequencies are inferior, spatial misplacement of bone marrow fat will obscure the lingual cortex on MR images. Similarly, when superior, the fat will obscure the labial cortex. On both occasions, chemical shift artifacts can be a potential pitfall of MR imaging for as-sessing mandibular invasion by tumor.
As to the tumor extent within the mandible, we evaluated both bone marrow involvement and inferior alveolar canal involvement. In this regard, we evaluated the presence or ab-sence of tumor invasion reaching the inferior alveolar canal and found that it tended to be overestimated with MR imag-ing. Chung et al3reported that MR imaging could clearly re-veal the tumor in the bone marrow with different signal inten-sity and was considered superior to CT in evaluating the pathologic change in this location. Our results, however, were not compatible with their study. In evaluating inferior alveolar canal involvement, the specificity of MR imaging was signifi-cantly lower than that of CT (70% for MR imaging and 96% for CT,P⫽.002). Even in the cases that were true-negative with MR imaging, it often showed greater extent of the tumor than CT and pathologic specimens. Comparing imaging with histopathologic features, we found that inflammatory changes (ie, peritumoral edema, reactive changes, fibrosis, etc) in the surrounding bone marrow could show abnormal signal inten-sity similar with that of tumor. These facts resulted in the
overestimation of the tumor extent (Fig 6), though it may be important to show the peritumoral inflammatory zone be-cause it is reported to have the possibility of containing tumor cells.19Regardless of the presence or absence of tumor mass, severe dental caries and periodontal disease can easily cause chronic inflammation of the mandible.20Therefore, such ab-normal signal intensity in the bone marrow is more com-monly found in the mandible compared with other bones of the body. This will also account for the low specificity of MR imaging. Dynamic MR imaging may be useful to distinguish tumor from inflammatory changes.21,22Further investigation, however, will be necessary to determine whether this tech-nique is valuable in evaluating the tumor extent in the bone marrow.
Our study had some limitations that should be addressed. The first limitation was the difference of spatial resolution between both modalities. MR imaging had apparently lower resolutions than 1-mm-thick CT. Recently, several investiga-tions have reported the usefulness of high-resolution MR im-aging with small-diameter surface coils in diagnosis of the head and neck region.23,24Although only conventional MR images were evaluated in our study, such high-resolution im-ages might have shown further details of the mandible and improved the diagnostic accuracy of MR imaging. The second limitation was the preoperative treatment with radiation and/or chemotherapy in nearly half the patients, which could affect bone marrow signal intensity of MR imaging. We con-firmed that the specificity of MR imaging was still lower than that of CT, when those patients were excluded from the study; however, such pretreatment may account for some of the cases which were false-positive with MR imaging, but true-negative with CT in the assessment of inferior alveolar canal involve-ment. Finally, squamous cell carcinoma might invade the mandibular bone marrow without cortical destruction, though such cases were not encountered in this series. Bolzoni et al11reported a case in which mandibular involvement by neoplastic vascular embolization into the bony lacunae was histopathologically confirmed with absence of direct cortical invasion. If such case had been encountered in our study, it would have been misclassified with both CT and MR imaging because of the lack of evidence of cortical invasion.
Conclusion
For assessing the presence and extent of mandibular inva-sion in squamous cell carcinoma of the oral cavity, the speci-ficity of MR imaging was significantly lower than that of CT. The false-positive cases of MR imaging in the evaluation of mandibular cortical invasion were mostly due to chemical shift artifact by bone marrow fat that obscured the black line of the cortex. On the other hand, those in evaluating inferior alveolar canal involvement were due to the fact that MR im-aging showed the tumor and the surrounding inflammation with similar signal intensity, resulting in the overestimation of the tumor extent in the bone marrow. Radiologists should know the potential pitfall of MR imaging in those assessments, causing a significant number of false-positive cases.
References
2. Abrahams JJ.Anatomy of the jaw revisited with a dental CT software program.
AJNR Am J Neuroradiol1993;14:979 –90
3. Chung TS, Yousem DM, Seigerman HM, et al.MR of mandibular invasion in patients with oral and oropharyngeal malignant neoplasms.AJNR Am J Neu-roradiol1994;15:1949 –55
4. Yasumoto M, Shibuya H, Takeda M, Korenaga T.Squamous cell carcinoma of the oral cavity: MR findings and value of T1- versus T2-weighted fast spin-echo images.AJR Am J Roentgenol1995;164:981– 87
5. Brown JS, Griffith JF, Phelps PD, et al.A comparison of different imaging modalities and direct inspection after periosteal stripping in predicting the invasion of the mandible by oral squamous cell carcinoma.Br J Oral Maxillo-fac Surg1994;32:347–59
6. Tsue TT, McCulloch TM, Girod DA, et al.Predictors of carcinomatous inva-sion of the mandible.Head Neck1994;16:116 –26
7. Close LG, Merkel M, Burns DK, et al.Computed tomography in the assessment of mandibular invasion by intraoral carcinoma.Ann Otol Rhinol Laryngol
1986;95:383– 88
8. Brockenbrough JM, Petruzzelli GJ, Lomasney L.DentaScan as an accurate method of predicting mandibular invasion in patients with squamous cell carcinoma of the oral cavity.Arch Otolaryngol Head Neck Surg2003;129:113–17 9. Campbell RS, Baker E, Chippindale AJ, et al.MRI T staging of squamous cell carcinoma of the oral cavity: radiological-pathological correlation.Clin Ra-diol1995;50:533– 40
10. Crecco M, Vidiri A, Angelone ML, et al.Retromolar trigone tumors: evaluation by magnetic resonance imaging and correlation with pathological data.Eur J Radiol1999;32:182– 88
11. Bolzoni A, Cappiello J, Piazza C, et al.Diagnostic accuracy of magnetic reso-nance imaging in the assessment of mandibular involvement in oral-oropha-ryngeal squamous cell carcinoma: a prospective study.Arch Otolaryngol Head Neck Surg2004;130:837– 43
12. van den Brekel MWM, Runne RW, Smeele LE, et al.Assessment of tumor invasion into the mandible: the value of different imaging techniques.Eur Radiol1998;8:1552–57
13. Sigal R, Zagdanski AM, Schwaab G, et al.CT and MR imaging of squamous cell carcinoma of the tongue and floor of the mouth.Radiographics1996;16:787– 810
14. Hashimoto K, Arai Y, Iwai K, et al.A comparison of a new limited cone beam computed tomography machine for dental use with a multidetector row heli-cal CT machine.Oral Surg Oral Med Oral Pathol Oral Radiol Endod2003;95: 371–77
15. White SC, Pharoah MJ.Periodontal diseases.In: White SC, Pharoah MJ, eds.
Oral radiology: principles and interpretation.5th ed. St. Louis: Mobsy;2004: 314 –29
16. Wood NK, Goaz PW, Jacobs MC.Periapical radiolucencies.In: Wood NK, Goaz PW, eds.Differential diagnosis of oral lesions.3rd ed. St. Louis: Mobsy;1985: 320 –55
17. Hashemi RH, Bradley WG, Lisanti CJ.MRI: the basics.2nd ed. Philadelphia: Lippincott Williams & Wilkins;2003:187–220
18. Herrick RC, Hayman LA, Taber KH, et al.Artifacts and pitfalls in MR imaging of the orbit: a clinical review.Radiographics1997;17:707–24
19. Yuen PW, Lam KY, Chan ACL, et al.Clinicopathological analysis of local spread of carcinoma of the tongue.Am J Surg1998;175:242– 44
20. Lee L.Inflammatory lesions of the jaws.In: White SC, Pharoah MJ, eds.Oral radiology: principles and interpretation.5th ed. St. Louis: Mobsy;2004:366 – 83 21. Baba Y, Furusawa M, Murakami R, et al.Role of dynamic MRI in the evaluation
of head and neck cancers treated with radiation therapy.Int J Radiat Oncology Biol Phys1997;37:783– 87
22. Lang P, Honda G, Roberts T, et al.Musculoskeletal neoplasm: perineoplastic edema versus tumor on dynamic postcontrast MR images with spatial map-ping of instantaneous enhancement rates.Radiology1995;197:831–39 23. Kress B, Gottschalk A, Stippich C, et al.High-resolution dental magnetic
res-onance imaging of inferior alveolar nerve responses to the extraction of third molars.Eur Radiol2004;14:1416 –20