Evaluation of the Upper Airway Cross-sectional
Area Changes in Different Degrees of Severity of
Obstructive Sleep Apnea Syndrome:
Cephalometric and Dynamic CT Study
Aylin Yucel, Mehmet Unlu, Alpay Haktanir, Murat Acar, and Fatma Fidan
BACKGROUND AND PURPOSE: The upper airway lumen is narrower in patients with obstructive sleep apnea syndrome (OSAS) than normal subjects. In this study, we examined changes of the upper airway cross-sectional area in each phase of respiration in different degrees of severity of OSAS with dynamic CT and investigated whether these changes have any correlation with sleep apnea severity parameters, including polysomnography (PSG) and cephalometry.
MATERIALS AND METHODS: Between May and November 2004, 47 patients who had at least 2 of 3 major symptoms of snoring, daytime somnolence, and apnea with witness were included in this prospective study. As control group, 24 habitual snorers were studied. All patients underwent PSG and upper airway CT. The average number of episodes of apnea and hypopnea per hour of sleep (the apnea-hypopnea index, AHI) was calculated. An AHI of 5 –29 represented mild/moderate OSAS and an AHI>30 represented severe OSAS. Cross-sectional area of the airway at the level of oropharynx and hypopharynx were obtained in each phase of quiet tidal breathing and at the end of both the forced inspiration and expiration. Six standard cephalometric measurements were made on the lateral scout view. All parameters were com-pared between controls and mild/moderate and severe OSAS groups.
RESULTS: Twenty-seven patients had mild/moderate OSAS, and 20 patients had severe OSAS. Patients with severe OSAS had significantly narrower cross-sectional area at the level of uvula in expiration, more inferiorly positioned hyoid bone, and thicker soft palate compared with patients with mild/moderate OSAS (P< .05) and the control group (P< .05). In addition, severe OSAS patients had bigger neck circumference than those in the control group (P< .05). CONCLUSION: Patients with severe OSAS had significant differences in the parameters. Measurement of the cross-sectional area of oropharynx in expiration can especially be useful for diagnosis of severe OSAS as a new key point.
Obstructive sleep apnea syndrome (OSAS) is a com-mon form of sleep-disordered breathing character-ized by repetitive episodes of partial or complete upper airway obstruction (1). Diagnosis of this pro-cess is important. Cognitive deficits, impaired psycho-social well-being, reduced driving competence, car-diovascular morbidity, and mortality were reported, because it usually causes the fragmentation of sleep,
reduced blood oxygen levels, and excessive daytime somnolence (1– 4). The etiology of OSAS includes abnormalities in both the physiology and anatomy of the airway and associated facial structures (5). It was suggested that patients with OSAS had a narrower pharyngeal airway than normal persons because of fat infiltration, the weight of the soft tissue of the neck, or reduced pharyngeal muscle tone (6).
Polysomnography (PSG) is a diagnostic test that measures or records physiologic variables during sleep (1, 2, 7–14). It is recommended as a routine examination in the diagnosis of OSAS (15). In addi-tion to PSG, multiple imaging techniques have been used to evaluate the upper airway in patients with OSAS (15). Static techniques include cephalometric radiography, CT, and MR imaging. Dynamic tech-niques include fluoroscopy, somnofluoroscopy, cine Received March 31, 2005; accepted after revision April 13.
From the Departments of Radiology (A.Y., A.H., M.A.) and Chest Diseases (M.U., F.F.), Afyon Kocatepe University School of Medicine, Afyon, Turkey.
Address correspondence to Aylin Yucel, MD, Department of Radiology, Afyon Kocatepe University School of Medicine, 03200 Afyon, Turkey.
©American Society of Neuroradiology
CT, fast CT and MR imaging, and fluoroscopic MR (3, 4, 6, 7, 16, 17).
Many cephalometric studies have been performed to investigate the craniofacial architecture of patients with OSAS, in which measurements and abnormali-ties of the craniofacial structures are well docu-mented (5, 8 –11); however, because cephalometric evaluation is usually applied to patients in upright position and can show craniofacial structures only in 2 dimensions, its value in evaluation of OSAS is low because the upper airway area changes during breath-ing and decreases in the supine position. Therefore, additional evaluation techniques are needed. CT is performed in the supine position and provides infor-mation about airway cross-sectional area and site of collapse, when performed in different phases of res-piration (2, 7–10, 16). Therefore, cephalometry and CT are complementary techniques in the evaluation of the skeletal system and soft tissue in OSAS.
Many studies have been performed for the evalua-tion of OSAS by using CT. These studies, however, were generally based on static images and compared healthy subjects with patients having OSAS. Few of them investigated dynamic cross-sectional area changes of the pharyngeal lumen with (6, 9, 18) or without (4, 6, 7, 10, 12, 13, 16, 17, 19, 20) severity of OSAS. Recently, Bhattacharyya et al (16) reported that 3D airway CT demonstrated dynamic airway ob-struction in OSAS but did not correlate their findings with clinically important disease parameters.
The purpose of this study was to show changes in the upper airway cross-sectional area in each phase of respiration in different degrees of severity of OSAS with dynamic CT and correlate these findings with sleep apnea severity parameters, including PSG and cephalometry.
Materials and Methods
Between May and November 2004, 47 patients (29 women [61.7%] and 18 men [38.3%]), with a mean age of 49.0⫾7.8 years (range, 20 – 64 years), who had at least 2 of 3 major symptoms of daytime somnolence, snoring, and apnea with witness (21–23), were included in this prospective study. Twen-ty-four habitual snorers (22 women [91.7%] and 2 men [8.3%]), with a mean age of 46.0⫾14.3 years (range, 21– 80 years), were studied as the control group. They were nonsomnolent patients
according to Epworth Sleepiness Scale (24), and their regular sleep partners stated that the patients did not exhibit apneas or hypopneas (10, 25). Both patients and controls underwent the same procedures. Informed consent was obtained from all patients, and the investigation protocol was approved by our institutional review board.
On physical examination, there were no nasal, oral, pharyn-geal, or mandibular abnormalities or diseases. Weight and height and neck circumference measurements were taken from all patients, and body mass index (BMI) was calculated by dividing each patient’s weight (in kilograms) by the square of his or her height (in meters). The patients with BMIⱖ30 were accepted as obese patients (5). All patients attending PSG were invited to undergo upper airway CT.
Polysomnography
Overnight PSG was performed in all patients by a comput-erized system and included the following variables: electroen-cephalogram, occulogram, submental and leg electro-myograms, electrocardiogram, and airflow (with an oronasal thermistor). Chest and abdominal efforts were recorded by using inductive plethysmography, arterial oxyhemoglobin satu-ration by pulse oximetry with a finger probe. Snoring sound was recorded with a microphone attached to the neck. All variables were recorded by using an 18-channel polysomnograph (Sleep Screen, Viasys Healthcare, Hoechberg, Germany). Sleep stages were scored according to the standard criteria of Rechtschaffen and Kales (26). Apneas were defined as complete cessation of airflowⱖ10 seconds and hypopneas as a reduction in oronasal airflow of⬎50% lasting forⱖ10 seconds. The apnea-hypopnea index (AHI) was defined as the number of apneas and hypop-neas per hour of sleep. Patients were grouped by their total AHI. These groups were mild/moderate OSAS—AHI 5–29.9 and severe OSAS—ⱖ30 (9).
CT
Head and neck CT (Toshiba Express TSX-011A; Toshiba, Tokyo, Japan) was performed in all patients while they were awake in the supine position with their heads in a neutral position (120 kV; 50 mA; section thickness, 5 mm; scanning time, 1 second; field of view, 400 mm; display matrix, 512⫻512 pixels). A lateral scout view was taken first to determine and standardize the level of the scans. Because the area of the pharyngeal airway changes during the respiration, we per-formed dynamic scans at the same anatomic level. Cross-sec-tional area of the airway at the level of oropharynx (level 1, tip of uvula) and hypopharynx (level 2, under the hyoid bone) were obtained in each phase of quiet tidal breathing, at the end of forced inspiration and at the end of forced expiration. Cross-sectional areas of the upper airway were manually measured by the same technician using electronic calipers (Fig 1A,-B).
Cephalometric measurements were made on the lateral scout view by the same radiologist (A.Y.), blinded to the clin-ical status of the patients, using an electronic cursor at the CT workstation. Six standard bony and soft-tissue measurements, most commonly reported to show changes in OSAS, were obtained (7, 9; Fig 2):
(1) MP-H distance—from the mandibular plane to the hyoid bone. The normal value is 15.4⫾3 mm (7).
(2) PNS-U distance—from the posterior nasal spine to the tip of the uvula, which provides a measure of the length of the soft palate. The normal value is 34⫾6 mm (7).
(3) SP-max—maximum thickness of the soft palate perpen-dicular to PNS-U.
(4) SNA, SNB, and ANB angles—S is the midpoint of the sella, N is the nasion, and A is the deepest point on the premaxillary outer counter; B is the deepest point on the outer mandibular contour. The normal value of ANB angle is 2° (7); SNA angle is 82°; and SNB angle is 80° (11).
Statistical Analysis
Statistical analysis was performed by using a SPSS version 10.0 statistical program (SPSS, Inc., Chicago). One-way ANOVA was used for comparison between the control group, the mild/moderate OSAS group, and the severe OSAS group. The paired samplesttest was used to compare variables in the 2 groups. The2test was used to analyze nominal data between
groups. The Pearson coefficient (r) was calculated to determine the correlation between 2 variables. All parametric results were expressed as mean⫾SD for each group. Local statistical signifi-cance was assumed asP⬍.05 for all parameters.
Results
Female-to-male ratios were 22/5 in the mild/mod-erate OSAS group and 7/13 in the severe OSAS group. In the control group, this ratio was 22/2. There was statistically significant difference among the groups (P⫽.000). All parameters of patients accord-ing to the stages of OSAS are summarized in Table 1. Twenty-seven patients (38%) were in the mild/mod-erate OSAS group, with an AHI value of 5–29.9; 20 patients (28%) were in the severe OSAS group, with
an AHIⱖ30. Patients with severe OSAS had signif-icantly narrower cross-sectional area at the level of uvula in expiration (Fig 3), longer MP-H and SP-max measurements compared with the patients with mild/ moderate OSAS (P ⫽ .007; P ⫽ .054; P ⫽ .010; respectively) and control groups (P⫽.036;P⫽.043; P⫽.043, respectively). Although MP-H distance did not show statistical difference, it was found to be increased in the severe OSAS group (P ⫽ .054). In addition, patients with severe OSAS had greater neck circumference than did the control group (P⫽.039). Although there was no statistical difference in the cross-sectional areas at the level of hypopharynx be-tween the groups, a gradual increase of the cross-sectional areas at this level was seen from the control group to the severe OSAS group, and it was the greatest in patients with severe OSAS (Fig 4).
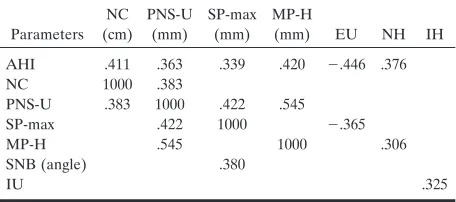
In the correlative study of AHI, neck circumfer-ence, cephalometric parameters, and upper airway size, we observed positive and negative correlations, which are shown in Table 2. The most striking points in the correlative study were that we found negative correlation between the cross-sectional area at the level of uvula in expiration and SP-max (P ⫽ .039) and AHI (P⫽.006). There were positive correlations between the cross-sectional areas at the level of uvula and hypopharynx in inspiration (P⫽ .018), and pos-itive correlation was also found between AHI and cross-sectional area at the level of hypopharynx in quiet tidal breathing (P⫽.007).
There was no significant difference among groups according to BMI (P⫽.357). There was a significant difference between male and female patients with OSAS. Although AHI (P ⫽ .000) and the measure-ments of MP-H (P ⫽ .000), PNS-U (P ⫽ .001), SP-max (P⫽ .002), and neck circumference (P ⫽ .004) were higher in men than in women, women had greater BMIs (P⫽.003) and ANB angles (P⫽.036) than men.
Discussion
Many investigators reported that the oropharyn-geal level was the narrowest region of the upper airway and this level was the most affected part of the pharynx in patients with OSAS (3, 4, 6, 9, 13, 18, 19, 27). Upper airway collapse almost always occurred at this level during apnea (3, 4, 6, 9, 10, 12, 13, 18, 19, 27, 28). Some previous studies showed this airway col-lapse during inspiration in OSAS (6, 12, 17). It was also shown that the maximum upper airway cross-sectional area was significantly greater during expira-tion than during inspiraexpira-tion in normal subjects (27). On the other hand, recent studies demonstrated that minimum upper airway area occurred at end of expi-ration and enlarged during inspiexpi-ration in patients with OSAS (14, 16, 27). The most important finding in our study was that the patients with severe OSAS had the narrowest cross-sectional area at the level of uvula in expiration. Akan et al (29) suggested narrow-ing of the oropharyngeal area at the end of expiration, which supports our findings. In our opinion, this sig-FIG 2. Lateral scout view showing skeletal and soft tissue
nificant narrowing at the level of uvula in expiration can be considered as a new key point of obstruction and can be a helpful diagnostic measure in severe OSAS. Recently, Avrahami et al (18) reported similar results and also suggested that a size of about 50 mm2 for the narrowest cross-sectional area of the orophar-ynx during quiet tidal breathing should be consistent with severe OSAS. According to this cut-off value, of our 20 patients with severe OSAS, a cross-sectional area ⬍50 mm2 at the level of uvula was found in 4
patients on expiration and in a single patient on in-spiration. None of them had the area at this level⬍50 mm2 during quiet tidal breathing. On the basis of these findings, we suggest that measurements should also be done in expiration.
The crucial question in the clinical assessment of the airway in OSAS is whether the collapse extends to the hypopharynx (7). We found a positive correlation between AHI and the cross-sectional area of the hy-popharynx in quiet tidal breathing. In addition, there was positive correlation between cross-sectional areas at the level of the uvula and hypopharynx in inspira-tion. It is interesting that, though it was not signifi-cant, a gradual increase of the mean cross-sectional areas at the level of hypopharynx was seen from control group to patients with severe OSAS, who had the largest area (Fig 4). Similar to our results, Polo et al (28) suggested that the hypopharynx diameter in patients with OSAS was larger than in healthy sub-jects, and this might have a great importance in the FIG 3. Mean cross-sectional areas at the level of uvula in tidal
breathing, at the end of both forced inspiration and expiration in each group.
[image:4.585.58.534.69.274.2]FIG 4. Mean cross-sectional areas at the level of hypopharynx in tidal breathing, at the end of both forced inspiration and expiration in each group.
TABLE 1: Parameters of patients according to stages of OSAS and control group
Parameters
Control Group
(n⫽24)
(mean⫾SD)
Mild/Moderate OSAS
(n⫽27)
(mean⫾SD)
Severe OSAS
(n⫽20)
(mean⫾SD)
P* Value
Age (y) 46.0⫾14.3 49.0⫾6.0 49.0⫾10.0 .533
BMI (kg/m2) 34.1⫾7.0 33.9⫾5.7 31.7⫾5.1 .357
Neck circumference (cm) 37.4⫾4.4 38.3⫾4.2 40.6⫾3.8 .043
AHI 2.1⫾1.4 13.9⫾6.7 50.8⫾15.6 .000
Uvula tidal breathing area (mm2) 233.2⫾89.9 224.7⫾68.6 202.8⫾76.7 .418
Uvula inspiration area (mm2) 215.2⫾94.3 247.4⫾107.6 205.7⫾146.7 .425
Uvula expiration area (mm2) 205.6⫾106.3 219.6⫾82.7 137.2⫾73.6 .007
Hypopharynx tidal breathing area (mm2) 349.2⫾117.8 257.1⫾88.7 366.2⫾137.2 .453
Hypopharynx inspiration area (mm2) 333.8⫾118.4 338.6⫾131.8 345.6⫾146.8 .698
Hypopharynx expiration area (mm2) 272.8⫾107.5 323.6⫾150.0 307.0⫾140.2 .344
MP-H (mm) 15.0⫾5.7 15.2⫾6.4 20.0⫾8.1 .029
PNS-U (mm) 35.0⫾3.6 34.9⫾4.1 37.5⫾6.1 .120
SP-max (mm) 10.0⫾2.0 9.6⫾2.2 11.6⫾2.2 .009
SNA (angle) 81.5⫾4.9 81.3⫾6.2 84.0⫾5.0 .211
SNB (angle) 79.3⫾4.0 79.1⫾5.1 81.1⫾5.3 .347
ANB (angle) 2.1⫾3.6 1.9⫾3.4 2.9⫾3.4 .628
Note.—OSAS indicates obstructive sleep apnea syndrome; AHI, apnea-hypopnea index; MP-H, distance from mandibulas plane to the hyoid bone; PNS-U, distance from the posterior nasal spine to the tip of the uvula; SP-max, maximum distance of the soft palate perpendicular to PNS-U; SNA, SNB, ANB, angles where S is the midpoint of the sella, N is the nasion, A is the deepest point on the premaxillary outer contour, and B is the deepest point on the outer mandibular contour.
[image:4.585.54.281.338.521.2] [image:4.585.305.534.339.522.2]development of apneas. Polo et al (28) also proposed that total obstruction of the pharynx appeared more frequently when a narrowed soft palate segment was associated with a large hypopharynx, as Lam et al (9) mentioned. Recently, Caballero et al (20) demon-strated the hypopharynx diameter in expiration was larger in the OSAS group than in the control group. Our findings support these investigators, because the patients with severe OSAS had the narrowest cross-sectional area at the level of uvula in expiration, whereas the cross-sectional hypopharynx area was the largest, though statistically insignificant.
AHI was correlated with cephalometric measure-ments such as MP-H, PNS-U, SP-max distances, and neck circumference in our study, as expected.
The position of the hyoid bone, which has an im-pact on the tongue shape and posture, affects the patency of the hypopharyngeal airway. Inferiorly po-sitioned hyoid bone in OSAS is well documented (1, 5, 7, 9). In our study, the position of the hyoid bone showed statistical difference, and it was more inferi-orly located in patients with severe OSAS than in those with mild/moderate OSAS or in the control group. In OSAS, MP-H distance value correlates with a high AHI independent from the BMI (7). We also found that the MP-H distance increased with increas-ing neck circumference, as reported elsewhere (5). In addition, uvula length and cross-sectional area at the level of the hypopharynx in quiet tidal breathing in-creased with increasing MP-H distance in our patients.
Both longer and thicker soft palate is commonly seen in patients with OSAS (5, 9, 11). In our study, severe OSAS patients had statistically significant thicker soft palate than did the mild/moderate OSAS and control groups. Our results showed that, though cross-sectional area at the level of uvula decreased in
expiration, both the severity of OSAS and soft palate thickness increased.
Obesity is a well-known risk factor for sleep-disor-dered breathing, and weight loss is associated with improvements in the degree of the disorder (30, 31); however, some patients with OSAS are of normal weight and physique (5, 8). In MR studies including obese subjects, it was shown that more fat was present surrounding the collapsible segment of the pharynx in patients with OSAS than without OSAS and with weight loss, upper airway volume significantly in-creased while the volume of the lateral pharyngeal wall and parapharyngael fat pads were decreased (32, 33). Contrary to these findings, Akan et al (29) and Schwab et al (34) did not ascribe any importance to the parapharyngeal fat pads in narrowing of the air-ways. In most the studies, however, OSAS patients had significantly higher BMI and larger neck size than did normal subjects (5, 8, 9). In our study, there were no significant differences among each group accord-ing to BMI, but patients with severe OSAS had sig-nificantly larger neck circumference than did other groups. We also found positive correlation between neck circumference and AHI, as reported elsewhere (5). Neck circumference, an index of local adiposity in the context of OSAS, has been shown to correlate with the size of the tongue and the soft palate and the position of the maxilla, mandible, and hyoid bone (5, 9, 11). Similar to these reports, we found positive correlation between neck circumference and both soft palate length and MP-H distance.
OSAS is more common in men than women, de-spite the fact that women with OSAS tend to be more obese and have smaller upper airways than men (2, 16, 35). We also noted this sex difference in our study, and men had significantly higher AHI than women, though BMI value was greater in women. In addition to these findings, the female-to-male ratio declined as the severity of the OSAS increased. In other words, severe OSAS was seen more commonly in men than in women. Men had significantly more predisposing factors than did women, including more inferiorly positioned hyoid bones, longer and thicker uvulas, and greater neck circumferences, as reported in OSAS elsewhere (5, 7, 9).
A more receded mandible and/or maxilla relative to the nasion, reflected by smaller SNB and SNA respectively, has been frequently cited as a contribut-ing factor to severity of OSAS (9, 11). We docu-mented an interesting finding that ANB angle was larger in women than in men. ANB angle measures discrepancies between the mandible and maxilla, so patients with a significant increase in the ANB angle (normal ANB angle, 2°) in general have a normal maxilla but a mandibular deficiency (7, 11).
[image:5.585.54.282.92.193.2]The limitation of our study was that we could per-form the CT examination on patients in awaking state; however, upper airway resistance increases dur-ing sleepdur-ing in normal subjects and patients with OSAS (1, 6, 9, 13, 36). It was shown with CT that the cross-sectional area of the airway in patients with OSAS was significantly decreased during sleeping or TABLE 2: Significant correlations among AHI, neck circumference,
cephalometric parameters, and upper airway size in patients with OSAS
Parameters NC (cm)
PNS-U (mm)
SP-max (mm)
MP-H
(mm) EU NH IH
AHI .411 .363 .339 .420 ⫺.446 .376
NC 1000 .383
PNS-U .383 1000 .422 .545
SP-max .422 1000 ⫺.365
MP-H .545 1000 .306
SNB (angle) .380
IU .325
Note.—Values are correlation coefficients. Significance is defined
asP⬍.05. AHI indicates apnea-hypopnea index; OSAS, obstructive
under hypnotic relaxation relative to similar measure-ments taken in the awake state (12, 19).
Conclusion
In severe OSAS, patients had significant differ-ences in the parameters. These parameters were cross-sectional area at the level of uvula in expiration, MP-H, and SP-max distances and neck circumfer-ence. Of these parameters, the measurement of cross-sectional area of oropharynx in expiration can be a helpful diagnostic measure to recognize severe OSAS as a new key point. Further dynamic studies with larger series are necessary to determine the relation-ship between severity of OSAS and oropharyngeal area in expiration.
References
1. Hui DSC, Ko FWS, Chu ASY, et al.Cephalometric assessment of
craniofacial morphology in Chinese patients with obstructive sleep apnoea.Resp Med2003;97:640 – 646
2. Woodson BT, Conley SF.Prediction of uvulopalatopharyngoplasty
response using cephalometric radiographs. Am J Otolaryng
1997;18:179 –184
3. Pepin JLD, Veale D, Ferretti GR, et al.Obstructive sleep apnea
syndrome: Hooked appearance of the soft palate in awake patients: cephalometric and CT findings.Radiology1999;210:163–170
4. Ja¨ger L, Gu¨nther E, Gauger J, Reiser M.Fluoroscopic MR of the
pharynx in patients with obstructive sleep apnea. AJNR Am J Neuroradiol1998;19:1205–1214
5. Battagel JM, Johal A. A cephalometric comparison of normal
weight and obese subjects with obstructive sleep apnoea. Radiog-raphy2000;6:283–292
6. Suratt PM, Dee P, Atkinson RL, et al.Fluoroscopic and computed
tomographic features of the pharyngeal airway in obstructive sleep apnea.Am Rev Respir Dis1983;127:487– 492
7. Pepin JL, Ferretti G, Veale D, et al.Somnofluoroscopy, computed
tomography, and cephalometry in the assessment of the airway in obstructive sleep apnoea.Thorax1992;47:150 –156
8. Johns FR, Strollo PJ, Buckley M, Constantino J.The influence of
craniofacial structure on obstructive sleep apnea in young adults.
J Oral Maxillofac Surg1998;56:596 – 602
9. Lam B, Ooi CGC, Peh WCG, et al.Computed tomographic
eval-uation of the role of craniofacial and upper airway morphology in obstructive sleep apnea in Chinese.Resp Med2004;98:301–307
10. Haponik EF, Smith PL, Bohlman ME, et al.Computerized
tomog-raphy in obstructive sleep apnea: correlation of airway size with physiology during sleep and wakefulness. Am Rev Respir Dis
1983;127:221–226
11. Paoli JR, Lauwers F, Lacassagne L, et al.Craniofacial differences
according to the body mass index of patients with obstructive sleep apnoea syndrome: cephalometric study in 85 patients.Br J Oral Max Surg2001;39:40 – 45
12. Stein MG, Gamsu G, Geer G, et al.Cine CT in obstructive sleep
apnea.AJR Am J Roentgenol1987;148:1069 –1074
13. Galvin JR, Rooholamini SA, Stanford W.Obstructive sleep apnea:
diagnosis with ultrafast CT.Radiology1989;171:775–778
14. Morrell MJ, Arabi Y, Zahn B, Badr MS.Progressive retropalatal
narrowing preceding obstructive apnea.Am J Respir Crit Care Med
1998;158:1974 –1981
15. Oda M, Suzuka Y, Lan Z, et al.Evaluation of pharyngolaryngeal
region with 3-D computed tomography. Int Congr Ser
2003;1257:281–287
16. Bhattacharyya N, Blake SP, Fried MP.Assessment of the airway in
obstructive sleep apnea syndrome with 3-dimensional airway com-puted tomography.Otolaryngol Head Neck Surg2000;123:444 – 449
17. Ell SR, Jolles H, Galvin JR.Cine CT demonstration of nonfixed
upper airway obstruction.AJR Am J Roentgenol1986;146:669 – 667
18. Avrahami E, Englender M.Relation between CT axial
cross-sec-tional area of the oropharynx and obstructive sleep apnea syn-drome in adults.AJNR Am J Neuroradiol1995;16:135–140
19. Avrahami E, Solomonovich A, Englender M.Axial CT
measure-ments of the cross-sectional area of the oropharynx in adults with obstructive sleep apnea syndrome. AJNR Am J Neuroradiol
1996;17:1107–1111
20. Caballero P, Alvarez-Sala R, Garcı´a-Rı´o F, et al.CT in the
evalu-ation of the upper airway in healthy subjects and in patients with obstructive sleep apnea syndrome.Chest1998;113:111–116
21. Woodson BT, Ledereich PS, Strollo P.Obstructive sleep apnea
syn-drome: diagnosis and treatment.Alexandria, VA: American Academy of Otolaryngology Head and Neck Surgery Foundation;1996:14 –56
22. Westbrook PR.Sleep disorders and upper airway obstruction in
adults.Otolaryngol Clin North Am1990;23:727–743
23. Simmons EB.Sleep apnea.In: English GM, ed.Otolaryngology.Vol
4. Philadelphia: Lippincott;1985:1–13
24. John MV.Sleepiness in different situations measured by the
Ep-worth Sleepiness Scale.Sleep1994;17:703–710
25. Gleadhill IC, Shwartz AR, Schubert N, et al.Upper airway
collaps-ibility in snorers and in patients with obstructive hypopnea and apnea.Am Rev Respir Dis1991;143:1300 –1303
26. Rechtschaffen A, Kales A.A manual of standardized terminology,
techniques, and scoring system for sleep stages in human subjects.Los Angeles: Brain Information Service, UCLA;1968
27. Schwab RJ, Gefter WB, Pack AI, Hoffman EA.Dynamic imaging
of the upper airway during respiration in normal subjects.J Appl Physiol1993;74:1504 –1514
28. Polo OJ, Tafti M, Fraga J, et al.Why don’t all heavy snorers have
obstructive sleep apnea?.Am Rev Respir Dis1991;143:1288 –1293
29. Akan H, Akso¨z T, Belet U¨ , S¸e°en T.Dynamic upper airway
soft-tissue and caliper changes in healthy subjects and snoring pa-tients.AJNR Am J Neuroradiol2004;25:1846 –1850
30. Suratt PM, McTier RF, Findley LJ, et al.Changes in breathing and
the pharynx after weight loss in obstructive sleep apnea. Chest
1987;92:631– 637
31. Smith PL, Gold AR, Meyers DA, et al.Weight loss in mildly to
moderately obese patients with obstructive sleep apnea.Ann Intern
Med1985;103:850 – 855
32. Welch KC, Foster GD, Ritter CT, et al.A novel volumetric
mag-netic resonance imaging paradigm to study upper airway anatomy.
Sleep2002;25:532–542
33. Horner RL, Mohiaddin RH, Lowell DG, et al.Sites and sizes of fat
deposits around the pharynx in obese patients with obstructive sleep apnoea and weight matched controls. Eur Respir J
1989;2:613– 622
34. Schwab RJ, Gupta KB, Gefter WB, et al.Upper airway and soft
tissue anatomy in normal subjects and patients with sleep-disor-dered breathing: significance of the lateral pharyngeal walls.Am J Respir Crit Care Med1995;152:1673–1689
35. Mohsenin V.Effects of gender on upper airway collapsibility and
severity of obstructive sleep apnea.Sleep Med2003;4:523–529
36. Skatrud JB, Dempsey JA.Airway resistance and respiratory