doi:10.4236/epe.2011.34068 Published Online September 2011 (http://www.SciRP.org/journal/epe)
Modified Shuffled Frog Leaping Algorithm for Solving
Economic Load Dispatch Problem
Priyanka Roy1, Abhijit Chakrabarti2 1
Electrical engineering Department, Techno India, Kolkata, India
2
EE Department, Bengal Engineering and Science University, Shibpur, Howrah, India E-mail: [email protected], a_chakrabarti55@yahoo.com
Received August 10, 2011; revised September 12, 2011; accepted September 24, 2011
Abstract
In the recent restructured power system scenario and complex market strategy, operation at absolute mini- mum cost is no longer the only criterion for dispatching electric power. The economic load dispatch (ELD) problem which accounts for minimization of both generations cost and power loss is itself a multiple con- flicting objective function problem. In this paper, a modified shuffled frog-leaping algorithm (MSFLA), which is an improved version of memetic algorithm, is proposed for solving the ELD problem. It is a rela-tively new evolutionary method where local search is applied during the evolutionary cycle. The idea of memetic algorithm comes from memes, which unlike genes can adapt themselves. The performance of MSFLA has been shown more efficient than traditional evolutionary algorithms for such type of ELD prob-lem. The application and validity of the proposed algorithm are demonstrated for IEEE 30 bus test system as well as a practical power network of 203 bus 264 lines 23 machines system.
Keywords:Economic Load Dispatch Modified Shuffled Frog Leaping Algorithm, Genetic Algorithm
1. Introduction
Economic load dispatch (ELD) is a familiar problem pertaining to the allocation of the amount of power to be generated by different units in the system on an optimum economic basis. The generated power has to meet the load demand and transmission losses. This implies that the dispatch at the true minimum cost requires that we take the network losses into account. Also for the secure operation of the power system, the generators must dis-patch in such a way so that the transmission capacity limits are not exceeded.
Many researches are involved to tackle the ELD prob-lem for significant economical benefit. Conventional methods such as lamda iteration method, gradient based method [1] are used to solve the ELD problem by changing the fuel cost curve in a piecewise linear func-tion or monotonically increasing funcfunc-tion. These meth- ods ignore the portion of incremental cost curve that are not continuous or monotonically increasing. But in- put-output characteristics of modern units are inherently non-linear because of ramp rate limits, valve point load- ings etc. So in classical method fuel cost curve is ap- proximated according to their requirement but use of
strategies. However with increase in system complexity and size, DE method is unable to map its entire unknown variables together, in an efficient way.
Recently, a new meta-heuristic algorithm called Shuf- fled Frog-Leaping Algorithm (SFLA) is introduced [11], it aims to model and mimic the behavior of frogs search- ing for food laid on stones randomly located in a pond. It combines the advantages of the genetic-based memetic algorithm (MA) and the social behavior-based Particle Swarm Optimization (PSO) algorithm and has found applications in areas such as optimizing bridge-deck re- pairs [12], materialized views selection [13], bi-criteria permutation flow shop scheduling problem [14], applica- tion to reservoir flood control operation [15] and a mixed-model assembly line sequencing problem [16].
This paper proposes a combined shuffled frog-leaping algorithm (SFLA) and a genetic algorithm (GA) that chooses genes (features) related to classification. It is named as modified shuffled frog-leaping algorithm (MSFLA) where two types of iterations (local and global search) are simultaneously performed to get better opti- mized value. In this method cross over operation has been implemented in both global and local iterations. Solving ELD problem using MSFLA technique is new and the application and validity of the proposed algo- rithm are demonstrated for IEEE 30 bus test system as well as for a practical power network of 203 bus 264 lines 23 machines eastern India grid system. It has been observed that compared to GA and common traditional method, MSFLA based ELD solutions yield better re- sults from economic point of view.
A brief description and mathematical formulation of ELD problem has been discussed in the following sec- tion. The concept of SFLA is discussed in section III while the respective algorithm and parameter setting of MSFLA has been provided in section IV. Simulation studies are discussed in section V and conclusion is drawn in section VI.
2.
Nomenclature
In the analytical model following symbols have been used:
m and n: Number of buses
ij
B : Loss coefficients for active power
: Power factor angles of bus load
: Phase angles of bus voltages
D
P : Real power demands
G
P : Real power outputs
L
P : Real loss .
ij
Suffix i stands for ith bus while suffix j stands for jth bus. The variables have been expressed in p.u. while the
angles have been expressed in degree
R : Series resistance of lines
3. Economic Load Dispatch
The aim of ELD is to optimize the cost function sub- jected to linear and non-linear equality and inequality constraints. The cost function
of an N-busi
total
c F
power system having NG number of fossil fuel units is given by
21 1
total i i i
NG NG
c c i G i G
i i
F F P P
P (1)unit of cost/hr,
The active loss is conventionally expressed using B-coefficient (or loss coefficient) matrix and can be rep- resented as [17],
1 1
00 0
1 1 1
n m
L Gi ij Gj
i j
n n m
i Gi Gi ij Gj
i i j
P P B P
B B P P B
(2)For a system of N-plants, the loss coefficients are given by [17]:
coscos cos
i j ij ij
i j i R B V V j (3) 00 1 1 n m
Di ij Dj i j
B P B
P and 0
PDj 1m
i ij ji
j
B B B
3.1. Power Balance
The total generating power has to be equal to the sum of load demand and transmission-line loss:
D L C O, (4)
where D is total load, L is transmission loss and C is generated power.
The transmission loss can be represented by the B- coefficient method as described in Equations (2) and (3).
3.2. Maximum and Minimum Limits of Power
The generation power of each generator has some limits and it can be expressed as
min max
i i
G G G
P P Pi (5)
4. Shuffled Frog Leaping Algorithm
wide scan of a large solution space and also a deep search of promising location for a global optimum which can not be solved by traditional optimization techniques. It combines the benefits of a gene-based memetic algo- rithm (MA) and social behavior-based particle swarm optimization (PSO). MA is a gene-based optimization algorithm similar to a GA. In a GA, chromosomes are represented as a string consisting of a set of elements called “genes.” Chromosomes in MA are represented by elements, called “memes.” MA and GA differ in one aspect, i.e. MA implements a local search before cross- over or mutations to determine offspring. After the local search, new offspring that obtains better results than original offspring, replaces original offspring and thus the evolutionary process continue. PSO is an evolution- ary algorithm in which individual solutions are called “particle” (analogous to the GA chromosome), but PSO does not apply crossover and mutation to construct a new particle. Each particle changes its position and velocity based on the individual particle’s optimal solution and the corporate optimal solution until a global optimal so- lution is found.
The SFLA is derived from a virtual population of frogs in which individual frogs are equivalent to the GA chromosomes and represent a set of solutions. Each frog is distributed to a different subset of the whole popula- tion, called a memeplex. An independent local search is conducted for each frog memplex and is called meme- plex evolution. After a defined number of memetic evo- lutionary steps, frogs are shuffled among memeplexes enabling frogs to interchange messages among different memplexes. This ensures that they move to an optimal position similar to particles in PSO. Local search and shuffling continue until defined convergence criteria are met.
SFLA have demonstrated effectiveness in a number of global optimization problems which are difficult to solve using other method viz. intelligent water drop technique [10].The detail steps involved in SFLA is given as under.
4.1. Initial Population
An initial population of P frogs is created randomly for a S-dimensional problem. A frog i is represented by S variables,
1 i1, i2, i3,
F f f f (6)
4.2. Sorting and Distribution
Frogs are sorted in descending order based on their fitness values. The entire population is then divided into m memeplexes, each containing n frogs (i.e., P= m × n ).
The first frog is distributed to the first memeplex, the
second frog to the second, the m frog to the m memeplex, and the m – 1 frog to the first memeplex and so on.
4.3. Memeplex Evolution
Within each memeplex, frogs with the best and the worst fitness are identified as Xb and Xw, and the frog with the
global best fitness is identified as Xg separately. To im-
prove upon the worst solution, an equation similar to PSO is used to update the worst solution, e.g., Equations (7) and (8):
Change in frog position
1rand . b
D X Xw (7)
New position Xw= current position (Xw + Di) (8)
Dmax D Dmax
where rand() is a random number between 0 and 1 and Dmax is the maximum change allowed in a frog’s posi- tion. If this process produces a better solution, it replaces the worst frog. If Equations (7) and (8) do not improve the worst solution, Xbof Equation (7) is changed to Xg
and adapted to Equation (9). Change in frog position
D1 rand
.Xg Xw (9)If Equations (7) and (9) do not improve the worst so- lution, then a new solution is randomly generated to re- place that worst frog.
4.4. Shuffling
After a defined number of memeplex evolution steps, all frogs of memeplexes are collected, and sorted in de- scending order based on their fitness. Step 2 divides frogs into different memeplexes again and then step 3 is per- formed.
4.5. Terminal Condition
If a global solution or a fixed iteration number is reached, the algorithm stops.
5. Programming Parameter and Algorithm
In MSFLA programming a number of parameters need to be adjusted to compute best optimal value of the vari- ables i.e., population size, number of memplexes, and number of global and local iteration.
crease in number of population means good accuracy but it will lead to more propagation delay. After running the program with different number of population size, it has been observed that for this optimization problem, typi- cally a population size of 100 is most suited for optimiz- ing both processing time and value.
2) Number of memplexes: In this programming, num- ber of memplexes is fixed at 10. As population size and number of memplexes are user input, the given input of number of memplexes is such that there exists a certain number of frogs (population size/total number. of mem- plexes) in each memplexes.
3) Number of global iteration: In this type of iteration, the cross-over between best frog & worst frog is done taking the whole population. One global iteration con- sists of local iterations as many as number of memplexes present. It is taken 10 here. Maximizing the number of global iteration gives more accurate results but it takes more time to process.
4) Number of local iteration: In this type of iteration, the cross-over between best frog & worst frog is done in every single memplexes. Number of local iterations are taken as 20 here. Maximizing the number of local itera- tions also gives more accuracy but it gives more delay.
All the MSFLA parameters value discussed above is for IEEE 30 bus test system.
Modified Shuffled Frog Leaping Algorithm Step 1: start
Step 2: population size (n), no. of memeplexes (m), number of local search within each memeplexes and num- ber of global search are given as inputs.
Step 3: generate population of frogs (F) randomly from the given data.
Step 4: evaluate fitness of F. Step 5: sort F in descending order.
Step 6: cross-over between worst frog (Fw) and best
frog (Fb) is done to get two new offsprings.
Step 7: replace Fb and Fw with two best frogs (ac-
cording to their fitness) from four frogs(two parents and two offsprings).
Step 8: partition F into m memeplexes such that each memeplexes gets (F/m) frogs.
Step 9: find Fb and Fw from each memeplexes and do
cross-over between them.
Step 10: get two new offspring from them and replace Fb and Fw with two best frogs(according to their fitness)
from four frogs.
Step 11: check whether number of local search is com- pleted or not, if not then go to step 9.
Step 12: if local search is completed then check whe- ther number of global search is completed or not, if not then go to step 5.
Step 13: if global iteration is completed then get the
best solution (best fitness) from F. Step 14: end.
It has been observed from the above algorithm that proposed MSFLA performs two simultaneous crossover, i.e., global (Step 6 and 7) and local (Step 9 and 10) search to produce new offspring which gives better result compared to SFLA.
6. Simulation
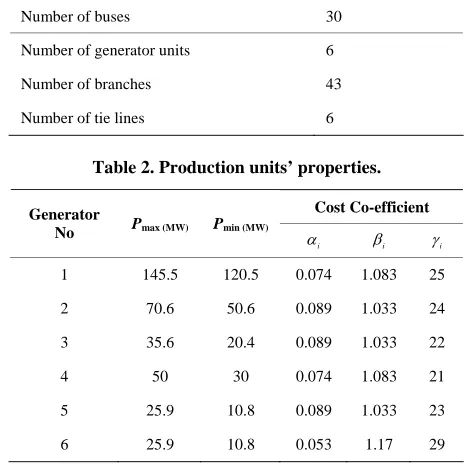
To examine the validity of MSFLA model for the ELD problem, IEEE 30 bus test system and a practical power network of 203 bus 264 lines 23 machines system have been considered. The result of proposed MSFLA model has been compared with GA based ELD result and classical iteration method. A reasonable B-loss coeffi- cient matrix of the system has been employed to calcu- late transmission loss. The detail calculation part of ELD problem is concentrated on IEEE 30 bus test system followed by the power scheduling of practical system. The test system and production units’ properties are given in Tables 1 and 2 for IEEE 30 bus system.
Table 3 shows different parameters of ELD schedul- ing of IEEE 30 bus test system with three computational techniques. It has been shown that compared to GA and classical method, MSFLA technique in respect to cost and power scheduling is better than the other two me- thods, though the computational time is more in MSFLA rather than GA. In MSFLA, cross over operation is per- formed in local as well as global iteration time where as in GA there is only one cross over operation. With re- spect to transmission loss, MSFLA computation yields
Table 1. Test system properties.
Number of buses 30
Number of generator units 6
Number of branches 43
[image:4.595.305.539.490.726.2]Number of tie lines 6
Table 2. Production units’ properties.
Cost Co-efficient Generator
No Pmax (MW) Pmin (MW)
i
i i
1 145.5 120.5 0.074 1.083 25
2 70.6 50.6 0.089 1.033 24
3 35.6 20.4 0.089 1.033 22
4 50 30 0.074 1.083 21
5 25.9 10.8 0.089 1.033 23
Table 3. Computation of best outputs of 6 units systems using different method.
Item (p.u. values) CLASSICAL
METHOD GA MSFLA
P1 1.3848 1.385 1.391
P2 0.5756 0.576 0.533
P3 0.2456 0.246 0.237
P4 0.35 0.35 0.368
P5 0.179 0.178 0.159
Generating power of 6 generating
unit
P6 0.1689 0.169 0.144
Total power (pu) 2.9039 2.904 2.832
Active loss (pu) 0.065 0.071 0.06
Cost of power (INR/hr) 147.2998 147.3 147.220 Processing time (Sec) 0.035 0.008 0.009
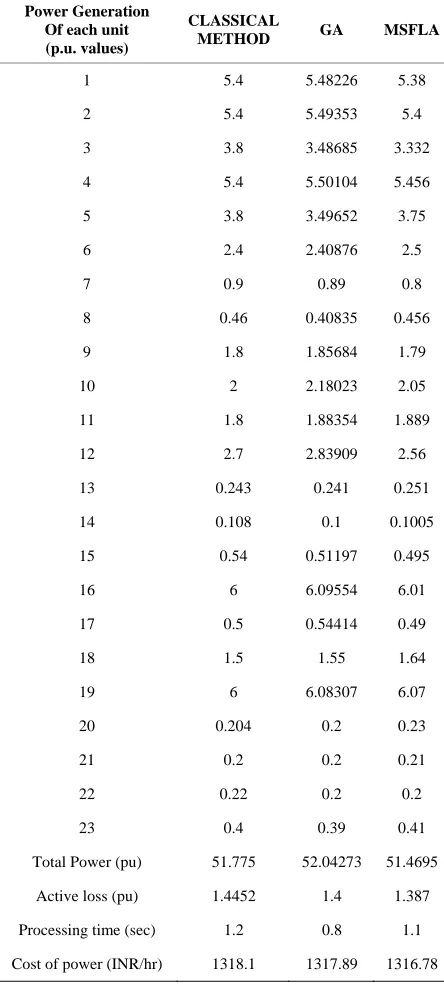
lower loss compared to classical method and GA. In Table 4, another simulation result has been shown where a practical power system having 203 buses, 264 lines, 23 machines of eastern grid of India is simulated using MSFLA, GA and classical method.
It has been observed from Table 4 that in a large system MSFLA based ELD scheduling still shows better result compared to GA and classical method. The total power generated using MSFLA being lesser in com- parison to compute power by other two methods, it is most logical that MSFLA technique provides a tool for reduction in total cost of generated power.
The advantages of MSFLA over the other methods are discussed below:
1) In MSFLA, two types of iterations (local and global search) are simultaneously performed to get better op- timized value whereas in GA there is only global search. MSFLA has the ability to reach global minima in a con- sistent manner with better convergence characteristic. In case of classical method only global search is performed.
2) In case of memory usage and time complexity, it has been observed from table III that MSFLA based solution takes more CPU time compared to GA based solution as two simultaneous iterations (global and local) are com- puted in MSFLA whereas GA based programming has been performed with single iteration. But in case of mini- mizing generation cost which is the main objective of ELD problem, MSFLA shows better result compared to GA and any other traditional method. More over trans- mission losses are also reduced using this method.
7. Conclusions
[image:5.595.312.534.108.601.2]In this paper economic load dispatch problem has been
Table 4. Computation of best outputs of 23 units system using different method.
Power Generation Of each unit (p.u. values)
CLASSICAL
METHOD GA MSFLA
1 5.4 5.48226 5.38
2 5.4 5.49353 5.4
3 3.8 3.48685 3.332
4 5.4 5.50104 5.456
5 3.8 3.49652 3.75
6 2.4 2.40876 2.5
7 0.9 0.89 0.8
8 0.46 0.40835 0.456
9 1.8 1.85684 1.79
10 2 2.18023 2.05
11 1.8 1.88354 1.889
12 2.7 2.83909 2.56
13 0.243 0.241 0.251
14 0.108 0.1 0.1005
15 0.54 0.51197 0.495
16 6 6.09554 6.01
17 0.5 0.54414 0.49
18 1.5 1.55 1.64
19 6 6.08307 6.07
20 0.204 0.2 0.23
21 0.2 0.2 0.21
22 0.22 0.2 0.2
23 0.4 0.39 0.41
Total Power (pu) 51.775 52.04273 51.4695
Active loss (pu) 1.4452 1.4 1.387
Processing time (sec) 1.2 0.8 1.1
Cost of power (INR/hr) 1318.1 1317.89 1316.78
MSFLA theory can be successfully applied to various practical power system optimization problems in the future.
8. Acknowledgements
The authors would like to thank Mr. Pritam Roy, Com- puter science department, Govt. College of ceramic tech-nology, for his relevant support related to the MSFLA programming.
9. References
[1] A. El-Keib, H. Ma and J. L. Hart, “Environmentally Constrained Economic Dispatch using the Lagrangian Relaxation Method,” IEEE Transactions on Power System, Vol. 9, No. 4, 1994, pp. 1723-1729.
doi:10.1109/59.331423
[2] Z. X. Liang and J. D. Glover, “A Zoom Feature for a Dynamic Programming Solution to Economic Dispatch including Transmission Losses,” IEEE Transactions on Power Systems, Vol. 7, No. 2, 1992, pp. 544-550.
doi:10.1109/59.141757
[3] T. Jayabarathi, G. Sadasivam and V. Ramachandran, “Evolutionary Programming based Economic dispatch of Generators with Prohibited Operating Zones,” Electrical Power System Research, Vol. 52, No. 3, 1999, pp. 261- 266. doi:10.1016/S0378-7796(99)00025-5
[4] J. B. Park, K. S. Lee, J. R. Shin and K. Y. Lee, “A Particle Swarm Optimization for Economic Dispatch with Non Smooth Cost Functions,” IEEE Transaction on Power Systems, Vol. 8, No. 3, 1993, pp. 1325-1332.
[5] W. M. Lin, F. S. Cheng and M. T. Tsay, “An Improved Tabu Search for Economic Dispatch with Multiple Mini- ma,” IEEE Transaction on Power Systems, Vol. 17, No. 1, 2002, pp. 108-112. doi:10.1109/59.982200
[6] N. Nomana and H. Iba, “Differential Evolution for Economic Load Dispatch Problems,” Electric Power Systems Research, Vol. 78, No. 8, 2008, pp. 1322-1331.
doi:10.1016/j.epsr.2007.11.007
[7] A. Bhattacharya and P. K. Chattopadhyay, “Biogeography- Based Optimization for Different Economic Load Dispatch Problems,” IEEE Transactions on Power Sys- tems, Vol. 25, No. 2, 2010, pp. 1064-1077.
doi:10.1109/TPWRS.2009.2034525
[8] P. H. Chen and H. C. Chang, “Large-Scale Economic Dispatch by Genetic Algorithm,” IEEE Transactions on Power System, Vol. 10, No. 4, 1995, pp. 1919-1926.
doi:10.1109/59.476058
[9] C.-T. Su and C.-T. Lin, “New Approach with a Hopfield Modeling Framework to Economic Dispatch,” IEEE Transaction onPower System, Vol. 15, No. 2, 2000, pp. 541-545. doi:10.1109/59.867138
[10] S. R. Rayapudi, “An Intelligent Water Drop Algorithm for Solving Economic Load Dispatch Problem,” Inter- national Journal of Electrical and Electronics Engi- neering, Vol. 5, No. 2, 2011, pp. 43-49.
[11] M. M. Eusuff and K. E. Lansey, “Optimization of Water Distribution Network Design Using the Shuffled Frog Leaping Algorithm,” Journal of Water Resources Plan- ning and Management, Vol. 129, No. 3, 2003, pp. 210- 225. doi:10.1061/(ASCE)0733-9496(2003)129:3(210)
[12] E. Elbeltagi, “A Modified Shuffled-Frog-Leaping Algo- rithm for Optimizing Bridge-Deck Repairs,” Interna- tional Conference on Bridge Management System Moni- taring, Assessment and Rehabilitation System, Cairo, 21- 23 March 2006.
[13] X. Li, X. Qian, J. L. Jiang and Z. Q. Wang, “Shuffled Frog Leaping Algorithm for Materialized Views Selec- tion,” 2010 Second International Workshop on Education Technology and Computer Science, Wuhan, 6-7 March 2010, pp. 7-10. doi:10.1109/ETCS.2010.480
[14] A. Rahimi-Vahed and A. H. Mirzaei, “Solving a Bi-Criteria Permutation Flow-Shop Problem using Shu- ffled Frog-Leaping Algorithm,” The International Jour- nal of Soft Computing—A Fusion of Foundations, Methodologies and Applications , Vol. 12, No. 5, 2010, pp. 435-452.
[15] Y. H. Li, J. Z. Zhou, Y. C. Zhang, H. Qin and L. Liu, “Novel Multiobjective Shuffled Frog Leaping Algorithm with Application to Reservoir Flood Control Operation,”
Journal of Water Resource Planning and Management, Vol. 136, No. 2, 2010, pp. 217-227.
[16] A. Rahimi-Vahed and A. H. Mirzaei, “A Hybrid Multi-Objective Shuffled Frog-Leaping Algorithm for a Mixed-Model Assembly Line Sequencing Problem,” Jour- nal ofComputers and Industrial Engineering, Vol. 53, No. 4, 2007.