PHYLOGENETICS RELATIONSHIP OF WILD BOARS (
1,*
Bayarlkhagva Damdin,
2Odbayar
Bayarlkhagva,
1
Department of Genetics and Molecular Biology, School of Biology and Biotechnology,
2Genetics laboratory of Institute of General and E
ARTICLE INFO ABSTRACT
Euroasian wild boar (
Africa in Scrub, forest, and arid environments. Even though wild boars are biologically and genetically well
subspecies of wild boars including
Mongolia based on their morphological differences
between those subspecies and compare geographically close popu mitochondrial DNA complete
neighboring countries from Genbank to do phylogenetic relationships. Wild boars’ tissue samples were collected from ten provinces throu
result of the research,
conclusion, this research proven that there are two subspecies of wild boars in Mongolia ac the mtDNA data. Although our data can be enough to provide that
criteria of Evolutionary Significant Unit (ESU), in future big sample size based on non sampling method from those populations will be use
Copyright © 2015 Bayarlkhagva Damdin et al. This
unrestricted use, distribution, and reproduction in any medium, provided the original work is properly cited.
INTRODUCTION
Wild boar has the widest natural range of any ungulate hoofed mammal, in the world. Outside of its natural range the wild boar has been introduced to many other parts of the
world. The wild boar (Sus scrofa) was classified as four
distinct subspecies in Europe, West Asia and Northwest Asia based on their morphological differences and geographical references (Genow, 1999; Groves ,1993). However, the genetic studies already resolved its taxonomy and classified more subspecies in Europe and Asia (Randi, 1995; Frantz, 2013; Watanobe, 1999). Although the most o
populations are studied well in Europe and Asia, the Mongolian wild boar populations are not well known genetically. Based on morphological data, two subspecies,
scrofa nigripes and Sus scrofa raddeanus (Sus scrofa sibiricus
are distributed in Mongolia (Shiirevdamba, 2013)
*Corresponding author:Bayarlkhagva Damdin,
Department of Genetics and Molecular Biology, School of Biology and Biotechnology, National University of Mongolia
ISSN: 0975-833X
Article History: Received 09th June, 2015
Received in revised form 21st July, 2015
Accepted 25th August, 2015
Published online 16th September,2015
Key words: Mitochondrial DNA, Wild Boar, Cytochrome b Gene, Mongolia
Citation: Bayarlkhagva Damdin, Odbayar Tumendemberel, Bayarmaa Gunaajav, Munkhjargal Bayarlkhagva, Oyuntsetseg Dashzeveg and Munkhbileg, E. 2015. “Phylogenetics relationship of wild boars (
Research, 7, (9), 19868-19873.
RESEARCH ARTICLE
PHYLOGENETICS RELATIONSHIP OF WILD BOARS (
SUS SCROFA
L. 1758
dbayar Tumendemberel,
1Bayarmaa Gunaajav,
Bayarlkhagva,
1Oyuntsetseg Dashzeveg and
1Munkhbileg
Department of Genetics and Molecular Biology, School of Biology and Biotechnology,
National University of Mongolia
Genetics laboratory of Institute of General and Experimental Biology, Mongolian Academy of Sciences
ABSTRACT
Euroasian wild boar (Sus scrofa) is widely distributed throughout Southern Europe, Asia, and North Africa in Scrub, forest, and arid environments. Even though wild boars are biologically and genetically well-studied worldwide, so far no genetic studies have been conducted in Mongolia. T subspecies of wild boars including Sus scrofa nigripis and Sus scrofa
Mongolia based on their morphological differences. Then we needed to test genetic differentiation between those subspecies and compare geographically close popu
mitochondrial DNA complete cytochrome b gene. We also retrieved sequences of wild boars in the neighboring countries from Genbank to do phylogenetic relationships. Wild boars’ tissue samples were collected from ten provinces throughout the distribution regions of wild boars in Mongolia. result of the research,Sus scrofa nigripis showed a significant genetic difference as a subspecies. In conclusion, this research proven that there are two subspecies of wild boars in Mongolia ac
the mtDNA data. Although our data can be enough to provide that
criteria of Evolutionary Significant Unit (ESU), in future big sample size based on non sampling method from those populations will be useful to identify the further questions.
This is an open access article distributed under the Creative Commons Att use, distribution, and reproduction in any medium, provided the original work is properly cited.
Wild boar has the widest natural range of any ungulate or hoofed mammal, in the world. Outside of its natural range the wild boar has been introduced to many other parts of the ) was classified as four distinct subspecies in Europe, West Asia and Northwest Asia orphological differences and geographical . However, the genetic studies already resolved its taxonomy and classified more (Randi, 1995; Frantz, 2013; . Although the most of the wild boar populations are studied well in Europe and Asia, the Mongolian wild boar populations are not well known
Based on morphological data, two subspecies, Sus
Sus scrofa sibiricus)
(Shiirevdamba, 2013).
Bayarlkhagva Damdin,
Department of Genetics and Molecular Biology, School of Biology and Biotechnology, National University of Mongolia.
Sus scrofa nigripes inhabits the forested regions of western
Mongolia, including Great Lakes Depression and western Mongol Altai Mountain Range, while
occurs in eastern parts of the country, including Khangai, Khuvsgul and Khentii mountain ranges, Ikh Khy Mountain Range and Mongol Daguur Steppe. In Mongolia, no data on population sizes are available at present, although it is known that threats, particularly exploitation is having a large impact upon this species, coupled with hybridization and habitat degradation (Dulamtseren, 2006)
an essential role in the ecosystem, because of its large size and frequent rooting for food.
estimated as four years, based on data from
exploitation is known to be causing a population decline, upon the availability of the data, this species may be re
as threatened under Criterion A. There is a small chance of immigration from adjacent populations of
although levels of hunting pressure on these populations are not known, therefore the assessment remains unchanged following application of regional criteria
Mitochondrial DNA (mtDNA) has been one of the most widely used molecular markers for phylogenetic stud
Available online at http://www.journalcra.com
International Journal of Current Research Vol. 7, Issue, 09, pp.19868-19873, September, 2015
INTERNATIONAL
Bayarlkhagva Damdin, Odbayar Tumendemberel, Bayarmaa Gunaajav, Munkhjargal Bayarlkhagva, Oyuntsetseg Dashzeveg and etics relationship of wild boars (Sus scrofa l., 1758) in mongolia”, International Journal of Current
z
L. 1758) IN MONGOLIA
Gunaajav,
1Munkhjargal
unkhbileg, E.
Department of Genetics and Molecular Biology, School of Biology and Biotechnology,
xperimental Biology, Mongolian Academy of Sciences
) is widely distributed throughout Southern Europe, Asia, and North Africa in Scrub, forest, and arid environments. Even though wild boars are biologically and studied worldwide, so far no genetic studies have been conducted in Mongolia. Two
Sus scrofa raddeanus are known in
Then we needed to test genetic differentiation between those subspecies and compare geographically close populations in Mongolia using gene. We also retrieved sequences of wild boars in the neighboring countries from Genbank to do phylogenetic relationships. Wild boars’ tissue samples ghout the distribution regions of wild boars in Mongolia. In showed a significant genetic difference as a subspecies. In conclusion, this research proven that there are two subspecies of wild boars in Mongolia according to the mtDNA data. Although our data can be enough to provide that Sus scrofa nigripis fits with the criteria of Evolutionary Significant Unit (ESU), in future big sample size based on non-invasive
ful to identify the further questions.
is an open access article distributed under the Creative Commons Attribution License, which permits
inhabits the forested regions of western Mongolia, including Great Lakes Depression and western
Mongol Altai Mountain Range, while Sus scrofa raddeanus
occurs in eastern parts of the country, including Khangai, Khuvsgul and Khentii mountain ranges, Ikh Khyangan Mountain Range and Mongol Daguur Steppe. In Mongolia, no data on population sizes are available at present, although it is known that threats, particularly exploitation is having a large impact upon this species, coupled with hybridization and (Dulamtseren, 2006). The wild boar fulfills an essential role in the ecosystem, because of its large size and Generation length has been estimated as four years, based on data from (Nowak, 1991). As s known to be causing a population decline, upon the availability of the data, this species may be re-categorized as threatened under Criterion A. There is a small chance of
immigration from adjacent populations of S. s. sibirica,
g pressure on these populations are not known, therefore the assessment remains unchanged following application of regional criteria (Dulamtseren, 2006). Mitochondrial DNA (mtDNA) has been one of the most widely used molecular markers for phylogenetic studies in INTERNATIONAL JOURNAL OF CURRENT RESEARCH
animals, because of its simple genomic structure
1989). Although mitochondrial DNA is only shows the maternal lineage far back in time, mtDNA is a highly sensitive for phylogenetic studies of closely related taxa or populations of a variety of species.
MATERIALS AND METHODS
Total 18 wild boars’ tissue samples were collected from ten provinces in Mongolia (Fig. 1 and Attachment
[image:2.595.84.514.190.408.2]The samples were preserved at -20°C. Total genomic DNA was extracted as follows: tissue samples were grinded in liquid nitrogen and lysed in a buffer (500 µL STE buffer (0.1 M NaCl, 10 mM Tris-HCl, 1 mM EDTA pH 8.0), 25 µL of 10
Figure 1. The Mongolian wild boar approximate distributions have been used from the from Mongolian Red book (Shiirevdamba, 2013)
19869 Bayarlkhagva Damdin et al. Phylogenetics relationship of wild boars (Sus scrofa L. 1758) in Mongolia
animals, because of its simple genomic structure (Kocher, mitochondrial DNA is only shows the mtDNA is a highly sensitive for phylogenetic studies of closely related taxa or populations
Total 18 wild boars’ tissue samples were collected from ten Attachment 1).
°C. Total genomic DNA was extracted as follows: tissue samples were grinded in liquid nitrogen and lysed in a buffer (500 µL STE buffer (0.1 HCl, 1 mM EDTA pH 8.0), 25 µL of 10
mg/mL of proteinase K, and 25 µL of 20% SDS) at 55 DNA was extracted with equal volumes of phenol:chloroform:isoamylalcohol, and then was precipitated with 2.5 volumes of 96% cold ethanol and 3M acetate Na.
entire cytochrome b gene was amplified with polymerase chain
reaction (PCR) using primers TGA CAT GAA AAA TC-3’ and
TTT TCT GGT TTA C-3’. The 20 µl of PCR reaction mix contained approximately 100 ng of genomic DNA, 10 each primer, 200 µM dNTPs, 1.5 mM MgCl
of iTaq DNA polymerase (Intron Biotechnology, Korea).
[image:2.595.118.472.451.682.2]PCR conditions were as follows: initial denaturation at for 2 min, 25 cycles of 94°C for 30 sec; 55°C for 1 min, 72°C for 2 min and final extension at 72°C for 10 min. products are sequenced with the PCR primer pair (Invitrogen)
Figure 1. The Mongolian wild boar approximate distributions have been used from the from Mongolian Red book (Shiirevdamba, 2013) and IUCN Red List report (Oliver, 2014)
Figure 2. Network analysis
Bayarlkhagva Damdin et al. Phylogenetics relationship of wild boars (Sus scrofa L. 1758) in Mongolia
mg/mL of proteinase K, and 25 µL of 20% SDS) at 55°, and DNA was extracted with equal volumes of phenol:chloroform:isoamylalcohol, and then was precipitated with 2.5 volumes of 96% cold ethanol and 3M acetate Na. The gene was amplified with polymerase chain
ing primers Cyt b F:5’-CAC GAC CAA
3’ and Cyt b R:5’-TGG CCC TCC
The 20 µl of PCR reaction mix
contained approximately 100 ng of genomic DNA, 10 M of
each primer, 200 µM dNTPs, 1.5 mM MgCl2, and 1.0 units
Taq DNA polymerase (Intron Biotechnology, Korea).
PCR conditions were as follows: initial denaturation at 94°C for 2 min, 25 cycles of 94°C for 30 sec; 55°C for 1 min, 72°C for 2 min and final extension at 72°C for 10 min. PCR products are sequenced with the PCR primer pair (Invitrogen)
and BigDye terminator v.2 cycle sequencing kit (Applied Biosystems) on ABI Prism 310 Genetic Analyzer (Applied Biosystems) according to the manufacturers’ specifications.
Data analysis
The sequences are edited using Geneious version 8.0.3
(Drummond et al., 2011) using with further modification by
eye and Codon Code aligner (www.codoncode.com). In total
20 DNA sequences from other geographical regions such as eastern and central China, eastern Russia, Korea, Japan, Tibet and western Europe were retrived from NCBI genbank.
(http://ncbi.nlm.nih.gov/ NCBI accession numbers:
AY237534; AF136547; AB015081; AF136549; AB015070; AM492581; DQ315603; AY634186; GU135689; GU135707; GU1357803; GU135820; JN601075; EF545584; HM010471;
AB015065; KC505406; KC493612) and red deer (Cervus
elaphus) was used as an outgroup and compared the sequences
of this study.
DNAsp 5 version (Rozas et al., 2003) was used to identify the
number of haplotypes from the new sequences and calculate genetic diversity among populations for mtDNA data. The network 4.6 version was used to see the relationship of the haplotypes. Phylogenetic and molecular evolutionary analyses
were conducted using MEGA version 6 (Tamura et al., 2013).
Phylogenetic trees were constructed with MEGA 6 using the Maximum Likelihood method based on the Kimura 2-parameter model (Kimura, 1980) with 1000 replications. Neighbor joining tree were also made, but it was similar with the result with the Maximum Likelihood tree. The pairwise
FST values between populations are calculated using Arlequin
3.1 (Excoffier, 2010).
RESULTS
Complete sequences of cytochrome b gene (1140 bp) of wild
boar (Sus scrofa L.) were determined. Base composition of
these sequences is guanine 13.69%; thymine 33.21%; cytosine 26.99%; and adenine 26.11% within Mongolian wild boar population. The number of variable sites within Mongolian wild boar population was 50. Wild boars population of north
western Mongolia (Sus scrofa nigripes) have 16 nucleotide
polymorphic sites including 9 transitions and 7 transversions comparing with other populations (Table 2). Published 16 sequences of wild boar mtDNA cytochrome b gene from Genbank and 18 nucleotide sequences of Mongolian wild boar samples were used for the phylogenetic analysis. We found totally 11 haplotypes out of 18 sequences of cytochrome b gene from Mongolia wild boar populations. Haplotype 1 (as shown H_1) has three individuals from Arkhangai, Tov and Uvurkhangai provinces. H20 is from Selenge which differ by only one nucleotide from H1.
[image:3.595.103.498.293.568.2]H2 (H_2) is the most common haplotype that occurs at the provinces of Arkhangai, Khovd-Jargalant, Selenge, Zavkhan. Therefore H2 occupied in the Chinese wild boar populations as well. H3 is from Dornod province at the eastern Mongolia. Although H4 differs from H2 by only one nucleotide (883th nucleotide) substitutions but we observed the haplotype from many places such as China, Taiwan, Vietnam, Japan, Russia, and Italy. Between all H5 and H15 are from Europe, China and Tibet but not found in Mongolia. H17, H18 and H19 are from Khuvsgul in North Mongolia and differ by 1-3 nucleotides substitutions. H21, H22 and H23 differ by many nucleotides substitutions (23-28 variable sites) from North and Western Mongolia.
Figure 2. Haplotypes relationships are shown using MJ (Median joining) network algorithm (Hans-Ju¨rgen Bandelt and Arne Ro¨hl , 1999)
Table 2 describtion: The molecular diversity index is
calculated in Arlequin 3.1 (Excoffier, 2010). Although
transversion mutation is higher in the population in North Mongolia (Khuvsgul), the mean ratio of transitions and transversions mutations is equal in within Mongolian wild boar populations. The number of polymorphic sites is slightly high in the wild boar population North Western Mongolia. The genetic distance is calculated by two different methods. The genetic distances on Table 1 is based on Kimura 2-parameter model (Kimura.M, 1980), table 2 is based on FST statistics
using Arlequin 3.1 (Excoffier, 2010).
Table 1 description: The pairwise genetics distances were statistically significant. Analyses were conducted based the Kimura 2-parameter model (Kimura.M, 1980) using MEGA6 (Tamura K., 2013). The analysis involved 36 nucleotide sequences. The wild boar population in North Western Mongolia showed 2.9-4% of genetic distance but pairwise genetic distances between other wild boar populations in Euroasia are a slight low (0.1-1.5%) based on complete
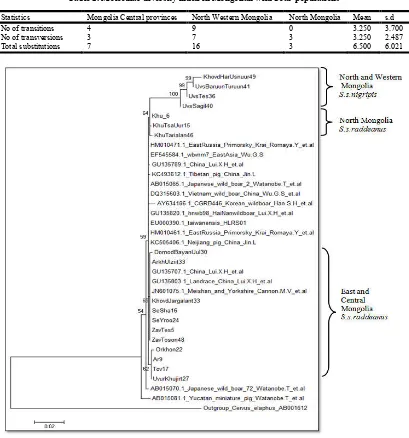
cytochrome b gene. Phylogenetic tree was constructed using
MEGA6 (Tamura K., 2013) based on Kimura two parameter method (Kimura.M, 1980) with 1000 repetitions. Outgroup
was used as red deer (Cervus elaphus).
Table 1.Distribution and frequency of haplotypes per location and domestic breed
# Locations/No of Haplotypes H1 H2 H3 H4 H5 H6 H7 H8 H9 H10 H11 Samples
1 Uvs 1 1 1 3
2 Khuvsgul 1 1 2
3 Khovd 1 1 1 3
4 Arkhangai 1 1 2
5 Zavkhan 2 2
6 Selenge 2 2
7 Uvurkhangai 1 1
8 Orkhon 1 1
9 Tuv 1 1
10 Dornod 1 1
[image:4.595.92.501.354.792.2]samples 3 6 1 1 1 1 1 1 1 1 1 18
Table 2. Molecular diversity index in Mongolian wild boar populations
Statistics Mongolia Central provinces North Western Mongolia North Mongolia Mean s.d
No of transitions 4 9 0 3.250 3.700
No of transversions 3 7 3 3.250 2.487
Total substitutions 7 16 3 6.500 6.021
DISCUSSION
Mongolia is a wide country that some mammals are distributed in different ecological and isolated in geographically. So it is important to determine the gene flow between populations and study the phylogenetic relationships of the isolated small populations of wild animals for their future conservation management. Based on the morphological and ecological differences, wild boars in Western Mongolia consider as a
different subspecies, Sus scrofa nigripis (Shiirevdamba, 2013).
Therefore wild boar included in the IUCN red list category of least concern species (Oliver, 2014), the Mongolian wild boar is near threatened and can be classified in the threatened species due to illegal hunting and livestock pressure. Central Mongolian populations also share a haplotype (H2) of
cytochrome b gene with the wild boar populations in China.
Larson et al., 2005 also found that central Chinese wild boar
populations share a few haplotypes of mtDNA control region with the southern Asian populations. Some authors (Fang M, 2006; Scandura, 2008) also found that asian mtDNA haplotypes were also found low frequency in some European wild boar populations. However, the absence of Mongolian wild boar haplotypes in the European wild boar populations (H5-H15) can be indicative of a limited historical gene flow.
Sequencing analysis of mitochondrial DNA cytochromeb gene
revealed comparatively high level of gene diversity in wild boar populations in Mongolia. The genetic pairwise distances (Kimura.M, 1980) between the wild boar populations in western Mongolia and other wild boar populations in Mongolia, South Asia and Europe showed a significant differentiation (2.9-4%) while pairwise genetic distances between the populations was a slight low as 0.1-1.5%. The MJ network also clearly shows that north western Mongolian population is differentiated from Central and North Mongolian populations. Another interesting thing is that the haplotypes of Khuvsgul is differentiated by 1-3 nuleotides but do not share with other populations in Mongolia which is indicating that that there is a low genetic flow.
Therefore phylogenetic tree also shows that western Mongolian wild boar population can be a different clade. The present study provides new insight into the genetic diversity of Mongolian wild boar populations and their relationships with other Euroasian wild boar populations. Thus, western
Mongolian population, Sus scrofa nigripis is genetically
isolated which is supporting the hypothesis of different subspecies. The present should be expanded to nuclear markers and to the Y chromosome with more sampling from each population in Mongolia.
Acknowledgements
This work has been done within the framework of the project
“The DNA barcoding of specific mammalian species in
Mongolia” supported by the Asia Research Center, Mongolia and Korea Foundation for Advanced Studies, Korea
REFERENCES
Dulamtseren, S. 2006. Mongolian red list of mammals. London, United Kingdom: Zoological Society of London. Excoffier, L. a. 2010. Arlequin suite ver 3.5: A new series of
programs to perform. Molecular Ecology Resources, 10 ,
564-567.
Fang, M.A.L. 2006. Mitochondrial diversity in European and Chinese pigs is consistent with population expansions that
occured prior to domestication. Proceedings of the Royal
Society of London Series B, Biological Sciences, 273,
1803-1810.
Frantz, A.C. 2013. Genetic evidence for introgression between domestic pigs and wild boars (Sus scrofa) in Belgium and Luxembourg: a comparative approach with multiple marker
systems. Biological Journal of the Linnean Society, 110,
no. 1, 104-115.
Genow, P. V. 1999. A review of the cranial characteristics of the Wild Boar (Susscrofa Linnaeus 1758), with systematic
conclusions. Mammal Review, Volume 29, Issue 4,
[image:5.595.113.486.80.190.2]205-234.
Table 3. Pairwise genetic distance among populations based on mtDNA complete cytochorome b gene
1 2 3 4 5 6 7 8 9
1.North West Mongolia
2. North Mongolia 0.029
3. Central Mongolia 0.031 0.004 4.Central and East Mongolia 0.030 0.003 0.003
5. China 0.029 0.002 0.003 0.001
6. Russia 0.029 0.002 0.002 0.001 0.001 7. Tibet 0.030 0.003 0.003 0.002 0.001 0.001 8. Korea 0.033 0.006 0.007 0.006 0.005 0.004 0.005 9. Japan 0.030 0.004 0.004 0.003 0.002 0.002 0.003 0.006 10. Europe 0.040 0.013 0.013 0.012 0.012 0.011 0.012 0.015 0.011
Table 4. Population pairwise FSTs
1 2 3
1.Central Mongolia
2. Mongolia 0.60068*
3. North Western Mongolia 0.84499* 0.88057*
4. North Mongolia 0.75000 0.49629* 0.80992* *- values are statistically significant.
Groves, C. P. 1993. The Eurasian suids: Sus and Babyrousa.
"Pigs, Peccaries and Hippos–Status Survey and
Conservation Action Plan, 107-111.
Hans-Ju¨rgen Bandelt and Arne Ro¨hl. 1999. Median-Joining
Networks for Inferring Intraspecific. Molecular Biology
Evolution, 16, 37-48.
Kimura, M. 1980. A simple method for estimating evolutionary rate of base substitutions through comparative
studies of nucleotide sequences. Molecular Evolution, 16,
111-120.
Kocher, T. D. 1989. Dynamics of mitochondrial DNA evolution in animals: amplification and sequencing with
conserved primers. Proceedings of the National Academy
of Sciences, 6169-6200.
Nowak, D. 1991. Urban forest development and structure analysis of Oakland, California. Ph.D. Dessertation. New York: University of California.
Oliver, W. a. 2014. Sus scrofa. The IUCN Red List of Threatened Species. <www.iucnredlist.org>.
Randi, E. 1995. "Conservation genetics of the genus Sus.".
Ibex Journal of Mountain Ecology 3, 6-12.
Rozas. J, Juan C. S, Xavier. M, Rozas R., 2003. “DnaSP, DNA polymorphism analyses by the coalescent and other
methods” . Bioinformatics, 19.18, 2496-2497.
Scandura, M. I. 2008. Ancient vs. recent processes as factors shaping the genetic variation of the European wild boar: are the effects of the last glaciation still detectable? Molecular ecology, 17(7), 1745-1762.
Shiirevdamba, 2013. Mongolian Red Book. Ulaanbaatar:
Mongolian Ministry of Environment and Green
Development.
Tamura K., S.G. 2013. MEGA6: Molecular Evolutionary Analysis version 6.0. Molecular Biology and Evolution 30 , 2725-2729.
Watanobe, T. O. and Watanobe, T., et al. 1999. "Genetic
relationship and distribution of the Japanese wild boar (Sus scrofa leucomystax) and Ryukyu wild boar (Sus scrofa riukiuanus) analysed by mitochondrial DNA. "Molecular Ecology 8.9, 1509-1512.