ISSN Online: 2327-4085 ISSN Print: 2327-4077
DOI: 10.4236/jmmce.2018.66044 Nov. 23, 2018 618 J. Minerals and Materials Characterization and Engineering
Role of Metallurgy in the Localized Corrosion of
Carbon Steel
Recep Avci
*, Bret H. Davis, Nathaniel Rieders, Kilean Lucas, Manjula Nandasiri, Dave Mogk
Imaging and Chemical Analysis Laboratory, Montana State University, Bozeman, MT, USA
Abstract
Localized residual strain develops within the metallurgical texture of 1018 carbon steel from metallurgical processes, such as fabrication, annealing, and shaping. This residual strain results in accelerated localized pitting due to the formation of anodic sites at these locations. Once initiated, micron-sized corrosion pits can coalesce to form sites of potential catastrophic failure. In this contribution, we focus on the localized biocorrosion which initiates and grows in areas of localized strain such as the interfaces between manganese sulfide (MnS) inclusions and ferrite grains in the steel, at grain boundaries between ferrite grains with different crystallographic orientations and at pearlite grains (intergrown cementite (Fe3C) and ferrite), which are readily
found in 1018 carbon steel. Here we hypothesize and show experimentally that accelerated biocorrosion in 1018 carbon steel finds its roots in the elec-trochemical potential difference (micro galvanic cells) generated between the unstrained ferrite iron (α−Fe) and the lattice defects, dislocations and
mis-matches found at interfaces formed between α−Fe and secondary phases
i.e. MnS inclusions, cementite lamellar structures and grain boundaries dis-tributed throughout the 3D network of the carbon steel. This hypothesis is supported by results from multiple micro- and nanoscale imaging and ana-lytical methods obtained from field emission scanning electron microscopy, energy dispersive spectroscopy, electron backscattered diffraction and Auger nanoprobe electron spectroscopy. The morphology and composition of grains in the steel coupons were characterized before and after exposure to suboxic and sulfidogenic environments dominated by aerobic and anaerobic marine organisms. Corrosion processes are demonstrated to initiate in loca-lized areas of high residual strain.
Keywords
Metallurgy, Strain, Dislocations, Carbon Steel, Micro Galvanic Cell, Suboxic, Sulfidogenic, MnS, Pearlite, Cementite, Grain Boundary
How to cite this paper: Avci, R., Davis, B.H., Rieders, N., Lucas, K., Nandasiri, M. and Mogk, D. (2018) Role of Metallurgy in the Localized Corrosion of Carbon Steel. Journal of Minerals and Materials Charac-terization and Engineering, 6, 618-646. https://doi.org/10.4236/jmmce.2018.66044
Received: October 9, 2018 Accepted: November 19, 2018 Published: November 23, 2018
Copyright © 2018 by authors and Scientific Research Publishing Inc. This work is licensed under the Creative Commons Attribution International License (CC BY 4.0).
DOI: 10.4236/jmmce.2018.66044 619 J. Minerals and Materials Characterization and Engineering
1. Introduction
Low-carbon steels have a commanding presence in our society because of the near universality of steel as a building material in historical and modern infra-structures. Its degradation and eventual failure due to corrosion are of great concern and costly; the annual direct and indirect cost of corrosion in the USA is ~6% of the US gross national product, ~1 trillion dollars [1] [2]. Often the fail-ure in a piece of steel is due not to loss of metal caused by generalized corrosion, but to localized destruction of metal caused by accelerated corrosion. In practice, metals are alloyed with appropriate elements to increase their strength, mallea-bility and weldamallea-bility, which inherently creates dislocations and inclusions in the crystal matrix; this causes a distribution of localized plastic deformations in the lattice. This residual strain creates enhanced anodic sites, where the constituent metal atoms are more susceptible to dissolution and subsequent localized corro-sion [3] [4] [5]. We investigated three very important examples of localized cor-rosion on the surface of 1018 carbon steel coupons: 1) the immediate surround-ings of manganese sulfide (MnS) inclusions, 2) grain boundaries between grains of different crystallographic orientations, and 3) ferrite layers in and around pearlite lamellae. These are all examples of sites of lattice defects and strains that developed during the metallurgical processing of the metal. Such metallurgical nano/microstructures play a detrimental role in the localized corrosion of car-bon steel. Any coating technology, be it polymer paints, next generation thin films such as graphene, passive layers or corrosion inhibitors, must coat these structures at the nanoscale in order to prevent localized corrosion.
Brief Review of Carbon Steel Metallurgy in Relation to This Work
To examine the impact that MnS, pearlite, and grain boundaries, herein referred to as “microstructures”, have on the corrosion of low-carbon steel (0.05 - 0.25 wt% C), one must begin with the metallurgical history of the steel, in particular of carbon steel, which starts as iron ore which is reduced, purified, heat-treated and alloyed with a small amount of impurities (most notably carbon and Mn) to control its hardness, malleability, ductility, weldability and tensile strength [6] [7]. The formation of microstructures during fabrication is controlled by three primary factors: 1) the chemical composition (weight percent of carbon, sulfur impurity, and Mn); 2) the temperature history (heating and annealing) of the steel; and 3) the metalworking (cold and hot rolling) history.
DOI: 10.4236/jmmce.2018.66044 620 J. Minerals and Materials Characterization and Engineering
crushed iron ore, treated coal (or metallurgical coke, which is a purified carbon with minor pollutants), and limestone (i.e. CaCO3). These three components are
carefully fed into the blast furnace to reduce and purify the iron oxides. The blast furnace is a hot, pressurized environment enabled by the oxidation of C reacting with O2 in the hot air blowing into the mixture. This provides an environment
for endothermic reactions, such as Fe O 3C2 3+ →2Fe 3CO+ , which scavenges O from Fe O2 3, reducing the Fe3+ to its elemental form. The C in the coke has two functions: it reacts with the O2 in the hot air and produces heat as a result of
exothermic reaction 2C O+ 2→2CO, and it reacts with iron oxides to reduce the iron to its elemental form. During this step many of the impurities separate from the resultant molten iron mixture in their own solid or liquid phase, collec-tively referred to as “slag,” and float over the molten iron. Meanwhile, the semi-clean iron obtained during this intermediate state, called “molten” or “pig” iron, is collected separately for the next step of purification. The most important next step of refinement takes place in the basic oxygen furnace. At this stage molten iron mixed with recycled steel is subjected to further purification and re-fining by pure hot oxygen being blown into the mixture of molten iron and lime flux at temperatures reaching ~1600˚C. This oxidizes and removes S, P, C, Si and other impurities left behind in the pig iron. Subsequently, purified liquid Fe is subjected to ladle metallurgy, in which the quality of the final product is con-trolled through the addition of appropriate alloying elements (such as C) and sulfur scavengers such as Mn that react with the unwanted S from the steel ma-trix. The final product (in the molten state) is treated further with inert gasses in a vacuum tank to remove remaining dissolved air gasses from the molten steel. The resultant steel is cast into steel blocks for further hot and cold rolling processing.
During the solidification process Mn and S combine into highly malleable MnS inclusions. These inclusions turn into long, thin MnS stringers during the hot rolling process. Cu S2 inclusions also form long, thin stringers. These have serious implications for pitting corrosion as discussed below. Subsequent hot rolling of steel gives the end product its shape, be it sheet metal or a steel bar. In some cases, before it becomes a finished product steel is subjected to cold work-ing (cold rollwork-ing) to improve thickness tolerance, ductility and hardness. There are a large number of carbon steels, classified broadly as low-carbon, mild car-bon and high-carcar-bon steels. Very high-carcar-bon steels (cast iron) are too hard and brittle to be considered ductile enough for structural applications. The majority of steels used in industry are low-carbon steels containing up to 0.25 wt% C. The work reported in this manuscript corresponds to 1018 carbon steel containing ~0.18 wt% carbon. The annealing and cold working of carbon steel determine its hardness and ductility, as well as the formation of pearlite bands in the finished product [6].
DOI: 10.4236/jmmce.2018.66044 621 J. Minerals and Materials Characterization and Engineering
the metal, giving rise to red-short, hot-short or sulfur embrittlement. For exam-ple, it has been shown that plastic failure increases with increasing sulfur content
[9]. This is dealt with in the desulfurizing step in iron refining mentioned above and by trapping residual sulfur in less soluble inclusions such as MnS [9]. To date, the most effective scavenger of sulfur that does not compromise the me-chanical integrity of the steel is manganese; calcium and copper are other fa-vored sulfur-trapping elements. Manganese is added in excess of sulfur by a fac-tor of at least 15 - 30 in low-carbon steels, and even more in specially desulfu-rized steels.
During the final stages of the hot rolling and annealing process, the metal is transformed from the austenitic (γ-Fe) to the ferrite (α-Fe) phase at around 727˚C. The importance of this transition is that in γ-Fe the C occupies the in-terstitial positions in the fcc lattice, while in α-Fe the C atoms segregate into pearlite phases [10]. Here, the C is locked into the Fe3C cementite structure in
the form of the lamellar structure of the pearlite phase. Pearlite is made up of repeated submicron-thick layers of cementite and ferrite lamellae. The ferrite structure in pearlite is expected to be highly strained because of lattice mismatch and the presence of large surface areas of cementite/ferrite interfaces. In fact, we hypothesize that pearlite phases are highly strained and are susceptible to loca-lized corrosion [11]. The rate of cooling during the rolling process is one of the many factors that dictate what microstructure will form in the metal and how it will do so, which in turn determine many of the mechanical and corrosion properties of the steel. For example, pearlite bands, often observed in low-carbon steel, are formed during the hot rolling process, as the steel transitions from the austenite to the ferrite phase. Under the high pressure of the rolling process, pearlite bands stretch along the rolling axis, as do MnS inclusions at higher temperatures [12].
Figure 1 shows a Fe-C phase diagram of carbon steel within the carbon
DOI: 10.4236/jmmce.2018.66044 622 J. Minerals and Materials Characterization and Engineering
Figure 1. Iron-carbon phase diagram for a hypoeutectoid steel (<0.76 wt% carbon) for temperatures below the liquidus line. The composition of 1018 steel (0.18 wt% carbon) is indicated by a dashed line. The two iron/carbon phases (i.e. austenite and ferrite) are indicated, as are important phase transition temperatures pertaining to 1018 steel.
α-Fe and γ-Fe whose composition is determined by lever rule. Most of the C is randomly distributed in the γ-Fephase, which is distributed interstitially in the fcc lattice; some of the C may already have started forming the carbide phase and be residing in the α-Fe. However, when the temperature is reduced slowly below 727˚C , where there is no γ-Fe left in the mixture and all the Fe is now bcc α-Fe, the majority of the carbon atoms are locked into the pearlite phase, a mixture of Fe3C (iron carbide) layers and α-Fe iron layers with submicron-thick lamellar
structures. Depending on the temperature, very limited amounts of C reside in-terstitially in the α-Fe; these are eventually reduced to a negligible amount as the temperature approaches room temperature. At this temperature almost all the carbon in low-carbon steel is locked into the Fe3C (cementite) phase. Cementite
is a very hard carbide, and in alternating layers with strained ferrite [3] [4] [5]
produces the well-known pearlite lamellar structure. In this manuscript we make a distinction between the two ferrite phases in the carbon steel; the thin layers of ferrite phase squeezed between two Fe3C cementite layers are expected and
hy-pothesized to be highly strained because of lattice mismatch between the bcc
α-Fe and the orthorhombic cementite structure. While the ferrite crystals mak-ing up the majority of the steel will be relaxed within the grains, atoms residmak-ing at the grain boundaries will be strained because of lattice mismatch. These two ferrite structures (strained and unstrained) corrode at different rates as will be shown below.
DOI: 10.4236/jmmce.2018.66044 623 J. Minerals and Materials Characterization and Engineering
steel cools and solidifies, MnS inclusions are formed at a number of stages and in a variety of morphologies [12]-[21]. These sulfide inclusions form where the matrix is most amenable to their presence because of coherency between the phases of the inclusion and the surrounding iron matrix. The precise details of this are largely controlled by the temperature history and chemical composition of the steel, especially its sulfur concentration. The precipitation behavior of manganese sulfide in mild carbon steel is discussed by Ito et al.[16]. The various forms of MnS inclusions precipitate at different stages during the metallurgical process and nucleate at specific sites as well as exhibiting unique physical cha-racteristics in terms of size and shape. Work conducted on some of the MnS in-clusions in our 1018 carbon steel coupons suggests the phase of some of these inclusions is fcc cubic symmetry belonging to space group (SG) 255 with m3m symmetry.
Here, the term “MnS inclusions” has been adopted loosely to describe sec-ondary phases whose elemental composition is dominated by Mn and S. A com-prehensive characterization of these inclusions has been lacking. Investigations of the surface and bulk composition, as well as considerations of crystalline structure and the identification of phases, show that these inclusions are com-plex and heterogeneous. The bulk composition of these inclusions was found in many cases to include Cu, Fe, Ca, Ti and Si. Surface-sensitive techniques showed that some inclusions are covered with a thin (5 - 20 nm) layers of copper sulfide, Mn oxide and FeS, which could result in drastically different electrochemical behavior. It has become clear that the term “MnS inclusion” is a broad generali-zation. These issues are addressed in our recent work under preparation for pub-lication [22].
Some groups [23] [24] [25] [26] [27] have claimed that it is the size, distribu-tion, and type of MnS inclusions that take shape which will largely determine the corrodibility and strength of the steel. The nucleation and formation of these in-clusions occur at austenitic Fe temperatures (recall the melting temperature of MnS is 1617˚C) and before the termination of the hotrolling process.
Consequently, the hotrolling results in the inclusions being stretched into long stringers extending hundreds of microns along the rolling axis [12] [28]. The lat-tice mismatch between the MnS inclusions and ferrite iron creates long lines of enhanced strain permeating deep into the material along and around the MnS inclusions. Other inclusions such as silicon oxide are less malleable, retain their spherical shape, and do not become elongated along the rolling direction.
DOI: 10.4236/jmmce.2018.66044 624 J. Minerals and Materials Characterization and Engineering
superimposed along the rolling direction, which has deleterious implications in the corrosion of steel. MnS stringers will form in γ-Fe (austenite) and persist in
α-Fe, but pearlite bands can only take form at lower temperatures (below 725˚C), where α-Fe (ferrite) can exist. After hotrolling, some steels are further cold-worked in order to bring them into final dimensional specifications and improve some metallurgical properties, such as hardness. In some cases, steel can be annealed by heating above the transition temperature (to the γ-phase) and cooling back slowly to room temperature. Without the help of hot rolling the pearlite structures are expected to be randomly distributed during the γ to α
transition. Furthermore, the pearlite bands formed during cold rolling at room temperature might not be as distinct as those obtained as a result of hot rolling below the transition temperature (~725˚C).
The three basic microstructures—MnS, pearlite grains, and grain bounda-ries—all have been known to cause corrosion in the form of pits, cracks or blis-ters and to contribute to the accelerated localized corrosion of carbon steel. Manganese sulfide inclusions have been observed as crack initiation sites and zones of mechanical weakness [13]. These are attributed to the manganese sul-fide inclusions being more plastic than the surrounding iron matrix. Also re-sponsible is weak bonding between the inclusions and the iron matrix.
Manganese sulfide inclusions have been widely reported to be the sites of hy-drogen-induced cracking and hydrogen blistering. Luu and Wu [29] used elec-trochemical permeation measurements and hydrogen microprint techniques to determine that the main diffusion path of hydrogen in mild carbon steel is along the MnS stringers in the interface between the Fe-lattice and the immediate sur-roundings of MnS stringers. Ju and Rigsbee performed a series of experiments
[30] [31] [32] in which they cathodically hydrogen-charged low-carbon steels in
the absence of external stress, examined the consequent hydrogen damage using scanning electron and optical microscopy, and observed whether or not the mi-crostructure was enhanced within the steel by the heat treatment. They found that damage occurred preferentially at grain boundaries, at the interphase boundary between ferrite and carbide in pearlite, and at the interfaces of fer-rite/MnS inclusions. The damage occurred as blisters and cracks. Hydro-gen-induced dislocations were found to stack up at the same sites.
dis-DOI: 10.4236/jmmce.2018.66044 625 J. Minerals and Materials Characterization and Engineering
tribution as being the primary contributor to the severity of the pitting. This idea—that the more inclusions there are per unit area, the more severe the cor-rosion will be in that area—is supported by the work of Sephton [33] and Krauss
[12]. Reformatskaya [34] claims that the severity of corrosion at MnS inclusions is dictated by the phase structure of the inclusion and how coherent it is with the surrounding matrix, rather than by the chemical composition of the inclusion. Wranglen [35], too, suggests that “active” inclusions corrode more readily than “inactive” ones. He suggests that pitting is initiated in the matrix immediately surrounding an inclusion by a fine dispersion of sulfide nanoparticles that in-fects the iron matrix, making it less noble than the inclusion itself and the bulk steel. The pit propagates because a concentration cell is created in the pit that is high in acid and salt and low in oxygen, relative to the bulk solution.
Research on the corrosion of carbon steel around MnS inclusions and at phase boundaries in the crystalline structure (i.e. pearlite and grain boundaries) has largely ignored the residual strains inherent in these structures. Instead, the se-verity of the corrosion, in the case of MnS inclusions and other sulfides, has been attributed to the chemical composition of the inclusion, the local density of in-clusions, or the difference in mechanical properties between the sulfide and the surrounding iron matrix. The facilitation of hydrogen transport at the phase boundaries between inclusions and the iron matrix, or between different phases present in pearlite or at grain boundaries, plays a key role as well. In this manu-script we hypothesize and show experimentally that the unifying concept in all these corrosion processes lies in the imperfections in the ferrite lattice. Residual strain is a fundamental property of the imperfect crystalline structure of metals, full of impurities and inclusions, and the other effects mentioned in the litera-ture largely cascade from this one fundamental fact.
There are a number of ways to prevent localized corrosion in practice. One of these preventive measures is to coat surfaces with polymers or other materials and thin films [36]-[45]. However, these coatings have limited usefulness if the coating material does not cover the surface uniformly at the nanoscale. Loca-tions exposed to a corrosive medium lead to rapid localized corrosion with ma-croscopic pits. In particular, if the paint does not uniformly coat [37] the surface defects such as MnS inclusions and their immediate surroundings it leads to lo-calized pitting due to exposure to a corrosive environment. The main objective of this paper is to explore the role of metallurgy in the corrosion process. This is accomplished by stripping the corrosion products from the surface and observ-ing changes in the underlyobserv-ing carbon steel. Experiments concernobserv-ing the rate of corrosion, which is highly dependent on the corrosion medium, will be pub-lished elsewhere.
2. Methods
DOI: 10.4236/jmmce.2018.66044 626 J. Minerals and Materials Characterization and Engineering
cross-section rods. The slices were cut both parallel and perpendicular to the rolling direction of the rod. The elemental composition of 1018 steel is, by weight percent, 0.14 - 0.20 C, 0.6 - 0.9 Mn, less than 0.04 P, and less than 0.05 S, with the balance made up by Fe. The coupons were polished to a final surface roughness of 30 - 50 nm using a succession of diamond and silica emulsions, as described in previous work [3] [4] [11]. All chemicals were purchased from Sig-ma Aldrich. Control coupons such as 99.995% pure Fe (Alfa Aeser, USA) and Cu70Ni30 (Qinetic, UK) alloys were cut perpendicular to the bars and polished as
described above. All solutions were prepared using Nanopurewater and steri-lized by autoclaving (at ~1.5 × 10⁵ Pa steam and 120˚C for 20 min) and/or
fil-tering through a 0.1-µm filter (Corning Inc.).
The corrosion of the steel coupons was achieved by exposing them to suboxic and sulfidogenic marine environments with a mixed culture of model marine organisms (to simulate conditions expected for Naval vessel hulls and fuel tanks). This culture consisted of aerobic fuel-degrading Marinobacter and anae-robic sulfate-reducing Desulfovibrio indonensiensis incubated in natural seawa-ter. Our experiments were motivated by the need to understand the mechanisms behind the bacteria-influenced corrosion of seawater-compensated fuel ballast tanks in Naval ships in the presence of a marine aerobic and anaerobic bacterial consortium. For this reason, a layer of Naval fuel was also added on top of the natural seawater in our model corrosion reactors. Because various compart-ments in these fuel tanks are connected with CuNi pipes, we also included a Cu70Ni30 alloy with the carbon steel in some experiments. The mechanical
stabil-ity of the ship is maintained by replacing the burned fuel in the fuel tank with filtered seawater. The result is a unique interface formed between a layer of sea-water with marine organisms and a layer of Naval fuel sitting on top.
The tops of our reactors were kept open to the atmosphere, and the O2 in the
air was in a steady state thermodynamic equilibrium with the dissolved O2 in the
fuel and seawater phases. Dissolved O2 in seawater was consumed through one
of three mechanisms: 1) aerobic respiration of Marinobacter, 2) oxidation of metallic surfaces or 3) production of thiosulfates by H2S reacting with O2. A
schematic of the system is presented in Figure 2. Measurements showed that the oxygen concentration in the seawater was below 50 ppb and remained more or less constant starting ~1 mm below the seawater/fuel interface (see Figure 2), a suitable condition for mixtures of aerobic and anaerobic species.
2.1. Corrosion Experiments
DOI: 10.4236/jmmce.2018.66044 627 J. Minerals and Materials Characterization and Engineering
Figure 2. Schematic of the suboxic bioreactor utilized in corrosion experiments (right). Corroding samples (control and 1018 steel) are shown hanging from shielded wires. The control can be pure Fe or Cu70Ni30 alloy. Other components of the electrochemical cell are indicated. The seawater medium was inoculated with a mixture of Marinobacter/D. indonensiensis. The fuel layer over the seawater was filter-sterilized JP5 fuel, and the seawater was non-sterilized San Diego Bay seawater. The ATP, dissolved oxygen, open circuit potential, linear polarization resistivity, and reduction potential of the medium were all measured several times a week. The seawater used for the ATP assay was replenished weekly. Also given is an oxygen concentration profile in ppm as a function of depth taken after the system reached a steady state suboxic condition and remained there (left). A sharp drop in the oxygen concentration as the seawater/fuel interface is crossed is easily seen. The system was kept exposed to the air via the utility port, which was also used for inserting an Ag/AgCl electrode during our electrochemical measurements.
4 - 5 mL of JP5 fuel on top of ~18 mL of either natural seawater from San Diego Bay or Key West, or in some cases artificial seawater, the Widdel medium [46]. Although chemical, biological, and electrochemical processes were monitored, including dissolved oxygen concentration, ATP, open-circuit potential, reduc-tion potential, and linear polarizareduc-tion resistivity, during the corrosion process, for the purpose of this paper only the dissolved oxygen profile is relevant. Other measurements will be presented in a future publication with a focus on the cor-rosion products and rates. Wires insulated with Teflon sleeves were spot welded on the side of the corroding coupons and sealed with a marine-grade epoxy (MarineWeldTM, J-B Weld Co.) before the coupons were exposed to the marine
medium. A platinum wire was used as a counter-electrode, and a homemade removable Ag/AgCl electrode was used as a reference electrode. The homemade reference electrode was calibrated against the commercial Ag/AgCl electrode before use. Experiments using only Marinobacter were performed as a control to elucidate the corrosion process in the absence of H2S in a suboxic environment.
DOI: 10.4236/jmmce.2018.66044 628 J. Minerals and Materials Characterization and Engineering
were glued back to back and sealed with the marine epoxy so that only the po-lished surfaces on the metal coupons were exposed to the corrosive medium. These polished surfaces were essentially identical in most experiments on the two sides, so that the corrosion current densities would be uniform and self-similar on both surfaces. Only analyses from the polished faces of these samples are reported here.
2.2. Analysis
Coupons were investigated using a scanning field emission electron microscope (FEM) from Zeiss (SUPRA 55VP, Carl Zeiss Micro-Imaging, GmpH, Gottingen) and integrated Auger NanoProbe (PHI-710) systems equipped with ener-gy-dispersive X-ray (EDX)and electron backscatter diffraction (EBSD) analysis. Corrosion products were analyzed before they were removed; results of these will be published elsewhere; here we focus on the surface morphology beneath the deposits, which was analyzed after the corrosion deposits were removed by dipping the corroded surface into an acidic solution known as Clarke solution
[11] [47] [48] for 5 seconds followed by a rinse with Nanopure water and drying
with dry nitrogen. The Clarke solution was prepared according to ASTM stan-dards by adding 3.5 g of hexamethylenetetramine to 1000 mL of 6 M HCL (HPLC grade) [47] [48]. In this manuscript we focus on the role of the metal-lurgy in localized corrosion. For this reason the spatial distribution of the man-ganese sulfide inclusions throughout the steel matrix is of great interest. We de-veloped a scheme for mapping and counting MnS inclusions in the 1018 carbon steel coupons and report on their concentrations. It is important to emphasize here that the geometry of the MnS inclusions is highly asymmetric: they appear as stringers having lengths of hundreds of microns along the rolling direction of the steel bars but widths of a micron or less in the planes perpendicular to the rolling direction. These are sometimes referred to as MnS stringers in the litera-ture. On close examination these stringers turned out to be very complex phases, and we address these issues in our future publication elsewhere. These stringers are formed during the hot rolling process after molten steel is left to solidify as explained in the Introduction. Because MnS is highly deformable, the stringers are formed during the hot rolling process, when the steel is still in the austenitic (γ-Fe) phase [12] [16] [18] [20].
3. Results and Discussions
3.1. Mapping Residual Strain
The localized residual strain left from the metallurgical history of a metal can be assessed by investigating the EBSD image of a clean 1018 coupon surface to demonstrate the degree of lattice-preferred orientation of adjacent grains and sub-grains, as shown in Figure 3. Panel A shows the Auger nanoprobe second-ary electron image of a 10 × 10 μm2 region of a 1018 coupon. Panel B shows the
DOI: 10.4236/jmmce.2018.66044 629 J. Minerals and Materials Characterization and Engineering
Figure 3. (A) Auger nanoprobe field emission secondary electron image of a 1018 coupon. (B) Auger nanoprobe EBSD orientation image shown in (A) but tilted by 70 degrees. (C) EBSD misorientation image generated from orientation image in (B). The sample was prepared by cutting the coupon perpendicular to the rolling axis of the rod and polishing to a 30 - 50 nm finish. (D) Orientation color legend associated with the image in (B) and misorientation color band associated with the image in (C). Indicated are MnS inclusions, pearlite bands and ferrite grains. Black represents unresolved points, indicating a region of high disorder. The misorientation map shows the locations of residual strain generated during the metallurgical preparation of the steel and hence of potential anodic sites. Shades of blue in ferrite grains and the colors green and red at defect sites indicate degrees of misorientation at these locations.
fail-DOI: 10.4236/jmmce.2018.66044 630 J. Minerals and Materials Characterization and Engineering
ures in real-life applications. Misorientation maps have the potential to predict the locations of pitting corrosion before carbon steel is exposed to corrosive en-vironments. Considering the detrimental role MnS inclusions play in localized corrosion it is instructive to determine their statistical distribution on 1018 car-bon steel surfaces. This is presented next.
3.2. Distribution of MnS Inclusions
The FEM investigation of clean, polished coupon surfaces illustrates the major microstructures of interest in this study. FEM images of coupons cut parallel (right) and perpendicular (left) to the rolling direction are given in Figure 4. The perpendicular-cut sample was prepared the same as the parallel-cut sample as described above, but additionally was treated with Nitol in order to enhance the surface microstructures of interest. Nitol was used here only to emphasize these microstructures; it was not used on any other coupons that were subjected to the biocorrosive environment. In the image (left panel in Figure 4), the cross sections of the MnS stringers appear small (≤1-μm diameter) on the surface. Pearlite bands and grain boundaries are also clearly visible. The parallel-cut coupon was prepared by polishing to a 30 - 50 nm finish, following the proce-dure described above. This surface was not subjected to Nitol treatment to pre-vent etching of the MnS inclusions. As explained above, the microstructures of MnS inclusions and pearlite bands were stretched along the rolling direction of the steel rod. MnS appeared as long stringers stretching for hundreds of microns along the rolling direction, illustrating that the inclusions were long, pervasive features permeating throughout the material. Repeated investigation of 1018 carbon steel coupons using FEM in conjunction with EDX analysis gave the re-searchers familiarity with the appearance of the various mineral inclusions (MnS and others), so that they could be easily located and identified on surfaces. FEM imaging using low-energy primary electrons of 1 keV (as in the left panel in
Figure 4) show the MnS inclusions with dark rings around them. These dark
rings are where the Nitol preferentially corroded the surface, leaving dark, shal-low trenches in the boundary region between the inclusion and the surrounding iron matrix. Similarly, FEM imaging with an accelerating voltage of 20 kV, as in the case of the parallel-cut sample shown on the right in Figure 4, show the MnS inclusions as long, dark lines. Grain boundaries and bands of pearlite were ubi-quitous throughout the steel, as seen in the perpendicular-cut sample. Without the Nitol treatment, these features were not as obvious in the FEM of polished clean surfaces.
The spatial distribution of MnS inclusions on 1018 coupons, cut and polished parallel and perpendicular to the rolling direction, was investigated using FEM imaging. The clean steel surface was treated with Clarke solution (pH~1), which dissolved the MnS inclusions while leaving the rest of the steel surface unaffected
DOI: 10.4236/jmmce.2018.66044 631 J. Minerals and Materials Characterization and Engineering
Figure 4. FEM images of clean carbon steel surfaces cut and polished perpendicular (left) and parallel (right) to the rolling axis of the rod. The image in the left panel was produced with a 1-kV accelerating voltage and etching with Nitol; the one in the right panel, with a 20-kV accelerating voltage. Examples of individual ferrite crystalline grains, MnS inclusions, a grain boundary, and pearlite grains are indicated.
depressions (holes) appear as highly contrasted dark spots against a light back-ground in the FEM image over a range of accelerating voltages between 1 and 20 keV. MnS inclusions on perpendicular-cut samples appear as spots from less than a half to a few microns wide. On parallel-cut samples they appear as long stringers up to a few microns wide but hundreds of microns in length. In both cases images were taken in a grid pattern with FEM. We observed that the den-sity of inclusions increased towards the outer edge of a coupon relative to the central region, which is in agreement with the literature [50]. The results pre-sented here correspond to the overall average of all MnS inclusions.
On the parallel-cut sample, 125 fields of view (FOVs) were analyzed. These FOVs were distributed over a 5 × 25 grid in which rows of 25 images (lined up perpendicular to the rolling direction) were taken from 5 columns lined up along the rolling direction of the rod. Each image was taken at 1500× magnification and measured 170.8 microns along the rolling direction and 250.0 microns per-pendicular to the rolling direction; in total they covered an area of 5.3 mm2. The
FOVs on the surface cut and polished perpendicular to the rolling direction were taken 300 microns apart, while the FOVs associated with the coupons cut and polished along the rolling direction were taken 2 mm apart. This was to ensure that the same long MnS stringers were not counted multiple times among dif-ferent FOVs. On the perpendicular-cut sample, 512 images were taken on a grid measuring 16 rows by 32 columns. Each image was taken at 5000× magnification and measured 75.3 by 46.0 microns, for a total analyzed area of 1.8 mm2.
DOI: 10.4236/jmmce.2018.66044 632 J. Minerals and Materials Characterization and Engineering
done for each FOV, and the list of coordinates of all inclusions was compiled. The accuracy of our visual identification was confirmed for a given coupon by performing an EDX analysis before the treatment with Clarke solution and comparing the results with those of visual inspection after the treatment. In this way the operator becomes familiar with these features and learns to identify them rapidly and accurately from their morphological signature in perpendicu-lar- and parallel-cut samples in which inclusions are more or less the only fea-tures besides pearlite grains found on a polished surface.
The number of inclusions counted per FOV image in the perpendicular-cut sample is given as a histogram in Figure 5. The x-axis gives the number of MnS inclusions counted per FOV, and the y-axis gives the fraction of the 512 images for which that number of stringer tips was found. The average was found to be 12 ± 6 inclusions per FOV image. This means a square mm area of 1018 carbon steel cut perpendicular to the rolling direction has on the average ~3400 inclu-sions, or each inclusion on the average occupies a ~17 × 17 μm2 area.
In the case of the parallel-cut samples, the pertinent metric to describe the spatial distribution of the MnS inclusion stringers is the distance (perpendicular to the rolling direction, or x-distance) between closest neighboring inclusions. A histogram of the distances between closest neighboring inclusion pairs is shown
in Figure 6 (top). This distribution is compared with the histogram of closest
paired MnS stringer tips compiled from the data associated with the surfaces cut and polished perpendicular to the rolling direction, also shown in Figure 6
[image:15.595.234.518.489.658.2](bottom). The maximum distance considered between pairs was chosen to match the size of the FOV utilized for the perpendicular-cut sample. This cor-responds to a diagonal length of 88 µm for the FOV images of the surface cut perpendicular to the rolling axis. Overall it was found that on average an inclu-sion stringer is within ~18 ± 16 µm of another incluinclu-sion stringer.
DOI: 10.4236/jmmce.2018.66044 633 J. Minerals and Materials Characterization and Engineering
Figure 6. Histogram of distances between nearest neighbor pairs (both perpendicular- and parallel-cut surfaces) as a fraction of total number of pairs per range of distance. Each bin on the x-axis is 4 µm wide. The two distributions are very similar, as expected.
The exponential decaying manner of the distribution in Figure 6 suggests that inclusion stringers were more often in tight groups than spread far apart. Figure 7 shows one of many FEM FOV images used to create the histogram for the pa-rallel-cut coupons shown in Figure 6 (top). Here the channels left by dissolved MnS stringers appear as dark lines, while bands of pearlite stand out as white islands in the otherwise grey ferrite metal grains. Figure 7 shows that MnS stringers appeared to be often, but not always, localized along pearlite bands (Type A in Figure 7) and that in regions lacking in pearlite, stringers were ob-served less often (Type B in Figure 7). This reflects the difference between zones of the metal that possessed a high density of crystallographic disorder, or resi-dual strain, and those that were more or less pure Fe grains, which were less strained. These highly strained ferrite zones will be more susceptible to localized corrosive attack and will serve as sacrificial anodes relative to the unstrained fer-rite grains. This is a new view of corrosion, in which the anodic and cathodic sites on carbon steel are predetermined by its metallurgical history.
DOI: 10.4236/jmmce.2018.66044 634 J. Minerals and Materials Characterization and Engineering
distance between inclusions. In the perpendicular-cut sample this average tance was found to be 14 ± 12 μm. In the parallel-cut sample the average dis-tance was 18 ± 16 μm. We have more reliable statistics for the perpendicularly prepared surface because of its large sample size relative to the parallel-cut sur-face, for which statistics were gathered in only one dimension. It is, therefore, hypothesized that the critical average pit radius for the enhanced macro-pitting transition to occur is around 10 - 20 μm.
3.3. Localized Corrosion
When samples were removed from the corrosion reactors as described in
Fig-ure 2, the surfaces of the samples were covered with corrosion products, as
shown in Figure 8. The surface illustrated in Figure 8 was exposed to a subox-ic/sulfidogenic environment as described above for ~50 days. A Cu70Ni30 alloy
was coexposed with the carbon steel to simulate the pipes in Naval fuel tanks. The inset in Figure 8 shows an EDX spectrum obtained from the corrosion products. The S associated with the corrosion products, mostly FeS, was in sul-fide form (S−2) as confirmed by the XPS analysis. Because FeS is a conductive
mineral it provides electrically conducting pathways from the carbon steel sur-face to the cathodic reactants (O2, H+, HS−) on the surface of corrosion products
hence increasing the reach of cathodic processes and the rate of corrosions. The Cu and Ni signature in the EDX spectrum is due to corrosion products origi-nating from the CuNi coupon (Figure 2). After the sample was removed, rinsed with Nanopure water and dried with dry nitrogen, it was analyzed using FEM. A large pit was obvious, but most of the other pits were obscured by thick corro-sion deposits. In order to assess where the metal was eroding relative to any MnS inclusions, grain boundaries, and pearlite grains, as discussed above, the corro-sion deposits on most of the surfaces were removed by dipping the corroded coupons into Clarke solution for a brief period (~5 s) before they were analyzed using FEM. On all the corroded coupons reported here, regardless of the corro-sive environment, we observed excess localized corrosion in the immediate vi-cinity of MnS inclusions, in ferrite lamellae of pearlite bands and at many of the grain boundaries.
DOI: 10.4236/jmmce.2018.66044 635 J. Minerals and Materials Characterization and Engineering
[image:18.595.236.513.114.303.2]the unstrained regions of the ferrite grains and therefore more susceptible to lo-calized corrosive attack.
Figure 7. FEM image of pearlite bands (light regions) and elongated MnS stringers in a parallel-cut 1018 coupon. The sample was prepared by polishing to a 30 - 50 nm finish and then treating for five seconds with Clarke solution to dissolve the MnS inclusions exposed on the surface. The locations of MnS stringers appear in FEM images as dark lines. Pearlite appears as light regions in the slightly darker ferrite matrix. MnS inclusions were observed in the regions of high pearlite concentration (Type A regions) and were mostly absent in regions of pure ferrite (Type B regions). The Type A regions were highly strained compared to the Type B regions.
[image:18.595.208.538.418.644.2]DOI: 10.4236/jmmce.2018.66044 636 J. Minerals and Materials Characterization and Engineering
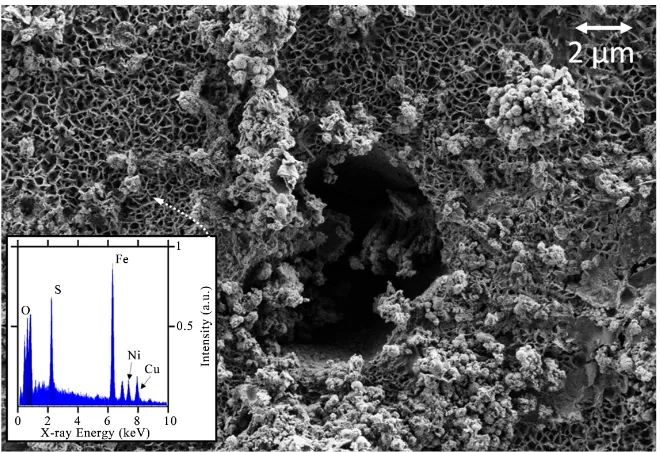
Figure 9. FEM image of corroded 1018 coupon cut perpendicular to the rolling direction after corrosion products were removed using Clarke solution. The sample was exposed to a suboxic/sulfidogenic environment for 50 days. Indicated are (A) pearlite, (B) a MnS stringer protruding from the pit, and (C) grain boundaries with accelerated corrosion in the boundary region. The inset is an EDX spectrum taken from the tip of the MnS inclu-sion. A zoomed-in view of the MnS inclusion is shown in Figure 10.
The localized corrosion around MnS inclusions grew deeper and wider as it tunneled down beneath the sample surface along the length of the MnS stringers as reported in our previous work [3] [4] and illustrated in Figure 10: the inset in the right-hand corner of Figure 10 shows two EDX spectra, colored blue and yellow. The blue spectrum was taken from point A, while the yellow one was taken from the bottom of the pit at point B. The pit depth (~6 μm) was deter-mined using the methodology reported in our earlier publication [4]. It is possi-ble to see inside the pit, as long as it is not too deep, using contrast adjusted sec-ondary electron imaging, as shown in the inset in the lower right-hand corner of
Figure 10.
Analogous results may be seen in the case of coupons cut parallel to the roll-ing direction. Strroll-ingers exposed on the polished surface durroll-ing the initial stages of corrosion produced excess corrosion along the entire length of their sides, as illustrated in Figure 11. The degree and severity of the corrosion depended on the local surroundings of the MnS inclusion. The surface in Figure 11 was ex-posed to the suboxic environment produced by anaerobe Marinobacter; the en-vironment was not sulfidogenic. The presence of H2S in solution exacerbated
lo-calized corrosion. An example of this is shown in the inset in the upper right corner of Figure 11. The surface associated with the inset image was exposed to a suboxic/sulfidogenic environment. Notice also that although the corrosion was initiated locally around the MnS inclusion, the presence of H2S created localized
DOI: 10.4236/jmmce.2018.66044 637 J. Minerals and Materials Characterization and Engineering
Figure 10. FEM image of the MnS stringer marked in Figure 9 and its surroundings. The surface was cut and polished perpendicular to the rolling direction, and corrosion products were removed using Clarke solution. The sample was exposed to the suboxic/sulfidogenic environment for 50 days. Marked are the MnS stringer sticking out of the pit and points A and B, from which the EDX spectra shown in the inset (upper right-hand corner) were taken to determine the pit depth (~6 µm). The inset in the lower right corner is a backscattered contrast-adjusted image of the pit, where one can see the bottom of the pit. Such MnS inclusions eventually dissolve and produce localized H2S and S as the acidity of the pit increases.
[image:20.595.221.527.388.609.2]DOI: 10.4236/jmmce.2018.66044 638 J. Minerals and Materials Characterization and Engineering
feedback mechanism for local corrosion: as H2S/S is released, facilitating a
ca-thodic process in the immediate surface area of the ferrite grains near the fer-rite/MnS interface, and as the surface area of the ferrite is exposed, we hypothes-ize that the hydrolysis of Fe-ions in the region acidifies the local surroundings of the MnS stringer, which causes dissolution of MnS inclusions, causing the re-lease of H2S/S abiotically, which then fuels the localized corrosion. It is
impor-tant to emphasize here that pit initiation and pit growth are two entirely differ-ent electrochemical processes. Pit growth depends on whether or not there are highly strained regions in the area to generate and sustain a localized low pH level due to the hydrolysis of Fe+2, +3 ions [3] [4].
A broken MnS stringer, something that was commonly observed, is seen in the inset in Figure 11. When the immediate surroundings of a MnS stringer were corroded and etched away, a great amount of stress was released by the loss of ferrite matrix holding the stringer in place. The two ends of the break point separated and in some cases were no longer aligned after the MnS stringer as-sumed a less stressed configuration without the surrounding ferrite matrix holding it in place.
The density of lattice defects in the ferrite matrix increased in zones where pearlite and MnS inclusions intersected each other. The result was excessive lo-calized corrosion. An example is given in Figure 12, where a pearlite grain ap-pears to be co-located with a MnS inclusion that was initially buried under the surface. This coupon was cut and polished parallel to the rolling direction, from left to right. Notice that the pit initiated around a pearlite grain on the surface exposed the MnS inclusion below the surface to the corrosive environment. Subsequently the localized corrosion followed the MnS inclusion under the sur-face, creating a hole around the stringer and burrowing into the metal along the stringer. The corrosive environment was suboxic without any sulfate-reducing bacteria in the medium. Our observations point to the fundamental corrosion processes taking place in these systems, which do not depend upon the presence of sulfate-reducing bacteria (SRBs). Regardless of the particular corroding me-dium, the corrosion initiates and grows where there is strain in the iron lattice. Even though the corrosion illustrated in Figure 12 was not initiated by a sulfi-dogenic environment, the fact that dissolved MnS releases abiotic H2S into the
local environment of a pit means that the immediate surroundings of MnS in-clusions become sulfidogenic abiotically, giving rise to accelerated corrosion within these deep, long, narrow regions.
Many factors accelerate or slow down the progress of corrosion; however, the metal is most susceptible to corrosion at anodic sides that preexisted on the sur-face because of the metallurgical preparation of the metal. Regardless of the en-vironment (suboxic or suboxic/sulfidogenic) the corrosion always initiates at and grows from these defect sites.
Figure 13 illustrates another corrosion trench on a surface cut and polished
DOI: 10.4236/jmmce.2018.66044 639 J. Minerals and Materials Characterization and Engineering
[image:22.595.209.537.113.333.2]grain boundary. Notice at the point marked A that there is a broken line of structure extending along the trench. When analyzed with EDX, this line of
Figure 12. FEM image of a pit generated in and around a pearlite grain. This is the same surface as that shown in Figure 11, but a different region. The inset shows an EDX spectrum taken from a MnS inclusion exposed at the bottom of the pit, as marked. Notice the beginning of the hole around the MnS inclusion underneath the surface and extending along the MnS stringer.
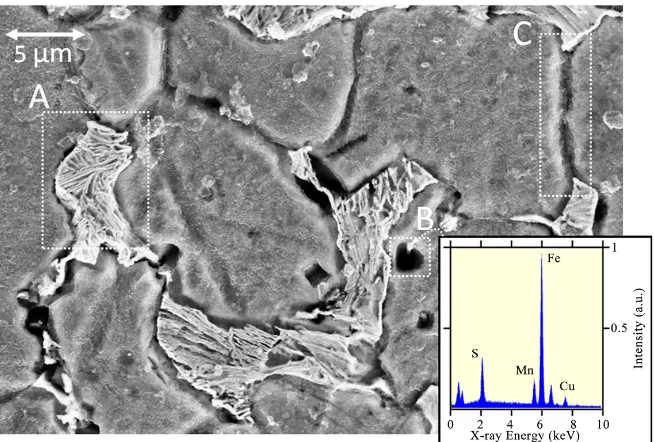
Figure 13. Excess corrosion at grain boundaries on a 1018 coupon surface. Indicated in the center is (A) a cementite lamella lined up with a grain boundary. EDX analysis at point A shows a nearly pure Fe signature. Also indicated are (B) examples of
[image:22.595.217.532.415.631.2]DOI: 10.4236/jmmce.2018.66044 640 J. Minerals and Materials Characterization and Engineering
structure gave a signature of nearly pure Fe. This was most likely a cementite lamella localized along the grain boundary; EDX is not very sensitive to a C sig-nature. In a corrosive environment, individual grains will etch out at different rates depending on the local density of lattice imperfections and differences in the orientation of the grains at grain boundaries. The particular grain boundary marked A in Figure 13 apparently intersected a pearlite grain, and it was one of the Fe3C lamellae running along the interface which caused the excess lattice
strain in this region that resulted in enhanced localized corrosion. In this figure, we also notice a multitude of other grain boundaries exhibiting excessive loca-lized corrosion which have pearlite grains nearby. These are marked D in the figure. Other grain boundaries, marked C in the figure, corroded at an accele-rated rate without the nearby presence of pearlite or MnS inclusions.
Although this manuscript is not focused on distinguishing between suboxic and suboxic/sulfidogenic corrosion processes, it is worthwhile to mention some differences we have noticed. Figure 13 shows the morphology of a corroded surface exposed to the suboxic environment of Marinobacter for 33 days, and
Figure 14 shows a similarly corroded surface exposed to the suboxic/sulfidogenic
environment of Marinobacter/D. indonensiensis for 50 days. The morphology of the surface in Figure 14 is qualitatively similar to that shown in Figure 13, but there are noticeable differences between the two surfaces, principally that the lo-calized attack was much more severe in the case of suboxic/sulfidogenic expo-sure. Comparing the scale bars in Figure 13 and Figure 14, one observes that suboxic/sulfidogenic exposure gave rise to deeper, wider localized corrosion pits and crevices. The corrosion was initiated at strained areas in both cases, with and without biotically produced sulfide, but it became more severe in the system with SRBs. In Figure 14 the majority of grain boundaries are not corroded, but some near pearlite grains or MnS stringers are severely etched away. These are marked with circles in the figure. This differs from the results in Figure 9 (sul-fidogenic/suboxic exposure, perpendicular cut) which show all grain boundaries being preferentially etched relative to the bulk iron. As mentioned above, cou-pons of CuNi alloy were corroded alongside the 1018 coucou-pons (Figure 2) in these experiments, and their corrosion was investigated as well. We noticed that in the case of corrosion in a suboxic/sulfidogenic environment, substantial dis-solution of the CuNi resulted in the deposition of Cu and Ni corrosion products on the 1018 coupon surfaces (see inset in Figure 8). Only very limited, if any, corrosion of the CuNi alloy was observed in suboxic corrosive environments. Work on the corrosion products of CuNi and carbon steel will be published elsewhere.
4. Conclusions
DOI: 10.4236/jmmce.2018.66044 641 J. Minerals and Materials Characterization and Engineering
which, in a corrosive environment, cause the initiation and growth of localized corrosion. In what follows an expanded version of this idea is described. Figure 15 summarizes our conclusions. It compares a pure Fe coupon (99.995% purity) (bottom) and a 1018 carbon steel coupon (top) that were corroded simulta-neously under the same experimental conditions; the coupons were cut and po-lished perpendicular to the rolling direction and exposed to the same subox-ic/sulfidogenic environment for 170 days. Notice that at the scale shown there are a large number of localized corrosion pits on the 1018 coupon, whereas there is hardly any localized corrosion on the pure Fe coupon. Deep crevices and holes exist on the 1018 coupon around pearlite features, and many of them contain MnS inclusions at their deepest points. With the exception of grain boundaries, pure Fe does not possess many of the localized defects, such as MnS inclusions or pearlite bands, that are abundantly present in 1018 carbon steel. Furthermore, this was not galvanic protection of pure Fe, for we have observed a lack of loca-lized corrosion on pure Fe in many instances where pure Fe was co-exposed with a carbon steel coupon to a corrosive environment without physical contact with similar results.
[image:24.595.212.537.380.603.2]Therefore, the only localized corrosion in the case of pure Fe is expected to be along the grain boundaries; we see such corrosion locally upon closer inspection.
Figure 14. FEM image of accelerated corrosion around a MnS inclusion on a 1018 coupon surface cut parallel to the rod axis. The sample was corroded for 50 days in a
DOI: 10.4236/jmmce.2018.66044 642 J. Minerals and Materials Characterization and Engineering
Figure 15. FEM images of corroded surfaces of a 1018 coupon (top) and a pure iron coupon (bottom), both cut perpendicular to the rolling direction, that were glued together back to back and corroded under identical suboxic/sulfidogenic conditions for 170 days in the presence of Marinobacter/D. indonensiensis in artificial seawater (Widdel medium) with JP5 fuel on top. The reason we used a pure Fe is that pure Fe does not have MnS inclusions and pearlite grains, which we claim is where most strains occur and most localized corrosion starts and propagates. Thus, theregions of accelerated corrosion are obvious as deep pits in the 1018 sample, but virtually nonexistent in the pure iron sample.
[image:25.595.304.443.71.264.2]DOI: 10.4236/jmmce.2018.66044 643 J. Minerals and Materials Characterization and Engineering
This new view of the corrosion of metals can be summarized as the volume of a metal being full of anodic and cathodic sites distributed with nano- and mi-croscale separations. We hypothesize that this not only is true for carbon steel but is a fundamental fact that plays an important role in all metallic corrosion. In the case of low-carbon steels (1018 in particular), we identify these anodic sites as having high densities of dislocations in the immediate surroundings of MnS inclusions with a surface density of ~3400 MnS stringers per mm2, pearlite
grains, and grain boundaries. Just as important is the fact that the magnitude of these anodic potential differences increases logarithmically with the density of dislocations [51], while the corrosion current density increases exponentially with the anodic potential differences. We further predict that if a metallic sample is highly strained but fairly uniform, these materials will be lacking localized galvanic coupling and will behave similarly to the unstrained pure metal with low density of pitting corrosion. We expect researchers and engineers will pay more attention to the metallurgical treatment of the alloys as they assess their corrosion properties.
Acknowledgements
This work is supported by ONR Multidisciplinary University Research Initiative (MURI) grant N00014-10-1-0946. The work is also supported in part by Mon-tana State University funds supporting the Imaging and Chemical Analysis La-boratory (ICAL). The authors would like to acknowledge J. Martin for his con-tribution on dissolved oxygen measurements, L. Loetterle for her concon-tribution to the microbiological aspects of this work, Prof. I. Beech of now Montana State University for providing and advising us on the Marinobacter cultures and CuNi alloys, members of Prof. J. Suflita’s group at the University of Oklahoma for their help in providing and advising on San Diego Bay and Key West seawater, and L. Avci for her English editing. The help of L. Kellerman and N. Equall of ICAL in SEM analysis is greatly appreciated.
Conflicts of Interest
The authors declare no conflicts of interest regarding the publication of this pa-per.
References
[1] Costs, C. (2002) Preventive Strategies in the United States, Publication No. FHWA-RD-01-156, as Found in Supplement to Materials Performance.
[2] Jackson, J.E. (2016) Cost of Corrosion Annually in the US Over $1.1 Trillion in 2016.
[3] Avci, R., et al. (2013) Mechanism of MnS-Mediated Pit Initiation and Propagation in Carbon Steel in an Anaerobic Sulfidogenic Media. Corrosion Science, 76, 267-274. https://doi.org/10.1016/j.corsci.2013.06.049
DOI: 10.4236/jmmce.2018.66044 644 J. Minerals and Materials Characterization and Engineering https://doi.org/10.1016/j.corsci.2014.12.018
[5] Martin, J.D. (2014) Biocorrosion of 1018 Steel in Sulfide Rich Marine Environ-ments; a Correlation between Strain and Corrosion Using Electron Backscatter Dif-fraction. In: Chemical Engineering, Montana State University, 175.
[6] Murr, L.E. (2015) A Brief History of Metals. Handbook of Materials Structures, Properties, Processing and Performance, 3-9.
[7] Kirk-Othmer (2004) Steel. In: Encyclopedia of Chemical Technology, V. 00, John Wiley & Sons, New York.
https://onlinelibrary.wiley.com/doi/pdf/10.1002/0471238961.1920050516012420.a01 .pub2
[8] Brandt, D.A. and Warner, J.C. (2009) Metallurgy Fundamentals, Goodheart-Willcox. [9] Lehmann, J. and Nadif, M. (2011) Interactions between Metal and Slag Melts: Steel
Desulfurization. Reviews in Mineralogy and Geochemistry, 73, 493-511. https://doi.org/10.2138/rmg.2011.73.15
[10] Porter, D.A. and Easterling, K.E. (1992) Phase Transformation in Metals and Alloys. CRC Press. https://doi.org/10.1007/978-1-4899-3051-4
[11] Davis, B.H. (2013) Anaerobic Pitting Corrosion of Carbon Steel in Marine Sulfido-genic Environments. In: Physics, Montana State University, Bozeman.
[12] Krauss, G. (2003) Solidification, Segregation, and Banding in Carbon and Alloy Steels. Metallurgical and Materials Transactions B, 34, 781-792.
https://doi.org/10.1007/s11663-003-0084-z
[13] Behrens, H. and Webster, J.D. (2011) Studies of Sulfur in Melts-Motivations and Overview. Reviews in Mineralogy and Geochemistry, 73, 1-8.
https://doi.org/10.2138/rmg.2011.73.1
[14] Choudhary, S. and Ghosh, A. (2008) Thermodynamic Evaluation of Formation of Oxide-Sulfide Duplex Inclusions in Steel. ISIJ International, 48, 1552-1559. https://doi.org/10.2355/isijinternational.48.1552
[15] Choudhary, S.K. (2012) Thermodynamic Evaluation of Inclusion Formation during Cooling and Solidification of Low Carbon Si-Mn Killed Steel. Materials and Manu-facturing Processes, 27, 925-929. https://doi.org/10.1080/10426914.2011.602797 [16] Ito, Y., Masumitsu, N. and Matsubara, K. (1981) Formation of Manganese Sulfide in
Steel. Transactions of the Iron and Steel Institute of Japan, 21, 477-484. https://doi.org/10.2355/isijinternational1966.21.477
[17] Kimura, S., et al. (2002) In-Situ Observation of the Precipitation of Manganese Sul-fide in Low-Carbon Magnesium-Killed Steel. Metallurgical and Materials Transac-tions A, 33, 427-436.https://doi.org/10.1007/s11661-002-0103-8
[18] Yu, H., et al. (2006) Morphology and Precipitation Kinetics of MnS in Low-Carbon Steel during Thin Slab Continuous Casting Process. Journal of Iron and Steel Re-search, International, 13, 30-36.https://doi.org/10.1016/S1006-706X(06)60091-5 [19] Sun, W., Militzer, M. and Jonas, J. (1992) Strain-Induced Nucleation of MnS in
Electrical Steels. Metallurgical Transactions A, 23, 821-830. https://doi.org/10.1007/BF02675559
[20] Liu, Z., et al. (2006) Morphology Control of Copper Sulfide in Strip Casting of Low Carbon Steel. ISIJ International, 46, 744-753.
https://doi.org/10.2355/isijinternational.46.744
DOI: 10.4236/jmmce.2018.66044 645 J. Minerals and Materials Characterization and Engineering https://doi.org/10.2355/isijinternational.35.402
[22] Rieders, N., et al. (2018) New Insights into the Role of MnS Inclusions in the Loca-lized Corrosion of 1018 Carbon Steel.
[23] Baker, M. and Castle, J. (1993) The Initiation of Pitting Corrosion at MnS Inclu-sions. Corrosion Science, 34, 667-682.
https://doi.org/10.1016/0010-938X(93)90279-P
[24] Spitzig, W. (1983) Effect of Sulfides and Sulfide Morphology on Anisotropy of Ten-sile Ductility and Toughness of Hot-Rolled C-Mn Steels. Metallurgical Transactions A, 14, 471-484.https://doi.org/10.1007/BF02644224
[25] Spitzig, W. (1983) Effect of Sulfide Inclusion Morphology and Pearlite Banding on Anisotropy of Mechanical Properties in Normalized C-Mn Steels. Metallurgical Transactions A, 14, 271-283.https://doi.org/10.1007/BF02651624
[26] Spitzig, W. and Sober, R. (1981) Influence of Sulfide Inclusions and Pearlite Con-tent on the Mechanical Properties of Hot-Rolled Carbon Steels. Metallurgical Transactions A, 12, 281-291.https://doi.org/10.1007/BF02655201
[27] Gainer, L. and Wallwork, G. (1979) The Effect of Nonmetallic Inclusions on the Pit-ting of Mild Steel. Corrosion, 35, 435-443.
https://doi.org/10.5006/0010-9312-35.10.435
[28] Cyril, N., Fatemi, A. and Cryderman, B. (2008) Effects of Sulfur Level and Aniso-tropy of Sulfide Inclusions on Tensile, Impact, and Fatigue Properties of SAE 4140 Steel. SAE Technical Paper.
[29] Luu, W. and Wu, J. (1995) Effects of Sulfide Inclusion on Hydrogen Transport in Steels. Materials Letters, 24, 175-179.
https://doi.org/10.1016/0167-577X(95)00068-2
[30] Ju, C., Don, J. and Rigsbee, J. (1986) A High Voltage Electron Microscopy Study of Hydrogen-Induced Damage in a Low Alloy, Medium Carbon Steel. Materials Science and Engineering, 77, 115-123.
https://doi.org/10.1016/0025-5416(86)90359-9
[31] Ju, C. and Rigsbee, J. (1985) The Role of Microstructure for Hydrogen-Induced Blistering and Stepwise Cracking in a Plain Medium Carbon Steel. Materials Science and Engineering, 74, 47-53.https://doi.org/10.1016/0025-5416(85)90109-0
[32] Ju, C. and Rigsbee, J. (1988) Interfacial Coherency and Hydrogen Damage in Plain Carbon Steel. Materials Science and Engineering: A, 102, 281-288.
https://doi.org/10.1016/0025-5416(88)90583-6
[33] Sephton, M. and Pistorius, P. (2000) Localized Corrosion of Carbon Steel Weld-ments. Corrosion, 56, 1272-1279.https://doi.org/10.5006/1.3280516
[34] Reformatskaya, I., et al. (2004) The Effect of Nonmetal Inclusions and Microstruc-ture on Local Corrosion of Carbon and Low-Alloyed Steels. Protection of Metals, 40, 447-452.https://doi.org/10.1023/B:PROM.0000043062.19272.c5
[35] Wranglen, G. (1974) Pitting and Sulphide Inclusions in Steel. Corrosion Science, 14, 331-349.https://doi.org/10.1016/S0010-938X(74)80047-8
[36] Adhikari, A., et al. (2008) Electrochemical Behavior and Anticorrosion Properties of Modified Polyaniline Dispersed in Polyvinylacetate Coating on Carbon Steel. Elec-trochimica Acta, 53, 4239-4247.https://doi.org/10.1016/j.electacta.2007.12.069 [37] Chen, C., et al. (2017) Insight into the Anti-Corrosion Performance of
Electrodepo-sited Silane/Nano-CeO2 Film on Carbon Steel. Surface and Coatings Technology, 326, 183-191.https://doi.org/10.1016/j.surfcoat.2017.06.031
DOI: 10.4236/jmmce.2018.66044 646 J. Minerals and Materials Characterization and Engineering Mild Carbon Steel for Anti-Corrosion Application. Surface and Coatings Technol-ogy, 254, 167-174.https://doi.org/10.1016/j.surfcoat.2014.06.007
[39] Quezada-Rentería, J.A., Cházaro-Ruiz, L.F. and Rangel-Mendez, J.R. (2017) Synthe-sis of Reduced Graphene Oxide (rGO) Films onto Carbon Steel by Cathodic Elec-trophoretic Deposition: Anticorrosive Coating. Carbon, 122, 266-275.
https://doi.org/10.1016/j.carbon.2017.06.074
[40] Santana, I., et al. (2015) Corrosion Protection of Carbon Steel by Silica-Based Hy-brid Coatings Containing Cerium Salts: Effect of Silica Nanoparticle Content. Sur-face and Coatings Technology, 265, 106-116.
https://doi.org/10.1016/j.surfcoat.2015.01.050
[41] Suresh, S., et al. (2018) Evaluation of Corrosion Resistance of Nano Nickel Ferrite and Magnetite Double Layer Coatings on Carbon Steel. Thin Solid Films, 645, 77-86.https://doi.org/10.1016/j.tsf.2017.10.032
[42] Ye, X., et al. (2015) Protecting Carbon Steel from Corrosion by Laser in Situ Grown Graphene Films. Carbon, 94, 326-334.https://doi.org/10.1016/j.carbon.2015.06.080 [43] Zavareh, M.A., et al. (2014) Plasma Thermal Spray of Ceramic Oxide Coating on
Carbon Steel with Enhanced Wear and Corrosion Resistance for Oil and Gas Ap-plications. Ceramics International, 40, 14267-14277.
https://doi.org/10.1016/j.ceramint.2014.06.017
[44] Prasai, D., et al. (2012) Graphene: Corrosion-Inhibiting Coating. ACS Nano, 6, 1102-1108.https://doi.org/10.1021/nn203507y
[45] Krishnamurthy, A., et al. (2015) Superiority of Graphene over Polymer Coatings for Prevention of Microbially Induced Corrosion. Scientific Reports, 5, Article No. 13858.https://doi.org/10.1038/srep13858
[46] Widdel, F. and Bak, F. (1992) The Prokaryotes: A Handbook on the Biology of Bac-teria: Ecophysiology, Isolation, Identification, and Applications. Springer-Verlag, New York.
[47] Lizama, S.A.W.Y. (2015) Clarke’s Solution Cleaning Used for Corrosion Product Removal: Effects on Carbon Steel Substrate, in Corrosion and Prevention 2015. Australasian Corrosion Association, Adelaide.
[48] ASTM (2017) Standard Practice for Preparing, Cleaning, and Evaluating Corrosion Test Specimens, in G1. West Conshohocken.
[49] Kamaya, M. (2009) Measurement of Local Plastic Strain Distribution of Stainless Steel by Electron Backscatter Diffraction. Materials Characterization, 60, 125-132. https://doi.org/10.1016/j.matchar.2008.07.010
[50] Hwang, B., et al. (2005) Analysis and Prevention of Side Cracking Phenomenon Occurring during Hot Rolling of Thick Low-Carbon Steel Plates. Materials Science and Engineering: A, 402, 177-187.https://doi.org/10.1016/j.msea.2005.04.045 [51] Gutman, E.M. (1998) Mechanochemistry of Materials. Cambridge International