Underreporting of Energy Intake in Iraqi People Living in
the UK According to Body Weight
Wassan A. Ahmed, Waleed Al-Murrani, Gail A. Rees
School of Biomedical and Biological Sciences, University of Plymouth, Plymouth, UK. Email: gail.rees@plymouth.ac.uk
Received December 11th, 2011; revised February 8th, 2012; accepted February 16th, 2012
ABSTRACT
Previous studies have shown that underreporting of energy intake is common when assessing dietary intake, particularly in the overweight and obese. The aim of this study was to obtain an estimate of energy and macronutrient intake ac- cording to weight status and to investigate underreporting among Iraqi people living in the UK. Twenty eight adult vo-lunteers (n = 16 males) were recruited. Dietary intake was estimated 3 times using the 24 hour dietary recall tech- nique. Portion size was estimated using household measures and the Photographic Atlas of Food Portion Sizes.Energy and macronutrients estimations were calculated, and weight and height were measured to calculate Body Mass Index (BMI). Energy intake was compared to estimated basal metabolic rate (BMR) and the Goldberg equation was used to assess underreporting. Of the overall sample, 57.1% (n = 16) and 21.4% (n = 6) subjects were overweight and obese, respec-tively. The mean energy intakes were low for males (1977 kcal/d) and females (1586 kcal/d). The percentage of un-der-reporters was high (57.1%) and this was higher in overweight and obese subjects (68.1%) compared to those of normal weight (4.5%). Overweight and obesityare commonamong well-educated Iraqi people. Underreporting of en- ergy intake is common especially among overweight and obese Iraqi individuals.
Keywords: Energy; Obesity; Body Mass Index; Culture; Dietary Assessment
1. Introduction
The “24 hour dietary recall” is a food record method based on amounts in detail of all the food and drink actually consumed by an individual during a period of time in the recent past [1]. It is an in-depth interview conducted by a trained dietary interviewer to obtain ac- curate quantification of amounts of foods about every- thing the subject had to eat and drink, from midnight to midnight of the previous day or over the 24-hour period, either backward or forward. It is quick and easy to ad- minister [2]. The important factors in this method to ob- tain complete information are the use of open-ended questions, a non-judgemental manner/a neutral attitude/ avoid asking questions in a manner that might influence the subject’s responses, and the use of key questions and memory aids [3].
In this study, the repeat 24 hour dietary recall method was chosen over other dietary assessment methods be- cause it was shown by the Low Income Diet and Nutri- tion Survey in UK [4], to be more acceptable to low in- come groups and ethnic minorities than a food frequency questionnaire or food diary. There is less need to write English for people who have English as a second language and it is less burden for respondents than other methods.
Misreporting, particularly in the form of underreport- ing, is common but varies between research methodolo- gies and sampled populations [5-10]. Under recording of energy intake has been a well-known problem in meas- uring food intake through self-reporting methodologies such as the 24-hour diet recall, especially among over- weight people [6,11-17] and women [18,19]. The fre- quency of underreporting of energy intake has been docu- mented in different ethnic groups but not in those of Middle Eastern origin. Thus, the present study focused on a Middle Eastern group and aimed to obtain an esti- mate of energy and macronutrient intake according to weight status of Iraqi people living in the UK.
2. Subjects and Methods
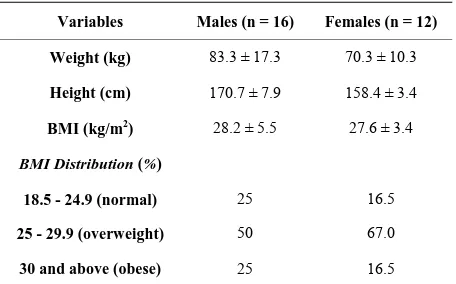
2.1. Anthropometric Data Table 1. Anthropometric data of the sample according to gender.
Height (cm) was recorded to the nearest 0.5 centimeter using a stadiometer, and weight (kg) was measured to nearest 0.1 kilogram using a balance scale. Weight status was defined by calculating Body Mass Index (BMI) which is computed as body weight (kg) divided by height squared (m2). The WHO-BMI standards [20]were adopted
to define obesity: <18.5 kg/m2 = Underweight; 18.5 -
24.9 kg/m2 = normal weight; 25 - 29.9 kg/m2 = over-
weight; 30+ kg/m2 = obese.
2.2. Dietary Recall
Dietary intake of subjects was obtained using the 24 hour recall technique on three random days (including one weekend day) within a 10 day period. The environment was made comfortable by keeping the desk neat, choos- ing a private and quiet location, away from distractions, to help participants recall amounts/portions. Participants were asked to recall the food and drink consumed, food preparation methods, recipe ingredients, brand name of commercial products, use of dietary supplements, how much was consumed, time it was consumed, how it was served, and specific information of the food (low fat, etc.).
To estimate portion size, both interviewer and each subject used household measures, which were converted to grams with the use of the food portion sizes book. The Photographic Atlas of Food Portion Sizes [21]: a user’s guide to the photographic atlas [22] was used to assess amounts of meals not estimated by spoons etc. Energy and macronutrients estimations were calculated using CompEat nutritional analysis programme [23].
2.3. Assessment of Energy Requirements
Basal Metabolic Rate (BMR) for each individual was calculated using Schofield [24] prediction equations, adopted by the FAO/WHO/UNU report (2004), based on age and gender. The ratios of the energy intake (EI)/es- timated Basal Metabolic Rate (BMR) were calculated for each subject to evaluate underreporting. Subjects were classified as “energy under-reporters” when the ratio of reported energy intake to estimated Basal Metabolic Rate (EI/BMR) < 1.14 according to the Goldberg et al. [25] cut-
off limits. Participants with EI/BMR > 2.4 were classified as “energy over-reporters” based on the suggested range of the maximum energy for sustainable lifestyle which is between 2.0 - 2.4 [26]. Those with EI/BMR between 1.14 and ≤2.4 were classified as “acceptable energy reporters”.
3. Results
3.1. Age and Anthropometric Data
Variables Males (n = 16) Females (n = 12)
Weight (kg) 83.3 ± 17.3 70.3 ± 10.3
Height (cm) 170.7 ± 7.9 158.4 ± 3.4
BMI (kg/m2) 28.2 ± 5.5 27.6 ± 3.4
BMI Distribution (%)
18.5 - 24.9 (normal) 25 16.5
25 - 29.9 (overweight) 50 67.0
30 and above (obese) 25 16.5
Data are expressed as mean ± SD.
study sample. The mean age was 39.8 (±11.9) years (range 27 - 70) in males and 36.5 (±11.7) years (range 22 - 64) in females. All subjects were from Iraq and the majority of them were post-graduate students in the University of Plymouth and their families. According to WHO-BMI classifications 16 (57.1%) and 6 (21.4%) subjects were overweight and obese, respectively.
3.2. Energy and Macronutrients Intake
The average intake of energy and macronutrient are de- tailed in Table 2 for males and females. Although in-
takes of energy, protein, carbohydrate and fat were higher in males than females, the differences did not meet statis- tical significance (Table 2).
While protein intakes are higher than the dietary re- ference values (DRV), the energy intake is lower.
3.3. Assessment of Underreporting
Comparing EI with BMR, using the Goldberg Equation cut-off points, 57.1% were under-reporters. The chi- square with one degree of freedom (x2 1) showed no sig-
nificant differences between the number of males and females underreporting, although the rate of underre- porting in males was 50%, while in females was 66.6% (Table 3).
For those who were overweight or obese, 68.1% of them were classified as under-reporters, while just 3.5% of normal weight subjects were under-reporters. Further- more, the estimated ratios of underreporting were 58.3% and 80% among overweight and obese males and females, respectively, but this difference was not statistically significant.
Although no differences were found in mean daily intake of energy, protein, carbohydrate and fat between normal and overweight subjects, the normal weight group reported higher intakes of energy (by 16.7%), carbohy-
[image:2.595.310.538.111.253.2]Table 2. Daily energy and macronutrient intake (mean ± SD) of the sample compared to DRV* according to gender.
Males (n = 16) Females (n = 12)
Energy and macronutrients
Mean ± SD DRV Mean ± SD DRV
P value between
males and females
Energy (kcal) 1977.1 ± 575 1585.7 ± 556
%Total energy compared to DRV* 77.5%
2550 (kcal)
81.7% 1940 (kcal) 0.08
Protein (g) 78.2 ± 24.1 55.5 (g) 66.8 ± 20.2 45.0 (g)
% Energy as protein compared to DRV 15.6% 15% 16.3% 15%
0.18
Carbohydrates 255.9 ± 70.5 - 203.8 ± 71.6
-% Energy as carbohydrates compared to DRV 51.0% 50% 49.8% 50%
0.06
Fat 74.3 ± 35.2 - 61.4 ± 29.5
-% Energy as fat compared to DRV 33.3% 35% 33.7% 35%
0.30
[image:3.595.59.540.312.418.2]*Dietary Reference Values for Food, Energy and Nutrients for the UK [33].
Table 3. Energy intake and basal metabolic rate of the sample according to gender.
Variables Males (n = 16) Females (n = 12)
EI*(kcal) 1977 ± 574.8 1585 ± 556.3
BMR**(kcal) 1826.1 ± 229.8 1414.1 ± 108.8
EI /BMR ratio 1.08 ± 0.36 1.12 ± 0.36
Ratio of underreporting/Total (%) 50 66.6
Ratio of underreporting (overweight)/Total (%) 58.3 80
*Energy Intake; **Basal Metabolic Rate; Data are expressed as mean ± SD.
Table 4. Energy and nutrients intake of the sample categorized according to BMI.
Energy and macronutrients Normal weight (n = 6) Overweight/obese (n = 22) % relative differences P value
Energy (Kcal) 2038 ± 733.0 1747.0 ± 548.8 16.7 0.40
Protein (g) 71.3 ± 25.8) 73.9 ± 22.5 0.03 0.83
Carbohydrate (g) 252.3 ± 91.2 228.4 ± 70.7 10.5 0.57
Fat (g) 80.3 ± 38.7 65.7 ± 31.5 22.3 0.42
Data are expressed as mean ± SD.
4. Discussion
This study found that 22 of 28 (78.5%) of a well-edu- cated sample of Iraqi adults were overweight or obese. In a larger study of 242 Middle Eastern people living in Plymouth and London who reported their heights and weights, 49% of males and 43.8% of females were over- weight or obese [27]. This larger study included people from different countries and of lower educational attain- ment.
The mean energy intake for the group was substan- tially lower than the UK estimated average requirement for energy intake which is likely to indicate underreport- ing.
The percentage of females underestimating energy in- take was greater than males, although this was not statis- tically significant. This might be attributed to the small sample size and the high variability of the measurements. Similar findings have also been reported by other re- searchers [5,7-9,28,29]. Women compared to men, tend to be more preoccupied about weight, food and dieting; therefore, they are more prone to be embarrassed about their dietary intake and thus, more prone to underreport [30]. It seems this may also be true for women from Iraq.
[image:3.595.54.541.456.543.2]among a US population (18% males, 28% females) [18] and Swedish individuals ( 44% males and 47% females) [7].
The percentage of under-reporters was higher in the overweight and obese (68%) in both males and females compared to those of normal weight (16.6%). These re- sults seem to agree with the general outcome of other studies that overweight and obese individuals tend to underreport energy intake [5-7,10,28,29,31]. Heitmann and Lissner [32] found that obese Danish citizens tend to underreport fatty foods and foods rich in carbohydrates rather than underreport their total dietary intake. In addi- tion, snack-type foods may be preferentially forgotten when obese people omit food items in dietary reporting.
This sample included a small number of well-educated Iraqi subjects and their families and does therefore not represent other Middle Eastern groups or those of lower educational attainment.
Underreporting of habitual food intake had an effect on the results for energy and macronutrients intake and in reality intakes would be higher especially in the over- weight and obese group. The use of Compeat software program may have introduced some minor errors as it does not contain all the food items and brand names of Middle Eastern traditional diets. However care was taken to analyse recipes using basic ingredients to provide as accurate nutritional analysis as possible.
Finally, it is worth noting that it is not clear how well the Schofield equation predicts BMR for Middle Eastern people. Therefore, further research is needed to validate this and to explore levels of energy expenditure in this group.
5. Conclusion
In conclusion, more than three quarters of the sample (78.5%) were overweight or obese. Underreporting of en- ergy and macronutrient intake is common among over- weight and obese individuals from Iraq.
6. Acknowledgements
We would like to thank all the participants who took part in this study for their co-operation and time.
7. Conflicts of Interests, Source of Funding
and Authorship
All authors report that they have no conflict of interest. The study was funded by the Ministry of Higher Educa- tion and Scientific Research, Iraq. All authors were in- volved in the design of the study. WAA collected the data and undertook the nutritional analysis. GR super- vised the data collection and nutritional analysis. WAM supervised the statistical analysis. All authors contributed
to the manuscript and have read and approved the final version.
REFERENCES
[1] R. D. Lee and D. C. Nieman, “Nutritional Assessment,” 4th Edition, McGraw-Hill Publishing Co, Boston, 2007. [2] M. A. Eastwood, “Principles of Human Nutrition,” 2nd
Edition, Blackwell Science, Oxford, 2003.
[3] M. Buzzard, “24-Hour Dietary Recall and Food Record Methods,” In: W. Willett, Ed., Nutritional Epidemiology, Oxford University Press, Oxford, 1998, pp. 50-73. [4] Food Standards Agency, “Low Income Diet and Nutrition
Survey,” 2007.
http://www.food.gov.uk/science/dietarysurveys/lidnsbran ch/
[5] P. Ferrari, N. Slimani, A. Ciampi, A. Trichopoulou, A. Naska, C. Lauria, F. Veglia, H. Bueno-de-Mesquita, M. Ocké, M. Brustad, T. Braaten, M. José Tormo, P. Amiano, I. Mattisson, G. Johansson, A. Welch, G. Davey, K. Overvad, A. Tjønneland, F. Clavel-Chapelon, A. Thiebaut, J. Linseisen, H. Boeing, B. Hemon and E. Riboli, “Evaluation of Under- and Overreporting of Energy Intake in the 24-Hour Diet Recalls in the European Prospective Investigation into Cancer and Nutrition (EPIC),” Public Health Nutrition, Vol. 5, No. 6b, 2002,
pp. 1329-1345. doi:10.1079/PHN2002409
[6] D. W. Heerstrass, M. C. Ocke, H. B. Bueno-de-Mesquita, P. H. M. Peeters and J. C. Seidall, “Underreporting of Energy, Protein and Potassium Intake in Relation to Body Mass Index,” International Journal of Epidemiology, Vol.
27, No. 2, 1998, pp. 186-193. doi:10.1093/ije/27.2.186 [7] G. Johansson, Å. Wikman, A.-M. Åhrén, G. Hallmans
and I. Johansson, “Underreporting of Energy Intake in Repeated 24-Hour Recalls Related to Gender, Age, Weight Status, Day of Interview, Educational Level, Reported Food Intake, Smoking Habits and Area of Living,” Public Health Nutrition, Vol. 4, No. 4, 2001, pp.
919-927. doi:10.1079/PHN2001124
[8] S. S. Jonnalagadda, D. C. Mitchell, H. Smiciklas-Wright, K. B. Meaker, N. V. Heel, W. Karmally, A. G. Ershow and P. M. Kris-Etherton, “Accuracy of Energy Intake Data Estimated by a Multiplepass, 24-Hour Dietary Recall Technique,” Journal of the American Dietetic Association, Vol. 100, No. 3, 2000, pp. 303-311.
doi:10.1016/S0002-8223(00)00095-X
[9] S.-H. Kye, “Underestimation of Energy Intake Using 24-Hour Recall by Korean Urban Elders,” Ecology of Food and Nutrition, Vol. 43, No. 4, 2004, pp. 279-293. doi:10.1080/03670240490454697
[10] H. A. Park, J. S. Lee and L. H. Kuller, “Underreporting of Dietary Intake by Body Mass Index in Premenopausal Women Participating in the Healthy Women Study,”
Nutrition Research and Practice, Vol. 1, No. 3, 2007, pp.
231-236.
trition, Vol. 50, 1996, pp. 98-106.
[12] R. R. Briefel, M. A. McDowell, K. Alaimo, C. R. Caughman, A. L. Bischof, M. D. Carroll and C. L. Johnson, “Total Energy Intake of the US Population: The Third National Health and Nutrition Examination Survey, 1988-1991,” The American Journal of Clinical Nutrition,
Vol. 62, 1995, pp. 1072S-1080S.
[13] M. Fogelholm, S. Männistö, E. Vartiainen and P. Pietinen, “Determinants of Energy Balance and Overweight in Finland 1982 and 1992,” International Journal of Obesity, Vol. 20, No. 2, 1996, pp. 1097-1104.
[14] R. C. Klesges, L. H. Eck and J. W. Ray, “Who Under- Reports Dietary Intake in a Dietary Recall? Evidence from the Second National Health and Nutrition Examina- tion Survey,” Journal of Consulting and Clinical Psycho- logy, Vol. 63, No. 3, 1995, pp. 438-444.
doi:10.1037/0022-006X.63.3.438
[15] S. W. Lichtman, K. Pisarska, E. R. Berman, M. Pestone, H. Dowling, E. Offenbacher, H. Weisel, S. Heshka, D. E. Matthews and S. B. Heymsfield, “Discrepancy between Self-Reported and Actual Caloric Intake and Exercise in Obese Subjects,” The New England Journal of Medicine, Vol. 327, No. 27, 1992, pp. 1893-1898.
doi:10.1056/NEJM199212313272701
[16] E. Rothenbreg, I. Bosaeus and B. Steen, “Evaluation of Energy Intake Estimated by a Diet History in Three Free-Living 70 Year Old Populations in Gothenburg, Sweden,” European Journal of Clinical Nutrition, Vol.
51, 1997, pp. 60-66. doi:10.1038/sj.ejcn.1600363
[17] W. T. Smith, K. L. Webb and P. F. Heywood, “The Implications of Underreporting in Dietary Studies,”
Australian Journal of Public Health, Vol. 18, 1994, pp. 311-314. doi:10.1111/j.1753-6405.1994.tb00250.x [18] R. R. Briefel, C. T. Sempos, M. A. McDowell, S. Chien
and K. Alaimo, “Dietary Methods Research in The third National Health and Nutrition Examination Survey: Underreporting of Energy Intake,” The American Journal of Clinical Nutrition, Vol. 65, 1997, pp. 1203S-1209S.
[19] M. A. Mendez, S. Wynter, R. Wilks and T. Forrester, “Under- and Over-Reporting of Energy Is Related to Obesity, Lifestyle Factors and Food Group Intakes in Jamaican Adults,” Public Health Nutrition, Vol. 7, No. 1, 2004, pp. 9-19. doi:10.1079/PHN2003508
[20] WHO, “Global Database on Body Mass Index. World Health Organization in: An Interactive Surveillance Tool for Monitoring Nutrition Transition,” Geneva, 2009. http://www.who.int/bmi/index.jsp?introPage=intro_3.htm l
[21] M. Nelson, M. Atkinson and J. Meyer, “A Photographic Atlas of Food Portion Sizes,” Food Standards Agency,
London, 1997.
[22] M. Nelson, M. Atkinson and J. Meyer, “Food Portion Sizes: A User’s Guide to the Photographic Atlas,” Food Standards Agency, London, 1997.
[23] CompEat, Nutritional Analysis Software, in, Nutrition Systems, Banbury. Oxon. England, 2003.
[24] W. N. Schofield, “Predicting Basal Metabolic Rate, New Standards and Review of Previous Work,” Human Nutrition. Clinical Nutrition, Vol. 39, Suppl. 1, 1985, pp.
5-41.
[25] G. R. Goldberg, A. E. Black, S. A. Jebb, T. J. Cole, P. R. Murgatroyd, W. A. Coward and A. Prentice, “Critical Evaluation of Energy Intake Data Using Fundamental Principles of Energy Physiology: 1. Derivation of Cut-Off Limits to Identify Under-Recording,” European Journal of Clinical Nutrition, Vol. 45, No. 12, 1991, pp. 569-581.
[26] FAO/WHO/UNU, “Human Energy Requirements,” Food and Agriculture Organization and Nutrition Technical Report Series No. 1, FAO, Rome, 2004, pp. 1-103. [27] W. A. Ahmed, “Vitamin D Intake of People from the
Middle East living in the UK,” Biological Sciences, MPhil Thesis, University of Plymouth, Plymouth, 2009. [28] L. Johansson, K. Solvoll, G. E. Bjorneboe and C. A.
Drevon, “Under- and Overreporting of Energy Intake Related to Weight Status and Lifestyle in a Nationwide Sample,” The American Journal of Clinical Nutrition,
Vol. 68, 1998, pp. 266-274.
[29] M. Yannakoulia, D. B. Panagiotakos, C. Pitsavos, E. Bath- rellou, C. Chrysohoou, Y. Skoumas and C. Stefanadis, “Low Energy Reporting Related to Lifestyle, Clinical, and Psychosocial Factors in a Randomly Selected Popu- lation Sample of Greek Adults: The ATTICA Study,”
Journal of the American College of Nutrition, Vol. 26, No.
4, 2007, pp. 327-333.
[30] J. I. Macdiarmid and J. E. Blundell, “Dietary Under- Reporting: What People Say about Recording Their Food Intake,” European Journal of Clinical Nutrition, Vol. 51,
No. 3, 1997, pp. 199-200. doi:10.1038/sj.ejcn.1600380 [31] L. A. J. L. M. Braam, M. C. Ocke, H. B. Bueno-de-
Mesquita and J. C. Seidell, “Determinants of Obesity- Related Underreporting of Energy Intake,” American Journal of Epidemiology, Vol. 147, No. 11, 1998, pp.
1081-1086.
[32] B. L. Heitmann and L. Lissner, “Dietary Underreporting by Obese Individuals—Is It Specific or Non-Specific?”
British Medical Journal, Vol. 14, 1995, pp. 986-989.