ISSN Online: 2333-9721 ISSN Print: 2333-9705
DOI: 10.4236/oalib.1104966 Nov. 19, 2018 1 Open Access Library Journal
Error Analysis for Protein Conformation
Quantities in Circular Dichroism Spectrum
David A. Haner, Patrick W. Mobley
Department of Chemistry and Biochemistry, California State Polytechnic University, Pomona, California, USA
Abstract
The object of this paper is to present the development of the uncertainties of the parameter values produced by an algorithm for a mathematical model based on the spectroscopic signature of iconic conformations. Emphasis is given to including the systematic experimental error simultaneously with primary measured data and the use of fully determined solution of equations to unknowns. To demonstrate the details of finding the parameter uncertain-ties, the data from two independent publications are joined.
Subject Areas
Computational Biology
Keywords
Circular Dichroism, Protein Secondary Structure, Singular Value Decomposition, Error
1. Introduction
There is a large body of research literature concerning the development of tech-niques using circular dichroism spectroscopy (CD) to quantify the proportions of secondary structures present in a target protein [1]. Usually the CD data are interpreted in light of a database containing proteins for which both the CD spectra and X-ray analyses are known [2]. Because CD spectra of the database proteins and their X-ray-derived secondary structure coefficients (decimal frac-tions) have no error associated with them, no systematic error can be found for the target protein. However, one method for determination of secondary struc-tures postulates that a small group of CD spectra is representative of the second-ary structure spectral signatures [3]. These spectra are icons characteristic of the component structures or conformations. The publication is of particular interest How to cite this paper: Haner, D.A. and
Mobley, P.W. (2018) Error Analysis for Protein Conformation Quantities in Circular Dichroism Spectrum. Open Access Library Journal, 5: e4966.
https://doi.org/10.4236/oalib.1104966
Received: October 8, 2018 Accepted: November 16, 2018 Published: November 19, 2018
Copyright © 2018 by authors and Open Access Library Inc.
This work is licensed under the Creative Commons Attribution International License (CC BY 4.0).
DOI: 10.4236/oalib.1104966 2 Open Access Library Journal for it shows experimental data and further some measure of the experimental uncertainties in the primary data. These uncertainties are sparse in the protein CD literature even though an uncertainty for each spectral data point is essential. Fundamental spectroscopic data should be composed of two parts: the mean value data and the associated experimental error spectrum over the same band-pass. It is the experimental error spectra that determine the error analysis for the model parameters and is central to quantifying the effectiveness of the model. It is the objective of this presentation to revisit the data set of Greenfield and Fas-man [3] and to show how it can be used to provide an error analysis for the main secondary structures of a protein or changes in the secondary structure due to some alteration of a protein.
The mathematical model states that the CD spectra of proteins are equal to a linear combination of the spectral signature basis functions and the structural coefficients. The solution of this model usually employs linear least square (LSQ) of the basis functions to solve for the coefficients (or fractions) or factor analysis to use the coefficients to find the basis functions. The number of data points used to define the CD spectra corresponds to the number of points used to ex-press the basis functions. These data are represented by rectangular matrices and the linear model as a matrix equation. The theory of equations generally de-scribes the condition necessary for the number of equations and the number of unknowns as:
1) number of equations less than the number unknowns: under-determined, no unique solution,
2) number of equations equal to the number of unknowns: fully-determined, unique solution,
3) number of equations greater than the number of unknowns: over-determined, solution ambiguous.
Earlier researchers have employed the special adaptation to case (c) to simu-late case (b) by using averaging techniques, i.e. using matrix rank reduction. This process leaves CD-spectra that are “reduced” and the basis functions relate to these spectra, not the original data. The computed fractions correspond to the reduced components; there are no directly related error functions for the re-duced spectra to provide an error estimate in the calculated fractions.
The most direct approach is to develop a solution that is fully determined by using the same number of spectra as the number of secondary structures. In general, the mathematical model is of the form: D BF= where the matrices:
D = CD spectra B = basis functions
equa-DOI: 10.4236/oalib.1104966 3 Open Access Library Journal tion has not been articulated from first principles. However, if B and F were known to be related explicitly or are postulated to be related, a procedure can be developed to analyze a protein spectrum possessing the properties in correspon-dence to the initialized algorithm.
To fulfill the need for a systematic method to employ all the data in a way to determine how much confidence in the results is implied, a precise error func-tion is required for each entry of the data collecfunc-tion. Unfortunately, that is not what is usually found in the publications. Historically, primary data and their uncertainty indicators were frequently presented; the primary data are stored independently without any directly related precision indicator or measurement uncertainty. Looking back in the literature, an example was found where the primary data had observational uncertainties listed. That example is the raw data given by Greenfield and Fasman [3] for the postulated structural icons, al-pha-helix, beta-sheets and random coils, there are a few entries of the experi-mental observational errors. As a simplified guess at what the detailed error function might be, one was generated from Greenfield and Fasman [3] data as a simple linear relationship of 12% at 194 nm and 9% at 224 nm and applied to the mean spectra of all the protein CD spectra to be tested as no accompanying error spectrum was presented. This procedure furnishes in a theoretical way the two components of a complete database, the mean spectra and their corresponding error function over the same bandpass.
Theory
Mathematical modeling of experimental measurements is the development of parametric equations that map the computed results into points with direct as-sociation to the measurements as a consequence of the model parameters. It is essential that the experimental errors are analyzed using the algorithms em-ployed in sizing the model parameters to obtain their error estimates.
After the mathematical model for the measurements has been formulated and put into computational form, the solution starts by initializing the required functions and coefficients to set the algorithm for application to relevant target data. For the analysis of CD spectra to characterize the conformation content, the most direct approach is to develop a formulation that is fully determined by using the same number of spectra as the number of secondary structures or conformations. In general, the mathematical model is of the form
D BF=
The steps to solution were…
B and F are postulated initially for the icons. And since
X = projectors, pseudo reciprocal to B.
The analysis is set for the postulated chosen icons. Then XD = F is applied to the target protein database.
DOI: 10.4236/oalib.1104966 4 Open Access Library Journal for X and B are fixed by the selected three icons and used to predict structural fractions for the remaining independent protein spectra of the database. In order to track the influence of the experimental error, E, consider the mathematical model [4], thus
(
)
D E B F dF+ = +
[More is clear—The statistical error is estimated as standard deviation (may be reduced by repetition). However the measurement uncertainty of the instru-ment, or systematic error, is not statistical but variable at each data point (may be difficult to estimate).]
where dF = the error in the structural fraction for that protein and E = the spec-tral error function for that protein.
D E BF BdF+ = + D BF, and E BdF= =
or
(
)
X D E+ =XD XE F dF; E dF+ = + =
The solution of E = BdF for dF, where B = the basis functions fixed for the se-lected icons and dF is the propagated error for the fractions in the data analysis due to the spectral error function E. (Note that B and dF are unique for the in-itialization.) All computations E = BdF and XE = dF are found to give identical results.
2. Methods
This type of scientific modeling can be developed on digital computers using any of many high-level computational compilers. Microsoft FortranPowerstation Professional Development System, Version 1.0 for MS-DOS and Windows Op-erating Systems, running on a Dell Dimension 2400 PC was used here. Various subroutines were taken directly from the literature [5] [6] [7] (some of these subroutines are available in C in more recent publications by these authors), while the main programs were our adaptations written in the Fortran Powersta-tion above (very similar to Fortran 77). Singular Value DecomposiPowersta-tion (SVD) was checked by running the equivalent generalized matrix inversion. The data type was generally double precision.
DOI: 10.4236/oalib.1104966 5 Open Access Library Journal computational arrays must be adjusted to correspond. The Greenfield and Fas-man data were interpolated to the same 2 nm resolution as CJDB in the interval of 190 nm - 250 nm using a cubic spline algorithm. The amplitudes of the icon data were adjusted by reducing them by a factor of 4.3 to correspond to the CJDB spectrum of myoglobin.
Steps in Reproducing Methods
Just as everyone’s penmanship is unique the same is true of one’s coding. Valid-ity—get same answer for the same test problem [9]. Our data analysis algorithm generally follows the techniques of linear algebra: matrices and digital arrays. While the input data used here is not new, it is published and shows some de-sirable features to illustrate concomitant data functions—primary point spec-trum and it’s uncertainty or error. The algorithm uses rectangular matrices to manipulate the mathematical model which frequently utilizes the singular value decomposition technique. Legendre’s linear least-squares technique is used to express discrete data functions as parameters in a linear combination of basis functions/vectors. The relevance of this report is that it demonstrates the use of primary data error to predict the uncertainties in the parameter values.
The following are intended to help the reader develop this type of analysis gorithm for personal use. The outline shows the major steps employed in the al-gorithm:
Step 1. Preparation of primary data from literature
1) Spline interpolation of the three icon spectra to be congruent to the CJDB (or any database)
b) Area normalized to the icons, HA, and myoglobin of the CJDB (amplitude normalization)
c) Generate the empirical spectral error function of the data or proteins. d) Ensure congruency of all spectral arrays throughout the algorithm. Step 2. Find X, pseudo-inverse of B, the three iconic spectra: Initialize 1) Compute XD = F and XE = dF’ using projectors, X
2) Compute D = BF and E = BdF using least squares
Step 3. Results—parameters/fractions and uncertainties/errors.
Compare results generated from a. and b. of Step 2 for the CJDB. (should be the same)
Step 4. Change mathematical model and initialization.
Input data: Spectra of three selected proteins and their parameters computed in Step 2. (ie near) Yield new basis for initialization of algorithm. This step is repeated for another selection of the three proteins. (ie far)
Step 5. Compare the results from Step 4.
Differences are small as input data are from the same data domain. You now possess a data analysis algorithm which can be modified to meet your needs.
3. Results and Discussion
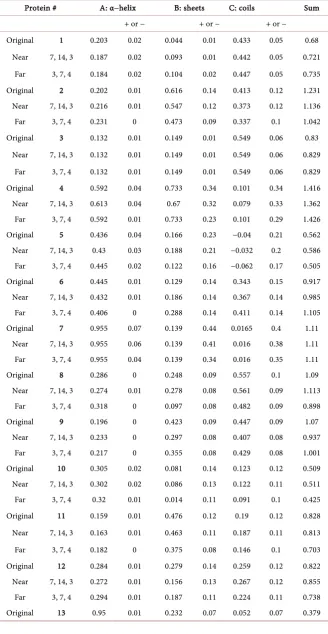
DOI: 10.4236/oalib.1104966 6 Open Access Library Journal proteins contained in the CJDB. The icon spectra were taken to represent the fundamental basis functions with corresponding fractions of one for initializa-tion of the algorithm. The pseudo reciprocals of the icon spectra produce the projectors for describing the presence of these conformations in the other pro-tein spectra (A, B, and C in the Original row in Table 1). Table 1 shows the component proportions of the icons making up the spectra of the CJDB, as well as the error estimate using the empirical error function. The summation shown in the last column is used as a summary of results for that protein. It shows the strength of the icon signature present in that protein.
Comparisons between proteins and of (substantially) the same protein in an altered state (mutation, different solvent, etc.) are quantified using the relation-ships between P(t1), P(t2), the values of the parameter instance one and the val-ue of the parameter at instance two and dP1, dP2, the uncertainties associated with the parameter at the two instances due to the experimental errors in the measurements.
If |P(t1) − P(t2)| ≤ |dP1| + |dP2| there is no detected change in the parameter between the two measurement instances.
If |P(t1) − P(t2)| > |dP1| + |dP2| a change in parameter has occurred in the two instances of measurement.
If no measurement errors are available, the experimental accuracy or model difference is at least ε = P t1 P t2
( ) ( )
− 2 .As stated above, this treatment can be applied to the same protein undergoing a change or entirely different proteins. Thus, in Table 1, protein 10-subtilisin BPN and protein 14-subtilisin NOVO are seen to have different A-alpha helix content: |P10 − P14| (|0.305 − 0.201|) > |dP10| + |dP14| (|0.020| + |0.020|), showing the different content is affirmed, 0.104 > 0.040. Without error bars one can’t be certain.
DOI: 10.4236/oalib.1104966 7 Open Access Library Journal Table 1. Fractional content of three iconic structures (with resolution) for three different initializations of proteins with known circular dichroism spectra.
Protein # A: α−helix B: sheets C: coils Sum
+ or − + or − + or −
Original 1 0.203 0.02 0.044 0.01 0.433 0.05 0.68 Near 7, 14, 3 0.187 0.02 0.093 0.01 0.442 0.05 0.721
Far 3, 7, 4 0.184 0.02 0.104 0.02 0.447 0.05 0.735 Original 2 0.202 0.01 0.616 0.14 0.413 0.12 1.231 Near 7, 14, 3 0.216 0.01 0.547 0.12 0.373 0.12 1.136 Far 3, 7, 4 0.231 0 0.473 0.09 0.337 0.1 1.042 Original 3 0.132 0.01 0.149 0.01 0.549 0.06 0.83
Near 7, 14, 3 0.132 0.01 0.149 0.01 0.549 0.06 0.829 Far 3, 7, 4 0.132 0.01 0.149 0.01 0.549 0.06 0.829 Original 4 0.592 0.04 0.733 0.34 0.101 0.34 1.416 Near 7, 14, 3 0.613 0.04 0.67 0.32 0.079 0.33 1.362 Far 3, 7, 4 0.592 0.01 0.733 0.23 0.101 0.29 1.426 Original 5 0.436 0.04 0.166 0.23 −0.04 0.21 0.562 Near 7, 14, 3 0.43 0.03 0.188 0.21 −0.032 0.2 0.586 Far 3, 7, 4 0.445 0.02 0.122 0.16 −0.062 0.17 0.505 Original 6 0.445 0.01 0.129 0.14 0.343 0.15 0.917 Near 7, 14, 3 0.432 0.01 0.186 0.14 0.367 0.14 0.985 Far 3, 7, 4 0.406 0 0.288 0.14 0.411 0.14 1.105 Original 7 0.955 0.07 0.139 0.44 0.0165 0.4 1.11
Near 7, 14, 3 0.955 0.06 0.139 0.41 0.016 0.38 1.11 Far 3, 7, 4 0.955 0.04 0.139 0.34 0.016 0.35 1.11 Original 8 0.286 0 0.248 0.09 0.557 0.1 1.09 Near 7, 14, 3 0.274 0.01 0.278 0.08 0.561 0.09 1.113
Far 3, 7, 4 0.318 0 0.097 0.08 0.482 0.09 0.898 Original 9 0.196 0 0.423 0.09 0.447 0.09 1.07
DOI: 10.4236/oalib.1104966 8 Open Access Library Journal Continued
Near 7, 14, 3 0.119 0.01 0.156 0.06 0.03 0.07 0.305 Far 3, 7, 4 0.11 0 0.187 0.04 0.042 0.06 0.339 Original 14 0.201 0.02 0.465 0.16 0.038 0.15 0.704 Near 7, 14, 3 0.201 0.02 0.465 0.15 0.038 0.15 0.704 Far 3, 7, 4 0.242 0.01 0.288 0.1 −0.062 0.12 0.488 Original 15 0.46 0.04 0.398 0.27 0 0.25 0.863 Near 7, 14, 3 0.467 0.04 0.376 0.25 0.001 0.24 0.845 Far 3, 7, 4 0.486 0.02 0.29 0.18 0.039 0.21 0.138 Original 16 1.905 0.11 −0.69 0.71 0.219 0.62 1.43
Near 7, 14, 3 1.877 0.09 −0.594 0.64 0.261 0.58 1.543 Far 3, 7, 4 1.912 0.1 −0.706 0.64 0.222 0.57 1.427 Original: conformation fractions of protein derived from using the three iconic conformations, Near: initia-lization with three proteins with spectra most like icons (e.g. after original treatment protein 7-myoglobin was most like icon A), Far: three proteins with spectra least like icons; A, B, and C are the iconic conformations; + or − is dF: parameter resolution; Sum is the sum of secondary structures cal-culated. Proteins of the database: 1-α-chymotrypsin, 2-cytochrome c, 3-elastase, 4-hemoglobin, 5-lactate dehydrogenase, 6-lysozyme, 7-myoglobin, 8-papain, 9-ribonuclease A, 10-subtilsin BPN, 11-flavodoxin, 12-glyceraldehyde-3-phosphate dehydrogenase,13-prealbumin, 14-subtilisin NOVO, 15-triosephosphate isomerase, 16-poly(L-glutamic acid).
of the iconic spectra, these are called “far.” The far results were expected to show greater variations from the iconic analysis. The results obtained for these two applications (near and far) by the algorithm are presented in Table 1 with the primary icons results for comparison.
Note that there is the general agreement for all three initializations for the iconic conformation A for all the proteins except number 16. Number 16 protein parameter values suggest it does not belong to this database. Also, there are nine cases where the magnitude of parameter values are smaller than that of the un-certainty values, and six of these are found in the protein numbers 5, 7, and 10. In general there is a large component error estimate for B and C in comparison to A. There are several reasons this could be true. First is the lack of certainty in the data sets used and secondly the general utility of the icon model. Thus, the method, while valuable to a secondary structure study, may have the greatest utility with an experiment in which a change in the protein results in a change in the alpha helix content. (Note that the alpha helix and the, yet to be discovered, polyproline-2 helix are both formed by intramolecular H-bonds while the sheets are formed by intermolecular H-bonds [usually anti-parallel since the ends are of opposite charge] [10].)
4. Summary and Conclusions
syste-DOI: 10.4236/oalib.1104966 9 Open Access Library Journal matic error. Especially in the case of altering a protein, one needs to have a measure of the variability (precision indices) of the beginning and ending states to be sure that a change has taken place. It is this measure of variability that has been absent from almost all of the circular dichroism-derived secondary struc-ture analyses.
4.1. Algorithm
The data shown in Table 1 present the three related initializations of the icon conformation algorithm. The calculated values of the conformation strengths for the icons and their uncertainties show the utility of using mean value spectral data and the accompanying error functions (although empirical in this case). By comparing the conformation strength values with the uncertainties for each protein of the database, it is noted that in nearly all instances, the three confor-mation values are clustered within the overlapping uncertainty intervals. This consistency of results shows the importance of initializing the algorithm using conformation fractional coefficients from the same spectroscopic domain. The general agreement of the conformation strengths and their uncertainties for each of the 15 proteins of the database shows that the model was suitable to apply to this group of proteins.
4.2. Model
The postulates of defining the basis function or icons and their strengths or frac-tions as distinct spectroscopic components are in effect saying that protein CD spectra are constructed from the superposition of these spectroscopic signatures. These postulates lead to fully determined solutions that then lead to mathemati-cal simplification in performing the data reduction of other target protein spec-tra. The identification of spectroscopic icons corresponding to β-turns, 3 - 10 helix, etc. to their spectroscopic signatures is required to extend this type of modeling. The ideas of modeling can be instituted for different classes of macro molecules of interest. The visualization of the protein structure as alpha helix, 3 - 10 helix, beta sheets, turns, coils, etc. may not be possible to formulate in such a simple mathematical model as D BF= . However, if spectroscopically derived
fractions and corresponding X-ray crystallography fractions were known, per-haps the connecting transformation would be useful.
4.3. Error
DOI: 10.4236/oalib.1104966 10 Open Access Library Journal wavelengths where the spectroscopic signals are the weakest, which are not uni-form over the bandpass. They are frequently considered a weighting function.
Since in general the measurement error is composed of random error and systematic error, it is with measurement repetition that the magnitude of the er-ror can be estimated. This might be estimated by logging an independent mea-surement spectrum of a unique species as an array for each of the n trials with-out any digital smoothing. Singular value decomposition is then performed on this data array. The singular values should indicate one very dominant value (rank unity). Thus the data are partitioned into primary factor and error. The compression of the reproduced two components of the original data gives the average spectrum and the error spectrum of the species.
Some error spectrum is desirable even if it is empirical and simple, for it acts as a gauge for marking the uncertainty interval on the variables. The comparable variable points lying within adjoining uncertainty flags are corroborative, while those with no overlap are not supporting. With no error bars for comparable points, the points must superimpose. If not, why?
4.4. Future Work
Due to the fact that fundamental data for the Greenfield and Fasman icons were taken some years ago, the CD spectral data need to be developed again using the current technologies and the increased bandpass of synchrotron radiation CD and to carefully obtain the corresponding conformation uncertainty spectrum. The protocols and calibration procedures need to be articulated [12] and fol-lowed as proscribed by the biochemical societies, e.g. see Whitmore and Wallace
[2] and Greenfield [11]. Also, concurrently, it would be helpful if X-ray crystal-lographic data could be generated for an aliquot of icon samples. This would furnish a gold standard set of data to initialize the mathematical model and to assist in extending the model to more icons.
Continued and future work will be to develop the mathematical procedures and algorithms required to extract the spectroscopic factors contained in a CD database without including related data from other experimental domains.
Conflicts of Interest
The authors declare no conflicts of interest regarding the publication of this pa-per.
References
[1] Kelly, S.M., Jess, T.J. and Price, N.C. (2005) How to Study Proteins by Circular Dichroism. Biochimica et Biophysica Acta, 1751, 119-139.
https://doi.org/10.1016/j.bbapap.2005.06.005
[2] Whitmore, L. and Wallace, B.A. (2008) Protein Secondary Structure Analyses from Circular Dichroism Spectroscopy: Methods and Reference Databases. Biopolymers, 89, 392-400. https://doi.org/10.1002/bip.20853
DOI: 10.4236/oalib.1104966 11 Open Access Library Journal the Evaluation of Protein Conformation. Biochemistry, 8, 4108-4116.
https://doi.org/10.1021/bi00838a031
[4] Hildebrand, F.B. (1987) Introduction to Numerical Analysis. 2nd Edition, Dover Publications, New York, 704 p.
[5] Bevington, P. (1969) Data Reduction and Error Analysis for the Physical Sciences. McGraw-Hill, New York, 336 p.
[6] Forsythe, G.E., Malcolm, M.A. and Moler, C.B. (1977) Computer Methods for Ma-thematical Computations. Prentice-Hall, Inc., Englewood Cliffs, NJ, 259 p.
[7] Press, W.H., Flannery, P.P., Teukolsky, S.A. and Vetterling, W.T. (1986) Numerical Recipes. UP Cambridge, Cambridge, 818 p.
[8] Compton, L.A. and Johnson, W.C. (1986) Analysis of Protein Circular Dichroism Spectra for Secondary Structure Using a Simple Matrix Multiplication. Analytical Biochemistry, 5, 155-167.https://doi.org/10.1016/0003-2697(86)90241-1
[9] Haner, D.A. and Mobley, P.W. (2015) Simulations Relating to the Determination of Protein Secondary Structure Fractions from Circular Dichroism Spectra. Open Access Library Journal, 2, 1-10.https://doi.org/10.4236/oalib.1101601
[10] Woody, R.W. (2015) The Development and Current State of Protein Circular Dichroism. Biomedical Spectroscopy and Imaging, 4, 5-34.
[11] Greenfield, N.J. (2006) Using Circular Dichroism Spectra to Estimate Protein Sec-ondary Structure. Nature Protocols, 1, 2876-2890.
https://doi.org/10.1038/nprot.2006.202
[12] Hennessey, J.P. and Johnson, W.C. (1981) Information Content in the Circular Dichroism of Proteins. Biochemistry, 20, 1085-1094.