Do membrane proteins cluster without binding
between molecules?
Xin Wang, Toshihiko Fukamachi, Hiromi Saito, Hiroshi Kobayashi*
Department of Biochemistry, Graduate School of Pharmaceutical Sciences, Chiba University, Chiba, Japan; *Corresponding Author: hiroshi@p.chiba-u.ac.jp, hiroshi.k@mx6.ttcn.ne.jp
Received 19 December 2011; revised 20 January 2012; accepted 15 February 2012
ABSTRACT
Clustering is a basic event for the initiation of immune cell responses, and simulation analyses of clustering of membrane proteins have been performed. It was claimed that a cluster is formed by the self-assembly induced by protein dimerization with a high binding speed (Woolf and Linderman, Biophys. Chem. 104, 217-227, 2003). We examined the cluster formation with Monte Carlo simulation using two algorithms. The first was that simulation processes were divided into two substeps. All proteins were subjected to movement in the first substep, fol-lowed by reaction in the second substep. The second algorithm was that proteins were first selected to react and proteins which did not re-act were subjected to movement. The self-as- sembly induced by dimerization was simulated only with the second algorithm. In this algorithm, monomers dissociated from dimers do not move because these monomers are not selected for movement, and a large proportion of such mono- mers are selected to form dimers in the next step. The self-assembly was again simulated with the first algorithm containing the conditions that monomers dissociated from dimers did not move in the next movement substep. This algo-rithm seems to be far removed from natural con- ditions. Thus, it is inferred that the self-assembly induced by dimerization is unlikely in situ, and that some interaction between proteins is re-quired for cluster formation. In contrast to algo-rithms in previous simulations, our results sug- gest that it is more appropriate that proteins move to the same direction for a while and re-flect when the collision occurs.
Keywords:Cluster Formation; Monte Carlo Simulation; Self-Assembly; Immune Cells; Membrane Proteins
1. INTRODUCTION
Cellular signal transduction is initiated by the binding of a ligand to its receptor. The receptor generally func-tions in complex forms including homo- and hetero- multimers before and after the ligand binding [1-5]. Clustering of transmembrane proteins on the cell surface was proposed in the lipid raft model of the plasma mem-brane [6]. Cholesterol, unsaturated sphingolipids and lipid modified proteins etc. do not distribute uniformly in the plasma membrane [7]. It is suggested that proteins may exist in “protein islands” connected to the cy-toskeleton molecules (protein island model) [8]. Foreign antigens are recognized by T cell antigen receptors (TCR) on the cell surface, and the T cells become activated to initiate an immune response [9]. The membrane organi-zation of TCR on the T cell surface has been investigated [10-12]. Similarly, a linker of activated T cells (LAT) was also proposed to exist in “protein islands” on the surface of mast cells and T cells [13]. Microscopic tech-niques have shown separate clusters of TCR and LAT in pre-activated T cells, and these clusters transiently con-catenate into microclusters upon antigen recognition [14]. The co-stimulation of TCR with CD28 was reported to require co-localization of TCR and CD28 at the plasma membrane [15].
It has remained unclear why such complex formation is required for signal initiation and how the complex is formed. It is hard to answer these questions experimen-tally because we have still few useful methods to manipu-late the complex formation without affecting the function of the proteins themselves. One method to facilitate such examination would be kinetic analysis with the aid of a computer.
cell-to-cell population heterogeneity [16].
Since one cell contains less than 100,000 molecules of a given membrane protein and because there are varia-tions in biological phenomena, the latter method may be more appropriate. Receptor-ligand formation and clus-tering of membrane proteins have already been simulated with Monte Carlo techniques [16-21], and their results revealed the usefulness of this technique for clarification of biological phenomena.
Various physiological meanings of the clustering of membrane proteins have been proposed [22-27], but the mechanism for this cluster formation remains unclear, although a few mechanisms have been proposed [17,18,28]. Woolf and Linderman [17] proposed that self-assembly is induced by protein dimerization when the binding speed is higher than the diffusion rate of proteins. We found in this study that different algorithms for Monte Carlo simulation gave different results concerning the cluster formation. The self-organization proposed by Woolf and Linderman [17] was seen in some algorithms, while cluster formation independent of the rate of the dimerization was simulated in other algorithms. We dis-cussed which algorithm was more appropriate for the simulation of complex formation of membrane proteins,
and concluded that the self-organization is unlikely in
situ.
2. METHODS
In the present study, a simplified model in which the cell surface is represented as a 2-dimensional plane was assumed, and the cell surface was divided into subspaces. A single subspace was a cubic box with a volume of 166
(5.53) nm3, as described previously [16]. One molecule
per subspace corresponded to a concentration of 10 mM. Each calculation step was assumed to take 0.02 milli-seconds. In all events of our Monte Carlo procedure, real-type pseudo uniform random numbers (N) with the range 0 ≤ N < 1 were generated, as reported previously [29]. All proteins were initially distributed into randomly selected subspaces with equal probability. When a se-lected subspace was occupied, the next subspace was selected randomly. Dimer formation was assumed as follows: The binding of two proteins was accepted when the two proteins occupied neighboring subspaces and N
was less than exp(–ΔE1/RT), where ΔE1, R and T are the
activation energy, the gas constant and the absolute tem-perature, respectively. Correspondingly, dimers
dissoci-ated when N was less than exp(–ΔE2/RT).
Each protein was assumed to have a movement direc-tion (positive or negative direcdirec-tion on each axis), and a diffusion rate (υM). In this study, the movement direction
was set randomly, and υM was set to υ or υ/10, where υ
had a Maxwell-Boltzmann distribution from 0 to 999. The probability to have υ (P(υ)) was calculated as
fol-lows.
1000
0
P = B S, where S= B ,
and B
= 2
πb6
22exp
2b2
2
when m
m+1
0 υ 0
N P and N< P , was set to m.
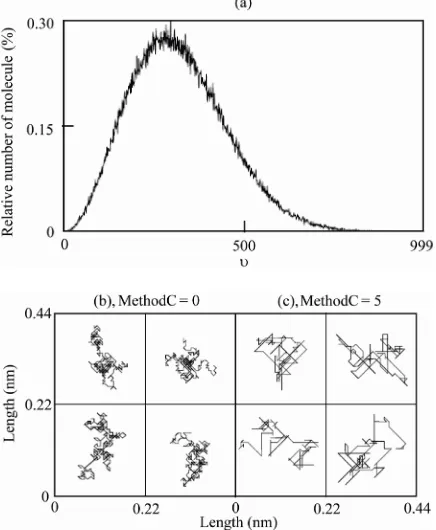
When b was set to be 0.005, a Maxwell-Boltzmann distribution of υ was obtained as shown in Figure 1(a),
and P(998) and P(999) were 1 and 0, respectively. Pro-teins moved into their neighboring subspaces according to their movement direction when υM > τ, where τ is a
pseudo uniform random number (0 ≤ τ <1000) obtained
by multiplication of N by 1000. Its integer part was used
for the rapid simulation. When υM = 0, the proteins
re-mained in the same subspace. Proteins moved to the op-posite side based on periodic boundary conditions when they reached the boundaries of the simulation box. If the opposite side was occupied, the protein was reflected in the mirror direction. If the protein was a part of a dimer, the protein was allowed to pivot around its partner in a random direction. If the target subspace was occupied, the rotation was rejected and not repeated. The move-ment and rotation of dimers occurred at the same simula-tion step.
The present simulation included two events; move-ment and reaction for the formation and dissociation of dimers. We assumed the following methods for the selec-tion of proteins subjected to movement or reacselec-tion.
MethodA = 0: Simulation processes were divided into two substeps, reaction and movement. All proteins were subjected to reaction and movement in the former and latter substeps, respectively. The reaction substep was carried out after the movement substep.
MethodA = 1: Proteins were first selected to react in each step. Monomers and dimers were converted to dimers and monomers, respectively, according to the reaction probability described above. Proteins that did not react were subjected to movement.
The movement directions of new molecules produced by the formation or the dissociation of dimers were
de-termined randomly, and υM of such molecules was
de-termined as follows.
MethodB = 0: υM was always set to 999.
MethodB = 1: υM that had a Maxwell-Boltzmann
dis-tribution was set as described above. MethodB = 2: υM was always set to 0.
When proteins were not reacted, the movement direc-tion and υM of such proteins were updated as follows.
MethodC = 0: The movement direction and υM of all
their movement direction and υM as described above. If
the subspace was occupied, the movement was rejected and not repeated.
MethodC = 1: The movement direction and υM of
0.1 % of molecules selected randomly were updated at every step. If the subspace was occupied, the movement was rejected and not repeated.
MethodC = 2: If the subspace was occupied, the
mole-cule was reflected in the mirror direction. υM was not
updated.
MethodC = 3: If the subspace was occupied, the
mole-cule was reflected in the mirror direction, and υM was
updated.
MethodC = 4: This method included the conditions of both MethodC = 1 and MethodC = 2.
MethodC = 5: This method included the conditions of both MethodC = 1 and MethodC = 3.
The trajectories of the membrane proteins are shown in Figures 1(b) and (c).
Cluster size was defined as follows: All proteins pre-sented in neighboring subspaces were defined as be-longing to the same cluster, and the cluster size was measured by counting all kinds of proteins in the cluster.
[image:3.595.305.540.395.600.2]The source code of the computing program was im-plemented using the C-language with Visual Studio
Figure 1. Distribution of diffusion rates and trajectories of mem-brane protein movement. (a) Distribution of diffusion rates. For details, see text. ((b) and (c)) The positions of a given protein were plotted for 1 × 10⁵ steps (2 sec) at intervals of 10 steps (0.2 msec).
MethodC = 0 (b) and MethodC = 5 (c) were used. The numbers of subspaces and proteins set in this simulation were 80 × 80 and 960, respectively. For details, see text.
C++.net (Microsoft Co.), and the program was run on a personal computer under Windows XP or 2000 (Micro-soft Co.). The source code is available from the corre-sponding author upon request.
3. RESULTS AND DISCUSSION
In the present simulations, the binding probabilities
(exp(–E1/RT)) were set as shown in Table 1. To
simu-late the binding rate constant (k), the simulation surface was assumed to contain 80 × 80 subspaces and the num-ber of proteins was set to 960. The binding rate constant was calculated from 100 simulated values with 10
dif-ferent E1 values. The constants were obtained with two
other simulation surfaces consisting of 50 × 50 and 100 × 100 subspaces containing 750 and 500 proteins,
respec-tively. The average values are shown in Table 1. The
dissociation probabilities (exp(–E2/RT)) were set to
one-tenth of the binding probability in all simulations. The average diffusion coefficients calculated from the moving distances of 1000 proteins as described previ-ously [16] are shown in Table 2. In this calculation,
[image:3.595.64.282.400.665.2]pro-teins are allowed to move even if the target subspace is occupied.
Table 1. Binding rate constants.
E1/RT* binding
probability constant (binding rate k)** log(k)
0.01 0.99 (1.04 ± 0.32) × 107 7.02
0.11 9.0 × 10⁻¹ (9.75 ± 2.90) × 106 6.99
1.20 3.0 × 10⁻¹ (4.51 ± 0.68) × 106 6.65
2.41 9.0 × 10⁻² (1.61 ± 0.07) × 106 6.21
3.50 3.0 × 10⁻² (5.45 ± 0.42) × 105 5.74
4.71 9.0 × 10⁻³ (1.58 ± 0.06) × 105 5.20
5.81 3.0 × 10⁻³ (5.38 ± 0.51) × 104 4.73
7.01 9.0 × 10⁻⁴ (1.60 ± 0.07) × 104 4.20
8.11 3.0 × 10⁻⁴ (5.66 ± 0.31) × 103 3.75
9.32 9.0 × 10⁻⁵ (1.64 ± 0.05) × 103 3.21 *See Methods, **M–1·sec–1.
Table 2. Diffusion coefficients.
MethodC M Diffusion coefficient (m2/s)
0 0.166 ± 0.005
0 0.0169 ± 0.0004
1 12.8 ± 0.5
[image:3.595.309.539.642.736.2]In the first simulation (Figure 2), a simulation surface
consisting of 80 × 80 subspaces and 960 monomers were set. Fifteen percent of subspaces were occupied by pro-teins under these conditions. The average cluster size was the same at all binding rate constants in Method 0-1-0 (This means MethodA = 0, MethodB = 1, MethodC
= 0) as shown in Figure 2(a). This cluster may be
[image:4.595.58.285.203.573.2]formed without interaction between molecules at a high protein density due to proteins not being distributed uni-
Figure 2. The average cluster size and the number of dimers
when the molecular density was 4950 proteins per μm2 and υ M was υ/10. The cell surface consisted of 80 × 80 subspaces, and the number of proteins was initially set to 960. Fifteen percent of subspaces were initially occupied with proteins. The diffu-sion rate of proteins (υM) was set to υ/10. Methods used are indicated in the figures. After the reaction reached equilibrium stage, the total number of monomers and dimers was calculated in each cluster at each step, and average values were obtained (closed circles). The number of dimers at each step was calcu-lated and the average percentage of proteins that formed dimers was obtained (open circles). Each point represents the average values obtained from 100 measurements, and standard devia-tions were less than 5% in all measurements. The horizontal line represents the binding rate constant (k).
formly at a given moment. The size of such clusters
in-creases as the protein density inin-creases as shown in
Fig-ures 2(a), 3(a) and 4(a).
Woolf and Linderman [17] proposed that the cluster-ing increased when the bindcluster-ing rate constant was high. In their simulation, molecules were first subjected to reac-tion and molecules that were not reacted were subjected to movement. The cluster size increased as the binding rate constant increased under their conditions (Method
1-1-0, Figure 2(b)). The same results were obtained in
Method 1-0-1, Method 1-1-1, and Method 1-1-5 (data not shown). In this method (MethodA = 1), monomers dissociated from dimers do not move because these
Figure 3. The average cluster size and the
[image:4.595.340.507.251.645.2]monomers are not selected for movement. In the next step, a large proportion of such monomers are selected again to form dimers when the binding rate constant is high. This means that a large proportion of dissociated monomers form dimers again without moving at the next step. Therefore, the cluster size is larger at a high binding rate constant. In contrast, when the reaction and move-ment events are repeated at every step (MethodA = 0), dissociated monomers have the same potential to associ-ate as monomers formed at previous steps. The same results were obtained with different protein densities except that the cluster size and number of dimers
in-creased as the density inin-creased ((a) and (b) in Figures
2-4). To confirm this explanation, the moving energy of
dissociated monomers was set to zero in MethodA = 0,
i.e., such monomers do not move in the next step. As
shown in Figure 2(c), the cluster size increased as the
binding rate constant increased.
The increase in the cluster size accompanies a decrease in entropy. In the simple model used in this simulation, no additional energy was supplied for the decrease in en- tropy when the binding rate constant increased. Therefore, it is reasonable to assume that cluster size is constant at any binding rate constant, suggesting that MethodA = 1 is inadequate. MethodB = 0 and MethodB = 2 seem to be far removed from natural conditions. Therefore, MethodA = 0 and MethodB = 1 seem to be adequate.
The next point is which method is more appropriate in MethodC. In the method described above, the diffusion rates and movement directions of all molecules were updated immediately before the movement in every step. However, it is more reasonable to assume that each molecule has a different molecular activity, namely a different diffusion rate, and keeps the same energy for a while. Therefore, MethodC = 0 is less likely.
The question is thus when does the molecular activity change? We first assumed that 0.1 % of molecules se-lected randomly were updated in every step (MethodC = 1). The average cluster size decreased as the binding rate constant increased in these conditions, while the decrease
in the number of dimers was small (Figure 2(d)). This
decrease was similar when the density of proteins in-creased 2-fold (Figure 3(c)) and small at a low density of
proteins (Figure 4(c)). In this simulation, when a protein
[image:5.595.352.496.84.466.2]ran against another protein, its movement was cancelled and its movement direction was not updated. When the binding rate constant was high, each such protein formed a dimer with its neighboring protein immediately, and the movement direction of the dimer was newly assigned. Consequently, the dimer moved away, resulting in a de-crease in the cluster size. In contrast, when the binding rate constant was low, proteins that ran against another protein in cluster stayed in the same subspaces for a long time until the proteins were subjected to reaction. This
Figure 4. The average cluster size and
the number of dimers when the molecu-lar density was 1650 proteins per μm2 and υM was υ/10. The simulation condi-tions were the same as in Figure 2 ex-cept that the cell surface consisted of 100 ×100 subspaces and the number of proteins was initially set to 500. Five percent of subspaces were initially oc-cupied by proteins.
may be the reason for the increase in cluster size at a low binding rate constant.
It is likely that the molecular energy is changed when a collision between molecules occurs in the natural case. In the next simulation, the diffusion direction was up-dated only when a protein ran against another protein (MethodC = 2). The average cluster size was the same
for all binding rate constants (Figure 2(e)). The same
results were obtained when both diffusion rate and direc-tion were updated only when a molecule ran into another
molecule (MethodC = 3, Figure 2(f)). It is likely that
col-lision. The same results were obtained in MethodC = 4 and 5 which included the updating of 0.1% of molecules at every step (MethodC = 1) in addition to the conditions
of MethodC = 2 and 3, respectively (Figures 2(g) and
(h)). The cluster sizes were the same again in MethodC =
2 to 5 at the protein densities described in Figures 3 and
4 (data obtained with MethodC = 2 to 4 are not shown).
The binding rate constants measured experimentally were less than 1 × 10⁷ M–1·sec–1 [30-33]. When the
bind-ing rate constant was less than 5 × 10⁶ M–1·sec–1, all
methods used in the present simulation gave similar
re-sults except Method 0-1-1 (Figures 2-4). However, it
may be better to use Method 0-1-5.
In MethodC = 1, 4, and 5, 0.1% of proteins selected randomly were updated in every step. It remains unclear whether or not this setting is the most appropriate. The trajectories in MethodC = 5 (Figure 1(c)) were similar to
those observed experimentally [34]. Although more de- tailed experimental data are required for more proper setting, 0.1% is probably appropriate.
When the diffusion coefficient of molecules was in- creased 10 fold (υM = υ), similar results were obtained
except that the cluster size decreased more dramatically as the binding rate constant increased as compared with the lower diffusion coefficient (Figure 5(c)). The
diffu-sion coefficient of membrane proteins observed experi-mentally was 0.1 to 0.3 μm2·sec–1 in prokaryotes [35] and
eukaryotes [36,37], and the diffusion coefficient in the setting of υM = υ was 12.8 μm2·sec–1 in MethodC = 1.
Therefore, this setting may be less appropriate. It should be noted that the same diffusion coefficient was obtained in MethodC = 1 to 5 because proteins were allowed to move even if the target subspace was occupied when the diffusion coefficient was calculated.
Our present simulations with appropriate algorithms demonstrated that the cluster size was dependent on nei- ther the diffusion coefficient nor the binding speed of proteins at all protein densities tested. Thus, the self-as- sembly induced by protein dimerization with a high binding speed is unlikely in situ.
[image:6.595.353.495.82.460.2]GPCRs have been shown to form not only dimers but also oligomers [23,38-40], but structural studies of these receptors have suggested them to have only one pro-tein-protein binding site [41]. It may be possible for a membrane protein complex to be formed without such binding site. One possibility is that the hydrophilic sur-face regions of membrane proteins might bind each other in the membranes. Another possibility is that matrix pro-teins in the outer or inner cell surface trap membrane proteins in a local area to increase the protein density. It was observed that membrane proteins undergoing Brownian diffusion were confined within a limited area, probably by the binding to a membrane-associated cytoskeleton network [42]. In any case, some interaction between
Figure 5. The average cluster size and
the number of dimers when the molecu-lar density was 4950 proteins per μm2 and υM was υ. The simulation conditions were the same as in Figure 2 except that the diffusion rate of proteins (υM) was set to υ.
proteins may be required for the cluster formation of membrane proteins on the cell surface at a low protein density observed experimentally.
4. CONCLUSIONS
lated with the second algorithm, while the cluster size was dependent on neither the diffusion coefficient nor the binding speed of proteins with the first algorithm. In the second algorithm, monomers dissociated from dimers do not move because these monomers are not selected for movement, and a large proportion of such monomers are selected to form dimers before their movement in the next step. The self-organization was again simulated in the former algorithm containing the conditions that the monomers dissociated from dimers did not move in the next movement substep. This algorithm seems to be far removed from natural conditions. Thus, it is inferred that the self-assembly induced by protein dimerization is
unlikely in situ, and that some interaction between
pro-teins is required for the cluster formation.
The second algorithm has been used in many previous works, but the present simulation suggests that the first one is more appropriate. We also examined which algo-rithm was more appropriate for the molecular movement. It has been assumed in many previous simulations that molecules move to the neighboring subspace randomly in each simulation step. In this study, it was shown to be more appropriate that molecules continued to have the same movement direction for a while and the direction was changed at the step selected randomly. Many previ-ous studies adopted the algorithm that the movement was cancelled when the collision occurred. The present study demonstrated that this algorithm was less appropriate, and molecules should change their movement direction in a mirror manner when the neighboring subspace was occupied. It should be clarified in future simulations which interaction is required for clustering of membrane proteins observed experimentally using these appropriate methods.
REFERENCES
[1] Horejsi, V. (2003) The roles of membrane microdomains (rafts) in T cell activation. Immunological Reviews, 191,
148-164. doi:10.1034/j.1600-065X.2003.00001.x [2] Luna, E.J. and Hitt, A.L. (1992) Cytoskeleton-plasma mem-
brane interactions. Science, 258, 955-964.
doi:10.1126/science.1439807
[3] Zacharias, D.A., Violin, J.D., Newton, A.C. and Tsien, Y.R. (2002) Partitioning of lipid-modified monomeric GFPs into membrane microdomains of live cells. Science,
296, 913-916. doi:10.1126/science.1068539
[4] Sharma, P., Varma, R., Sarasij, R.C., Ira, Gousset, K., Kris- hnamoorthy, G.G., Rao, M. and Mayor, S. (2004) Nano-scale organization of multiple GPI-anchored proteins in living cell membranes. Cell, 116, 577-589.
doi:10.1016/S0092-8674(04)00167-9
[5] Leksa, V., Godar, S., Schiller, H.B., Fuertbauer, E., Muham- mad, A., Slezakova, K., Horejsi, V., Steinlein, P., Weidle, U.H., Binder, B.R. and Stockinger, H. (2005) TGF-beta-
induced apoptosis in endothelial cells mediated by M6P/ IGFII-R and mini-plasminogen. Journal of Cell Science,
118, 4577-4586. doi:10.1242/jcs.02587
[6] Simons, K. and Ikonen, E. (1997) Functional rafts in cell membranes. Nature, 387, 569-572. doi:10.1038/42408 [7] Rietveld, A. and Simons, K. (1998) The differential
mis-cibility of lipids as the basis for the formation of func-tional membrane rafts. Biochimica et Biophysica Acta,
1376, 467-479.
[8] Lillemeier, B.F., Pfeiffer, J.R., Surviladze, Z., Wilson, B.S. and Davis, M.M. (2006) Plasma membrane-associated proteins are clustered into islands attached to the cy- toskeleton. Proceedings of the National Academy of Sci- ences of the United States of America, 103, 18992-18997.
doi:10.1073/pnas.0609009103
[9] Smith-Garvin, J.E., Koretzky, G.A. and Jordan, M.S. (2009) T cell activation. Annual Review of Immunology,
27, 591-619.
doi:10.1146/annurev.immunol.021908.132706
[10] Molnar, E., Dopfer, E.P., Deswal, S. and Schamel, W.W. (2009) Models of antigen receptor activation in the design of vaccines. Current Pharmaceutical Design, 15, 3237-
3248. doi:10.2174/138161209789105216
[11] Molnar, E., Deswal, S. and Schamel, W.W. (2010) Pre- clustered TCR complexes. FEBS Letters, 584, 4832-4837. doi:10.1016/j.febslet.2010.09.004
[12] Schamel, W.W., Arechaga, I., Risueno, R.M., van Santen, H.M., Cabezas, P., et al. (2005) Coexistence of multiva- lent and monovalent TCRs explains high sensitivity and wide range of response. The Journal of Experimental Medi- cine, 202, 493-503. doi:10.1084/jem.20042155
[13] Wilson, B.S., Pfeiffer, J.R., Surviladze, Z., Gaudet, E.A. and Oliver, J.M. (2001) High resolution mapping of mast cell membranes reveals primary and secondary domains of Fc(epsilon)RI and LAT. The Journal of Cell Biology,
154, 645-658. doi:10.1083/jcb.200104049
[14] Lillemeier, B.F., Mortelmaier, M.A., Forstner, M.B., Hup- pa, J.B., Groves, J.T., et al. (2010) TCR and Lat are ex-pressed on separate protein islands on T cell membranes and concatenate during activation. Nature Immunology,
11, 90-96. doi:10.1038/ni.1832
[15] Sanchez-Lockhart, M. and Miller, J. (2006) Engagement of CD28 outside of the immunological synapse results in up-regulation of IL-2 mRNA stability but not IL-2 tran-scription. The Journal of Immunology, 176, 4778-4784.
[16] Kobayashi, H., Azuma, R. and Yasunaga, T. (2009) Ex- pression of excess receptors and negative feedback con- trol of signal pathways are required for rapid activation and prompt cessation of signal transduction. Cell Com- munication and Signaling, 7, 3.
doi:10.1186/1478-811X-7-3
[17] Woolf, P.J. and Linderman, J.J. (2003) Self organization of membrane proteins via dimerization. Biophysical Chem- istry, 104, 217-227. doi:10.1016/S0301-4622(02)00369-1
[19] Kobayashi, H., Azuma, R. and Konagaya, A. (2007) Clus- tering of membrane proteins in the pre-stimulation stage is required for signal transduction: A computer analysis. Signal Transduction, 7, 329-339.
doi:10.1002/sita.200600126
[20] Costa, M.N., Radhakrishnan, K. and Edwards, J.S. (2011) Monte Carlo simulations of plasma membrane corral-in- duced EGFR clustering. Journal of Biotechnology, 151,
261-270. doi:10.1016/j.jbiotec.2010.12.009
[21] Srinivas, R.A., Tsourkas, P.K. and Raychaudhuri, S. (2011) Monte Carlo study of B-cell receptor clustering mediated by antigen crosslinking and directed transport. Cellular & Molecular Immunology, 8, 255-264.
doi:10.1038/cmi.2011.3
[22] Yu, X., Sharma, K.D., Takahashi, T., Iwamoto, R. and Me- kada, E. (2002) Ligand-independent dimer formation of epidermal growth factor receptor (EGFR) is a step sepa-rable from ligand-induced EGFR signaling. Molecular Biology of the Cell, 13, 2547-2557.
doi:10.1091/mbc.01-08-0411
[23] Hebert, T.E. and Bouvier, M. (1998) Structural and func-tional aspects of G protein-coupled receptor oligomeriza-tion. Biochemistry and Cell Biology, 76, 1-11.
doi:10.1139/o98-012
[24] Gomes, I., Jordan, B.A., Gupta, A., Rios, C., Trapaidze, N. and Devi, L.A. (2001) G protein coupled receptor dim- erization: Implications in modulating receptor function. Journal of Molecular Medicine, 79, 226-242.
doi:10.1007/s001090100219
[25] Kusumi, A., Koyama-Honda, L. and Suzuki, K. (2004) Molecular dynamics and interactions for creation of stim- ulation-induced stabilized rafts from small unstable rafts. Traffic, 5, 213-230. doi:10.1111/j.1600-0854.2004.0178.x
[26] Gimborn, K., Lessmann, E., Kuppig, S., Krystal, G. and Huber, M. (2005) SHIP down-regulates FcepsilonR1-in- duced degranulation at supraoptimal IgE or antigen levels. The Journal of Immunology, 174, 507-516.
[27] Lesourne, R., Fridman, W.H. and Daeron, M. (2005) Dy- namic interactions of Fc gamma receptor IIB with fila- min-bound SHIP1 amplify filamentous actin-dependent negative regulation of Fc epsilon receptor I signaling. The Journal of Immunology, 174, 1365-1373.
[28] Meakin, P. (1986) Multiple-contact diffusion-limited-ag- gregation model. Physical Review A, 33, 4199-4204.
doi:10.1103/PhysRevA.33.4199
[29] Matsumoto, M. and Nishimura, T. (1998) Mersenne twis- ter: A 623-dimensionally equidistributed uniform pseudo- random number generator. ACM Transactions on Model- ing and Computer Simulation, 8, 3-30.
doi:10.1145/272991.272995
[30] Andrews, AL., Holloway, J.W., Puddicombe, S.M., Hol- gate, S.T. and Davies, D.E. (2002) Kinetic analysis of the interleukin-13 receptor complex. The Journal of Biologi- cal Chemistry, 277, 46073-46078.
doi:10.1074/jbc.M209560200
[31] Felder, S., LaVin, J., Ullrich, A. and Schlessinger, J. (1992) Kinetics of binding, endocytosis, and recycling of EGF receptor mutants. The Journal of Cell Biology, 117, 203-
212. doi:10.1083/jcb.117.1.203
[32] Wilkinson, J.C., Stein, R.A., Guyer, C.A., Beechem, J.M. and Staros, J.V. (2001) Real-time kinetics of ligand/cell surface receptor interactions in living cells: Binding of epidermal growth factor to the epidermal growth factor receptor. Biochemistry, 40, 10230-10242.
doi:10.1083/jcb.117.1.203
[33] Teramura, Y., Ichinose, J., Takagi, H., Nishida, K., Yana- gida, T. and Sako, Y. (2006) Single-molecule analysis of epidermal growth factor binding on the surface of living cells. The EMBO Journal, 25, 4215-4222.
doi:10.1038/sj.emboj.7601308
[34] Kusumi, A., Shirai, Y.M., Koyama-Honda, I., Suzuki, K.G.N. and Fujiwara, T.K. (2010) Hierarchical organization of the plasma membrane: Investigations by single-molecule tracking vs. fluorescence correlation spectroscopy. FEBS Letters, 584, 1814-1823. doi:10.1038/sj.emboj.7601308 [35] Mullineaux, C.W., Nenninger, A., Ray, N. and Robinson,
C. (2006) Diffusion of green fluorescent protein in three cell environments in Escherichia coli. Journal of Bacteri-ology, 188, 3442-3448. doi:10.1038/sj.emboj.7601308
[36] Ishihara, A., Hou, Y. and Jacobson, K. (1987) The Thy-1 antigen exhibits rapid lateral diffusion in the plasma membrane of rodent lymphoid cells and fibroblasts. Pro- ceedings of the National Academy of Sciences of the United States of America, 84, 1290-1293.
doi:10.1073/pnas.84.5.1290
[37] Zhang, F., Crise, B., Su, B., Hou, Y., Rose, J.K., Bothwell, A. and Jacobson, K. (1991) Lateral diffusion of membrane- spanning and glycosylphosphatidylinositol-linked proteins: Toward establishing rules governing the lateral mobility of membrane proteins. The Journal of Cell Biology, 115, 75-84. doi:10.1083/jcb.115.1.75
[38] George, S.R., Fan, T., Xie, Z., Tse, R., Tam, V., Varghese, G. and O’Dowd, B.F. (2000) Oligomerization of mu- and delta-opioid receptors. Generation of novel functional pro- perties. The Journal of Biological Chemistry, 275, 26128- 26135. doi:10.1074/jbc.M000345200
[39] Nimchinsky, E.A., Hof, P.R., Janssen, W.G.M., Morrison, J.H. and Schmauss, C. (1997) Expression of dopamine D3 receptor dimers and tetramers in brain and in transfected cells. The Journal of Biological Chemistry, 272, 29229 29237. doi:10.1074/jbc.272.46.29229
[40] Park, P., Sum, C.S., Hampson, D.R., Van Tol, H.H.M. and Wells, J.W. (2001) Nature of the oligomers formed by muscarinic m2 acetylcholine receptors in Sf9 cells. The European Journal of Pharmacology, 421, 11-22.
doi:10.1016/S0014-2999(01)00998-0
[41] Maggio, R., Barbier, P., Colelli, A., Salvadori, F., Demon-tis, G. and Corsini, G.U. (1999) G protein-linked receptors: pharmacological evidence for the formation of hetero- dimers. The Journal of Pharmacology and Experimental Therapeutics, 291, 251-257.
[42] Kusumi, A., Sako, Y. and Yamamoto, M. (1993) Confined lateral diffusion of membrane receptors as studied by sin- gle particle tracking (nanovid microscopy). Effects of cal- cium-induced differentiation in cultured epithelial cells. Biophysical Journal, 65, 2021-2040.