Synthesis and Characterization of Polymeric Composites
Embeded with Silver Nanoparticles
Hemant K. Chitte1, Narendra V. Bhat2*, Narayan S. Karmakar3, Dushyant C. Kothari3, Ganesh N. Shinde4
1
Dnyanasadhana College, Thane, India 2
Bombay Textile Research Association, Mumbai, India 3
Centre for Nanosciences and Nanotechnology, University of Mumbai, Mumbai, India 4
Indira Gandhi College, New Nanded, India Email: *[email protected]
Received November 30, 2011; revised December 12, 2011; accepted January 2,2012
ABSTRACT
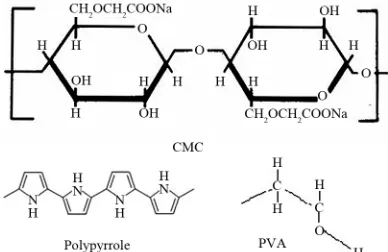
Silver nanoparticles were synthesized by chemical reduction method. The Ag nanoparticles (AgNP) were characterized using UV-Vis spectroscopy which shows an absorption band at 420 nm confirming the formation of nanoparticles. For any practical application of the silver nanoparticles it is necessary to stabilize it which can be done by making a com- posite. In the present studies three polymers were chosen such that AgNP could be put to some practical use. Polyvinyl Alcohol (PVA), Polypyrrole (Ppy) and Carboxymethyl cellulose (CMC) are important for use in textiles, electronics and food/drug technologies respectively. Polymeric composites of PVA, PPy, and CMC were prepared by mixing the aqueous solutions of the respective polymers and the colloidal suspension of pre-formed silver nanoparticles. Various compositions containing 1% to 5% of Ag nanoparticles were prepared. Thin films of these composites were character- ized by UV-Vis spectroscopy, X-ray diffraction and Scanning electron microscopy. X-ray diffraction showed the pres- ence of the peaks at 2θ values of 38.1˚, 44.2˚, 64.4˚ and 78.2˚ corresponding to cubic phase of silver metal. SEM photo- graphs revealed the presence of Ag nanoparticles of sizes varying from 40 to 80 nm. The electrical conductivity of these materials was studied using the four probe method. The conductivity was found to increase from 10–6 for control sam- ples to 10–3 S/cm after the formation of the nanocomposites.
Keywords: Silver Nanoparticles; Composites; Polypyrrole; PVA; CMC; Microscopy
1. Introduction
Nanotechnology has assumed a great importance in recent years on account of its possible applications in several areas such as electronics, pharmacy, computers, catalysis, biotechnology etc. [1]. Metallic nanoparticles of Ag, Au, Cu and Zn have been the focus of specific interest due to its unique properties such as antibacterial, optical bi-sta- bility, photoresponsivity etc. In spite of such importance the instability of nanoparticles gives rise to aggregation which deters its use for specific applications.
Various methods for stabilizing and capping of nanopar- ticles have been reported [2]. Coating of nanoparticle and its surface modification with functional polymers have been achieved to give resistance to oxidation and possi- bility of embedding such modified nanoparticles in dif- ferent composites. The interest in nano-coating is on ac- count of combination of the properties of two or more materials involved with the emphasis on the fact that one of the materials (shell) will determine the surface proper-
ties of the particle while the other i.e. the core is com- pletely encapsulated by the shell. Although the core will not contribute to surface property it will be responsible for optical, electrical and other properties of the compos- ites. It is also important to take into account the possible interaction between the core and shell, so that the unique combination can be understood. Another main benefit of coating nanoparticle is avoidance of spread of nanoparti- cle to the environment due to bonding between the sub- strate and coated nanoparticle. Thus the nanoparticle may be safer to move to different places and use for specific purposes.
adopted was to coat the pre-formed Ag nanoparticles with the polymers in suspension. The nanocomposites thus formed were characterized using UV-Vis spectros- copy (UV-Vis), X-ray diffraction (XRD) and Scanning electron Microscopy (SEM). The advantages of these nanocomposites over the control polymer and industrial applications will be reported in a separate communica- tion.
2. Experimental
2.1. Preparation of Silver Nanoparticles
AgNO3 was dissolved in double distilled water to give a
solution of 0.001 M solution. Trisodium citrate (0.02 M) was used as reducing agent. To 100 ml of silver nitrate solution was added to trisodium citrate solution drop by drop, over a period of 30 min and maintained at 80˚C. The stirring was continued for 1 hr. It was found that solution turns yellow. The yellow colour confirms the formation of silver nanoparticles [3]. A large quantity of such solution was made and served as the stock solution for other experiments.
2.2. Coating of Ag Nanoparticles by Polymers
The coating of silver nanoparticle by polypyrrole was performed by addition of 4 ml of pyrrole to 600 ml of silver nanoparticle solution. The solution was stirred con- tinuously during and after addition and it was observed that the conversion of pyrrole to polypyrrole takes place within 15 min. However the stirring was continued for another 1 hr so that the pyrrole fully polymerizes and coats the Ag nanoparticle evenly. The color of the solu- tion changes from yellow to steel grey to black. The ob- tained solution was left in the ambient condition for an- other 24 hr before the precipitated material was filtered out and washed.
Polymeric composites of Polyvinyl alcohol and Car- boxymethyl cellulose were prepared by mixing the aque- ous solutions of the respective polymers and the colloidal suspension of pre-formed silver nanoparticles. The solu- tions of PVA and CMC were made in water using 4% of powders (w/w) and stirring for one hour at 80˚C. To these solutions were added the solution of AgNP to get various compositions containing 1% to 5% of Ag. Thin films of these solutions were casted on glass plates for further analysis.
The results described in this paper are for composi- tions all containing 1% w/w of Ag nanoparticles.
2.3. Methods of Characterization
All the preparations i.e. pure silver nanoparticles and the composites were characterized by UV-Vis, XRD, SEM and TEM. For this purpose UV-Vis Spectrometer of Var-
ian make Cary 5000 which could scan from 175 nm to 3300 nm was used. Diluted solution of nanoparticles was filled into the quartz cuvette to obtain the spectrum. PAN analytical Xpert pro X-ray diffractometer with Cu tube was used for recording the XRD pattern. The specimen in the form of thin coating on glass plate or PET film was prepared and used for scanning in the range of 10˚ to 80˚. Scanning electron micrographs were obtained using JEOL SEM model JSM 5400. The samples were mounted on the stub and coated with a thin film of gold before observa- tions. Transmission electron micrographs were obtained by using Philips TEM CM200 operating at voltage of 200 kV. Structures of different polymers usedfor coating of silver nanoparticles are shown in Figure 1.
3. Results and Discussions
3.1. Composite of Silver Nanoparticles with Polypyrrole
3.1.1. UV-Vis Spectroscopy
The dispersions of silver nanoparticles display intense colors due to the plasmon resonance absorption. The surface of a metal is like plasma, having free electrons in the conduction band and positively charged nuclei. Sur- face plasmon resonance is a collective excitation of the electrons in the conduction band near the surface of the nanoparticles. Electrons are limited to specific vibrations modes by the particle’s size and shape. Therefore, metal- lic nanoparticles have characteristic optical absorption spectra in the UV-Vis region [3].
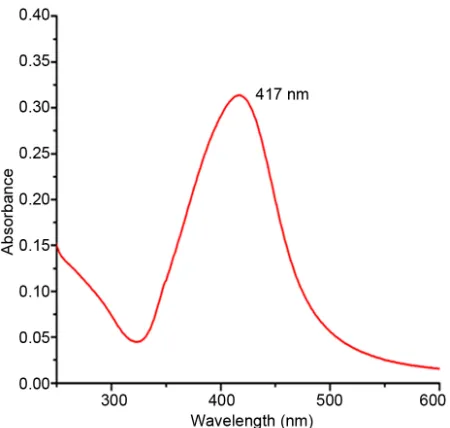
The UV-Vis absorption spectrum of pure silver nanopar- ticle is shown in Figure2. One can clearly see strong ab- sorption at 417 nm, confirming the formation of silver nanoparticles. The peak at 417 nm is attributed to the surface plasmon resonance.
[image:2.595.325.519.578.704.2]UV-Vis Spectra for the solution in which pyrrole is added is shown in Figure3. Curve A of Figure3 is UV- Vis spectrum of silver nanoparticle solution. It shows the strong absorption peak at 417 nm. Curve B of Figure3 corresponds to Ag nanoparticle solution in which pyrrole
Figure 2. UV-Vis absorption spectra of colloid solution of Ag nanoparticles.
Figure 3. A: UV-Vis absorption spectra of colloid solution of Ag nanoparticles; B: Ag/PPy nanoparticle.
was added and allowed to polymerize for sufficient dura- tion. It can be noted that the peak at 417 nm observed earlier for pure Ag nanoparticles has now disappeared. The color of the solution changes from yellow to steel grey to black. This is due to fact that the PPy coats around Ag nanoparticles and as the color of polypyrrole is black, the entire solution and the precipitated compos- ite gets black color. In addition the strong scattering from the PPy shell possibly screened the surface and as a re- sult the plasmon resonance does not occur.
3.1.2. X-Ray Diffraction Analysis
X-ray diffraction pattern for pure silver nanoparticle re- ported in literature shows four distinct diffraction peaks at 38.7˚, 44.1˚, 64.6˚ and 78.3˚ [JCPDS No 03-0931].
These correspond to cubic, crystalline structure of silver and are assigned to (111), (200), (220) and (311) planes of silver respectively. Figure 4 shows X-ray diffraction pattern of PPy coated Ag nanoparticle. This shows all the four characteristic peaks due to silver crystalline struc-ture and in addition a broad peak in the region 20˚ to 24˚ due to the amorphous structure of polypyrrole [4].
The four peaks observed for Ag/PPy are at 2θ angles of 37.8˚, 44.0˚, 64.2˚ and 77.1˚. These values are slightly lower than those reported in JCPDS. The particle size of the silver nanoparticle was calculated from the line broaden- ing using the Scherrer’s formula D = kλ/βcosθ. The sizes were calculated from all the four peaks and were found to be 27 nm, 23 nm, 23 nm and 20 nm respectively. The XRD pattern did not change even after 60 days after pre- paration. This indicated that the PPy coating prevented the Ag nanoparticles from being oxidized even in air, compared with the uncoated Ag nanoparticles, which is evidence of the protection that the PPy exerts against oxidation of the Ag core. Thus, quite stable Ag nanopar-ticles could be fabricated with PPy coating.
3.1.3. Transmission Electron Microscopy
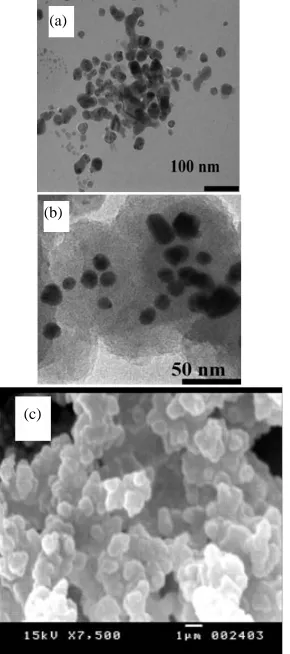
Figure5(a) shows TEM image of pure silver nanoparti- cle and one can see minimum size of Ag nanoparticle as about 20 nm. Large particles of different sizes in the range from 20 nm to 50 nm were also seen, which are probably due to aggregation or clustering of the nanopar- ticle. Figure5(b) shows the TEM image of polypyrrole coated silver nanoparticle. One can note beautiful core/ shell structure. The Ag nanoparticles seem to be embed- ded in the PPy matrix. This feature is very much different from pure polypyrrole, whose morphology is mainly spherulitic or globular with the average size of 0.8 mi- crons, as seen in Figure 5(c).
[image:3.595.314.527.525.713.2](a)
(b)
[image:4.595.103.248.86.413.2](c)
Figure 5. Micrographs (a) Pure Ag nanoparticles, (b) Ag nanoparticles coated with PPy and (c) SEM of pure Ppy.
3.2. Composites of Silver Nanoparticles with PVA
3.2.1. UV-Vis Spectroscopy of Ag NP/ PVA
The nanocomposite films of various compositions were checked for their absorption patterns. The composite films exhibit a broad surface Plasmon absorption band peaking at approximately 420 nm (Figure 6). This result is in agreement with the optical absorption spectra of Ag nanoparticles embedded in different polymer matrices like polyacrylonitrile, nylon etc. The shift to the longer wavelength and broadening of the band upon incorpora- tion of Ag nanoparticles into PVA can be induced by agglomeration of the Ag nanoparticles or change of the dielectric properties of the surrounding environment.
3.2.2. X-Ray Diffraction
X-ray diffraction pattern of the nanocomposite films showed many peaks at different 2θ values as shown in Figure7. The peaks around 20˚ have resulted from the crystalline parts of PVA molecules. (In fact it is a group of three peaks corresponding 19˚, 21˚, 23˚, not seen re-solved here due to reduced size of the figure). This agrees well with the previous reported work for the PVA [5]. In
addition very intense peaks were observed at 38˚, 44˚, 64˚ and 78˚ which are due to cubic form of silver and also agrees well with the literature [JCPDS No 030931]. Thus we can see that a homogeneous nanocomposite film of PVA with Ag NP has been formed.
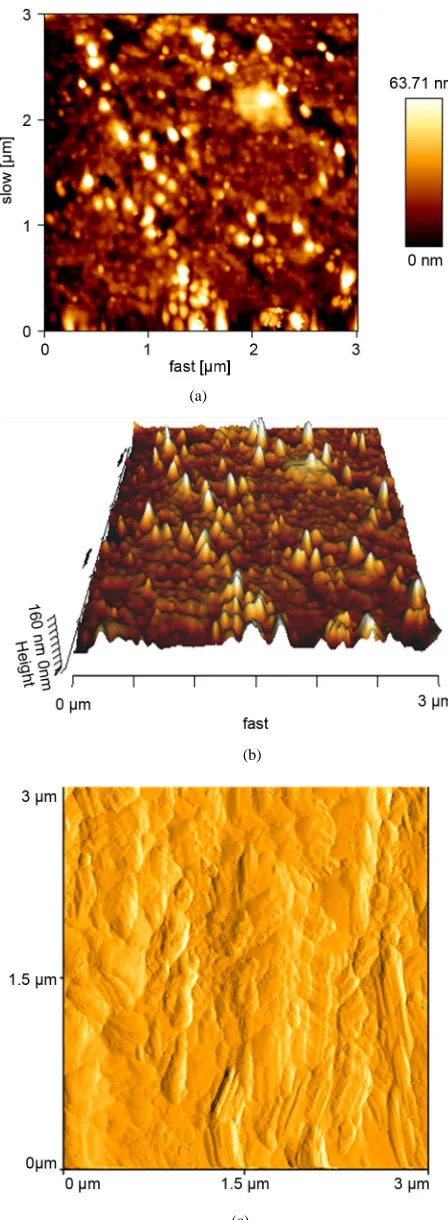
The nanocomposite of PVA/Ag was observed using AFM. Figures8(a) and (b) show the surface morphology of the films in 2 and 3 dimensions. One can see easily the silver nanoparticles of size 40 nm protruding out of the surface. This structure is certainly much different from that for pure PVA, which shows mainly a planar surface as seen in Figure 8(c).
3.3. Composites of Silver Nanoparticles with CMC
[image:4.595.314.533.298.484.2]The nanocomposites of CMC + Ag were also investigated
Figure 6. UV/Vis spectra of PVA/Ag nanocomposites of different concentrations (a) Control PVA; (b) 0.2% Ag con-tent; (c) 0.5% Ag content (d) 1.0% Ag content.
[image:4.595.308.538.531.717.2](a)
(b)
[image:5.595.58.282.82.692.2](c)
Figure 8. Morphological f of composite of AgNP+ PVA seen using AFM: (a) Planar surface; (b) 3-D view of surface and (c) of pure PVA film.
eatures
2θ
In
te
ns
it
y
Figure 9. X-ray diffraction pattern of CMC + Ag nanopar-ticles.
(a)
[image:5.595.313.533.82.250.2](b)
Figure 10. SEM micrographs of (a) Pure CMC and (b) CMC + Ag nanoparticles con sions.
e X-ray diffract- clu
using the UV/Vis spectroscopy and one could easily ob- serve the absorption band at 420 nm. Th
tion also revealed that a good composite has been formed as seen by the presence of peaks due to silver (Figure 9).
[image:5.595.319.528.286.634.2]tic
and Carboxy- m
permission. Thanks are al r. V. E. Walunj for the help
[1] A. Franks, “Review Article: Nanotechnology,” Journal of
information about the granular structure of pure CMC changing to square type of formations with silver nanopar-
les embedded in the center (Figure10).
Polymeric Nanocomposites containing Ag NP could be prepared with three industrially important polymers , namely, Polyvinyl alcohol, polypyrrole
ethyl cellulose. The Ag NP gets coated with the poly- mers which improves its stability and functionality. Sig- nificant changes were noted in the surface morphology and homogeneous distribution of Ag NP was observed.
4. Acknowledgements
The authors wish to express thanks to Director, BTRA so for his interest and necessary
due to Mr. A. V. Gore and M during experimental work.
REFERENCES
Physics E: Scientific Instruments, Vol. 20, No. 12, 1987, pp. 1442-1451. doi:10.1088/0022-3735/20/12/001
[2] E. Filipo, A. Serra and D. Manno, “Poly(Vinyl Alcohol) Capped Silver Nanoparticles as Localized Surface Plas-mon Resonance-Based Hydrogen Peroxide Sensor,”Sen-
sors and Actuators B: Chemical, Vol. 138, No. 2, 2009, pp. 625-630. doi:10.1016/j.snb.2009.02.056
[3] S. Kulkarni, “Nanotechnology—Principles and Processes,” Capital Publishing House, New Delhi, 2009, pp. 263-265.
[4] P. Song, Q. Wang and Z. X. Yang, “Ammonia Gas Sen-sor Based on PPy/ZnSnO3 Nanocomposites,” Materials
Letters, Vol. 65, No. 3, 2011, pp. 430-432.
doi:10.1016/j.matlet.2010.10.087
[5] N. V. Bhat, M. B. Kurup, V. A. Bambole, M. M. Nate and S. Sabharwal, “Effect of Gamma Irradiation on Struc-ture and Properties of PVA Films,” Nuclear Instruments