Engineering, 2011, 3, 992-1001
doi:10.4236/eng.2011.310123 Published Online October 2011 (http://www.SciRP.org/journal/eng)
Experimental Study for the Determination of the Material
Diameter of the Riprap Bed Protection
Joongu Kang, Sanghwa Jung*, Dongsub Rhee, Hongkoo Yeo
Department of Water Resources Research, Korea Institute of Construction Technology, Ilsan, Korea E-mail:*[email protected], jgkang02@kict.re.kr, [email protected], yeo917@kict.re.kr
Received August 4, 2011; revised August 22, 2011; accepted September 1, 2011
Abstract
Bed protection in apron downstream was installed to use riprap or gabion mattress. In the case of bed pro-tect- tion using riprap, the decision on the riprap diameter is very important because riprap diameter means the capacity to withstand the flow. Initial formulas for the decision on the riprap diameter applied velocity and weight as main factors. Since the main factors gradually expanded to depth, bed slope, and turbulence intensity, decision formulas for the riprap diameter were detailed. Because turbulence intensity was consid- ered to be a main factor of the formula, the decision formulas for the riprap diameter could be expanded to apply to bed protection around hydraulic structures. Escarameia and May conducted a study on the riprap diameter of a strong turbulence area around the downstream of hydraulic structures. For the formula of Es- carameia and May, the basis of the formula was the Izbash type, and the main factor was turbulence intensity. This study was an experimental study for deciding the riprap diameter installed around apron downstream and was based on the study results of Escarameia and May. The experiment measured the velocity upon change of discharge and riprap diameter to the installed weir model and analyzed the correlation of threshold velocity by diameter. The experimental formula in this study expanded the turbulence intensity limits of the Escarameia and May formula and increased application to turbulence intensity in weir downstream.
Keywords:Apron, Bed protection, Riprap, Turbulence Intensity
1. Introduction
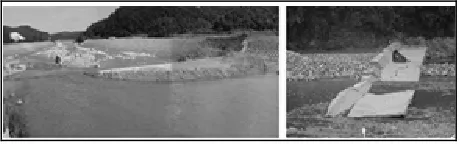
As one of the river structures installed most commonly in rivers, the round-crested weir is a facility without the function of embankment since it is installed in the cross- sectional direction to raise the water level for water in- take and canal way and to prevent the countercurrent of rivers (River Design Criteria, [1]). Generally, a weir consists of the body, apron, and bed protection, and the design criteria are presented in the River Design Criteria [1]. Note, however, that bed scour around apron down- stream and bed protection was confirmed to be one of the main causes according to the examination of cases of flood damage wreaked by typhoon Rusa and typhoon Maemi. Therefore, applying weirs in rivers was found to have problems. Although water conveyance takes place, strong turbulence intensity from the starting point of wa- ter conveyance can be a cause of such bed scour. Bijan [2] conducted a study evaluating scour depth through research on bed scour development around apron down- stream. Figure 1 shows weir destruction due to bed
scour around apron downstream.
The bed protection installed around apron downstream is a structure installed to prevent scour generated in the downstream of the hydraulic structure and to protect the body and apron. The design criteria of bed protection have not considered various hydraulic phenomena in- cluding water level impact in weir downstream. Conse- quently, re-review and supplementation of bed protection are required to ensure weir stability.
[image:1.595.308.538.625.698.2]As the importance of environmental functions and hy- draulic improvement of rivers increases, the environ- ment-friendliness of bed protection is emphasized more.
In this context, there is a need to minimize the existing apron’s length as well as for environment-friendly bed protection to enhance the eco-function. For this reason, the use of riprap protection with its secured stability in- creases compared to the existing concrete protection.
In Korea, the bed protection installed in rivers is con- structed generally using ripraps or gabion mattresses. The materials for bed protection are used considering the material diameter or weight according to velocity. Stud- ies to determine proper bed protection materials have been sequentially carried out concerning riprap, gabion mat- tress, and concrete block protection since the mid-1970s. Initial stage studies were mainly conducted concerning riprap. Recently, the formulas developed for riprap have been studied by extending the experimental scope re- garding gabion mattress and concrete block protection. Thus, they are improving as relationship formulas to be used universally (Pilarczyk [3]; Escarameia [4]).
This study carried out literature research to review the domestic and international guidelines for design criteria related to weir apron and bed protection and to identify the overall design trends. Although the results of many studies on scour depth around downstream—which is calculated for bed protection length design—have been accumulated and are at a predictable level, test or verify- cation is required for on-site application. In most guide- lines, there are no official design procedures in relation to the lengths of apron and bed protection, and design criteria are prepared through hydraulic experiments if necessary. For example, Blodgett and McConaughy [5] examined the merits and demerits of various cross-sec- tional structures and proposed improved structures suit- able for Denver City. In the case of the Agricultural Re- search Service Guidelines, the guidelines were based on the hydraulic experimental results of Little and Murphy [6]. In Korea and Japan, design criteria for the lengths of apron and bed protection were presented. In Korea in particular, the design criteria for apron and bed protect- tion at drop and weir are the same. In Japan, design crite- ria for vertical drop are presented, but not clear criteria for weirs; thus, looking at past installation cases is rec- ommended in the case of operated weirs. Internationally, revised guidelines have recently been presented based on on-site evaluation, and studies to decrease energy appro- priately in various river water level conditions are con- ducted.
This study was a hydraulic experiment to review the riprap decision formula for bed protection to protect scour around apron downstream of a weir. For the hy- draulic experiment, an experiment in stationary phase and one in non-stationary phase were performed. The experiment in stationary phase sought to analyze the im- pact factors of scour by measuring the velocity and tur-
bulence intensity of apron downstream according to the discharge conditions. The experiment in non-stationary phase dealt with riprap materials to review the riprap decision formula. Through these experiments, this study proposed a riprap decision formula according to the flow impacts and turbulence intensity (TI) of the river bed around apron downstream.
2. Experimental Setup
A hydraulic experiment was conducted in an open flume with length of 50 m, width of 1.2 m, and height of 1.5 m. The downstream water level was controlled by adjusting the height between the watercourse bed and top of the tailgate using an electronic level. Water level was meas- ured using ultrasonic sensors, with 14 sensors installed in the flow direction; the sensors were located at the central point of the watercourse. To minimize influence by mu- tual intervention, the distance between sensors was more than 30 cm. Concerning the ultrasonic sensor, PIL’s sen- sor (model: P47-F4V-2D-1D0-180E) was used; meas- urement distances were 200 mm - 2000 mm, and beam angle was 8˚. Velocity was measured before and after water conveyance using the 1-dimensional propeller hy- drometer and Micro 16 MHz ADV (SONTEK). By iden- tifying the velocity distribution features within the length of water conveyance, energy dissipation was reviewed.
In this way, this study identified the velocity distribu- tion change around weir downstream by measuring ve- locity in the vertical direction at points with certain dis- tance in the flow direction, and bed velocity and turbu- lence velocity intensity were measured. Regarding ex- perimental conditions in stationary phase, experiments were carried out in 10 discharge conditions. For the me- ter to measure the velocity field, the 2-dimensional elec- tromagnetic velocity meter ACM-250D by Alec Co., and Sontek’s 3 dimensional ADV were used. The measured speed was 50 Hz in all depths, with each water level measured using an ultrasonic water level meter (P47- F4V-2D-1D0-180E, PIL Co.). For the bed protection experiment, the movement of materials could be ob- served with the naked eye by installing tempered glass for both side walls.
J.-G. KANG ET AL. 994
at apron, measurement began at the time experimental materials moved by controlling the depth in the experi- mental section using the water level control gate down- stream.
The decision of threshold was carried out through ob- servation with the naked eye. When more than 10 indi- vidual ripraps beginning to move around the velocity measuring points were confirmed, it was decided as threshold. Using Sontek’s 3-dimensional micro ADV, velocity was measured. Actually, by measuring 50 data per sec for at least 100 seconds at each measuring point, analysis was performed using a total of 5000 data entries. By measuring (with distance of 45 cm) at three points in the cross-sectional direction by setting the side line 1.5 m away from the top of the experimental section, the spatial average in the cross-sectional direction was derived. Vertical direction velocity at 7 - 8 points was measured by experimental condition.
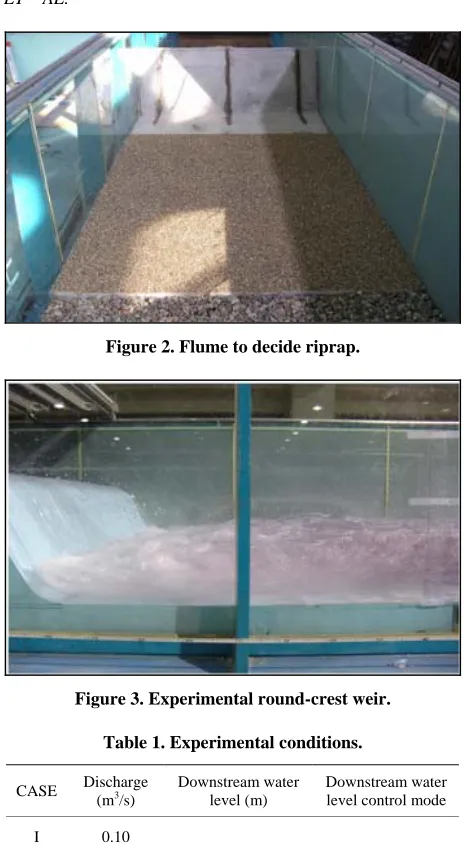
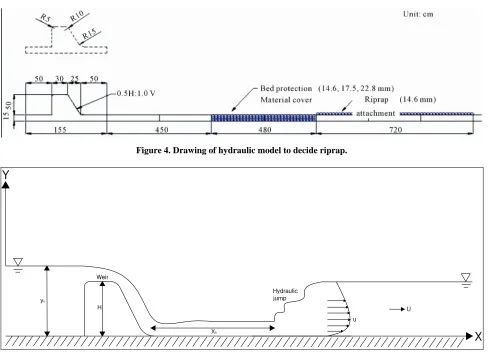
[image:3.595.307.539.63.490.2]The formula suggested by Escarameia and May [4] was obtained from an experiment using angled stones and rounded stones as materials for bed protection. In Korea, however, ripraps were mainly used as material for bed protection. Therefore, rounded stones were not con- sidered an experimental object. When experimenting by expanding the experimental conditions on riprap, im- proving as a formula more suitable for the Korean struc- ture conditions was expected to be possible. In the ex- periment, three types of ripraps were used by dividing them by diameter using crushed stone as standard object. Table 1 presents the experimental conditions. Figures 2 and 3 show the experimental watercourse and model installation, respectively, and Figures 4 and 5 present the outline diagram of the experimental model.
3. Analysis (Flow Characteristics around
Weir Downstream)
[image:3.595.309.539.78.223.2]The experiment in stationary phase sought to analyze the flow characteristics around weir downstream; water con- veyance, velocity, and turbulence intensity were meas- ured according to the weir upstream and downstream conditions. The experiment in stationary phase was con- ducted to review the factors for deciding riprap. The flow around weir downstream was divided into hydraulic jump section, water conveyance section, and upstream section. The flow around weir downstream showed a difference in the hydraulic jump section, water conveyance section, and upstream section according to the upstream inflow volume and downstream water level. As an important factor in weir design since it is a cause of bed scour aris- ing from strong stream power, the hydraulic jump section was designed to be formed at the apron installation sec- tion. Accordingly, the hydraulic jump section should be minimized to make downstream bed safe when designing
[image:3.595.309.538.248.402.2]Figure 2. Flume to decide riprap.
Figure 3. Experimental round-crest weir.
Table 1. Experimental conditions.
CASE Discharge (m3/s)
Downstream water level (m)
Downstream water level control mode
I 0.10
II 0.20
III 0.25
IV 0.30
0.10, 0.15, 0.20, 0.25, 0.30, 0.35, 0.40, 0.45, 0.50,
0.55
Tailgate
a weir. Note, however, that the river’s discharge and wa- ter level conditions vary, and it is difficult to apply hy- draulic conditions to minimize the hydraulic jump sec- tion for all rivers in designing a weir. Consequently, methods of maintaining the bed around weir downstream were proposed domestically and internationally.
[image:3.595.312.537.446.552.2]Figure 4. Drawing of hydraulic model to decide riprap.
Xh yu
H
u
U
X
Y
Weir
Hydraulic jump
Figure 5. Schematic drawing.
decided by the Bligh formula, but this formula was drawn considering the penetration impact of the ground. Thus, it has the limit of not considering the hydraulic characteristics. In other words, the proposed Bligh for- mula in the past cannot classify flow sections (hydraulic jump, water conveyance, and upstream sections) regard- ing discharge and downstream water level conditions.
This experiment reviewed the hydraulic jump section, water conveyance section, and upstream section accord- ing to the weir upstream/downstream conditions. Figure 6 shows the measured water level change results at weir downstream according to the water level at downstream end. Water conveyance is made to be closer to the weir as downstream water level increases. Figure 7 shows the water conveyance locations according to the upstream and downstream conditions. The part where a rapid change of water level is induced indicates the point where water conveyance is triggered. This study as- sumed conditions wherein hydraulic jump was formed in the apron installation section and reviewed flow after water conveyance was induced in terms of bed impacts.
Figures 8 and 9 show the maximum velocity values
under the condition wherein water conveyance is induced at the end of the weir. The X axis in Figure 8 is the dis- tance made non-dimensional with the water conveyance distance
X x Lr
, with the Y axis making the maxi-mum velocity non-dimensional with downstream veloc- ity
Umum V2
. Looking at the figure, within 3 - 5scope of non-dimensionalized distance
X , maximum velocity fell within 1.18-fold average velocity at the downstream end. In general, average velocity in a river is known to be 0.85 times the cross-section’s maximum velocity. Consequently, when a cross section’s maximum velocity falls lower than the 1.18-fold average velocity, it can be decided to be similar to river flow. Thus, if bed protection scope is defined to be the point where flowing water impact disappears, the length can be measured to be about 3 - 5 times that of water conveyance as a result of the experiment.Figure 9 shows the change scope of turbulence veloc- ity intensity
2
2
TI u V that was non-dimension-
J.-G. KANG ET AL.
[image:5.595.122.479.77.292.2]996
Figure 6. Water surface phenomena according to the downstream water level condition (0.25 m3/s).
Figure 7. Comparison of water conveyance distances according to the downstream water level.
intensity, flow impacts by water conveyance after 3 of non-dimensionalized distance nearly disappear. Conse- quently, when apron length reaches the point where flow instability eases considerably due to energy dissipation after water conveyance, the length can be estimated to be more than 3-fold based on the experiment results. Therefore, the lengths of apron and bed protection can be calculated through dimensional interpretation based on the experimental results.
4. Experimental Results of Bed Protection
The most widely used formulas among the existing for-
[image:5.595.116.481.322.537.2]
(a) (b)
[image:6.595.81.517.79.371.2]
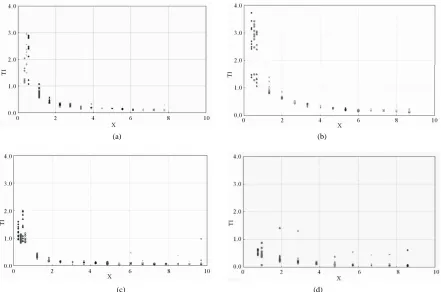
(c) (d)
Figure 8. Change of Um according to X (red: location of apron end).(a) 0.30 m3/s, (b) 0.25 m3/s, (c) 0.20 m3/s, (d) 0.10 m3/s.
(a) (b)
(c) (d)
Figure 9. Change of TI according to X (red: location of apron end).(a) 0.30 m3/s, (b) 0.25 m3/s, (c) 0.20 m3/s, (d) 0.10 m3/s.
[image:6.595.78.519.404.696.2]J.-G. KANG ET AL. 998
for review and improvement in this study since it was decided to be the most suitable formula for the purpose of this study.
Below is the HR Wallingford formula.
2
50
2 1
b n
s
u
d c
g s
(1)
Here, n50 is the equivalent average diameter of rip- rap and is generally expressed as 50 50. is the turbulence intensity coefficient, ub is the bed
velocity (velocity at the point d
0.909
n
d d C
0.1y
away 10% from the bed depth), g is the gravity acceleration, and ss isthe riprap’s specific gravity. The turbulence intensity coefficient is calculated as follows from Formula (1):
C
50 2
1 2
n s
b
d s
C
u
Although the HR Wallingford formula can be cur- rently found in the British Design Criteria, the following problems have been confirmed as a result of review:
[image:7.595.104.489.247.691.2] [image:7.595.111.485.271.491.2] [image:7.595.112.484.511.704.2]1) By simultaneously applying the experimental re- sults on the angled riprap and rounded riprap, the turbu- lence intensity coefficient was calculated as shown in Figure 10. As a result of separately showing only the experimental results of angled riprap, the turbulence in- tensity coefficient was judged to be calculated exces- sively (Figure 11). Although Escarameia and May [4] mentioned that the material’s shape did not influence stability considerably, the material shape factor was con- sidered to have a huge effect on the coefficient calcula- tion as a result of the analysis. In Korea, when bed pro- tection is installed, angled riprap is known to have greater stability than rounded riprap; thus, the latter is not used. This study carried out experiments using only angled riprap.
g
(2)
C = 12.30 TI - 0.20
0.0 0.5 1.0 1.5 2.0 2.5 3.0 3.5 4.0
0.00 0.05 0.10 0.15 0.20 0.25 0.30 0.35
TI
C
Figure 10. HR Wallingford Experimental results.
C = 4.44 TI + 0.20
0.0 0.2 0.4 0.6 0.8 1.0 1.2 1.4 1.6
0.05 0.10 0.15 0.20 0.25
TI
C
Figure 11. Experimental results separation on angled riprap of HR Wallingford’s experimental results.
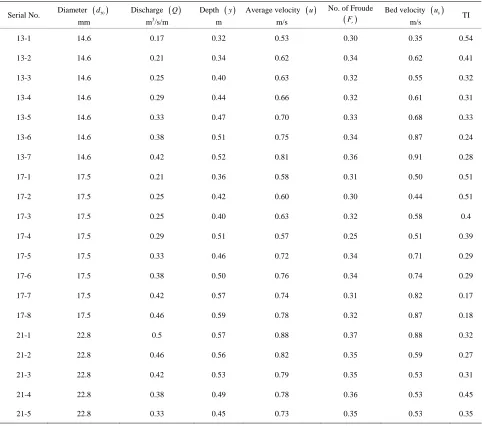
2) To enhance the formula’s applicability with riprap diameter of less than 11.8 mm, an experiment increasing the diameter scope was deemed necessary. This study conducted experiments under 11 conditions on ripraps with diameter of 6.0, 7.1, and 8.7 mm in the initial ex- periments (Korea Institute of Construction Technology [7]). As shown in Table 2, experiments under 20 condi- tions on 14.6, 17.5, 22.8 mm ripraps were conducted to expand the formula application scope.
3) To apply to strong turbulence flow less than 0.3 of TI scope of turbulence intensity as measured in the ex- periments, applicability was set to low regarding the flow with high TI condition. Therefore, this study expanded the discharge conditions and considered TI conditions with broader scope and carried out experiments.
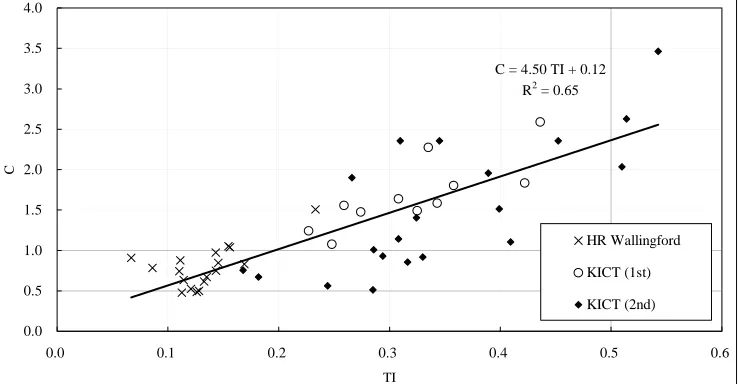
Figure 12 shows the experimental results of this study
along with HR Wallingford’s experimental results. As seen in the figure, based on the experimental results of expansion of angled riprap diameters, since the stability of riprap increased, impacts by turbulence intensity TI diminished remarkably compared to rounded riprap. Tur- bulence coefficient can be calculated as follows from the turbulence intensity TI based on the results above:
C
4.50 0.12
C TI (3)
[image:8.595.57.539.297.723.2]Since the experimental scope on turbulence intensity TI could be expanded, a conceptual approach concerning turbulence impact was attempted as in existing formulas. Generally, the impacts of turbulence were divided into normal turbulence and high turbulence, and the turbu- lence (intensity) coefficient was presented. Thus, this
Table 2. Experimental results.
Serial No. Diameter d50
mm
Discharge Q
m3/s/m
Depth y
m
Average velocity u
m/s
No. of Froude
Fr
Bed velocity ub
m/s TI
13-1 14.6 0.17 0.32 0.53 0.30 0.35 0.54
13-2 14.6 0.21 0.34 0.62 0.34 0.62 0.41
13-3 14.6 0.25 0.40 0.63 0.32 0.55 0.32
13-4 14.6 0.29 0.44 0.66 0.32 0.61 0.31
13-5 14.6 0.33 0.47 0.70 0.33 0.68 0.33
13-6 14.6 0.38 0.51 0.75 0.34 0.87 0.24
13-7 14.6 0.42 0.52 0.81 0.36 0.91 0.28
17-1 17.5 0.21 0.36 0.58 0.31 0.50 0.51
17-2 17.5 0.25 0.42 0.60 0.30 0.44 0.51
17-3 17.5 0.25 0.40 0.63 0.32 0.58 0.4
17-4 17.5 0.29 0.51 0.57 0.25 0.51 0.39
17-5 17.5 0.33 0.46 0.72 0.34 0.71 0.29
17-6 17.5 0.38 0.50 0.76 0.34 0.74 0.29
17-7 17.5 0.42 0.57 0.74 0.31 0.82 0.17
17-8 17.5 0.46 0.59 0.78 0.32 0.87 0.18
21-1 22.8 0.5 0.57 0.88 0.37 0.88 0.32
21-2 22.8 0.46 0.56 0.82 0.35 0.59 0.27
21-3 22.8 0.42 0.53 0.79 0.35 0.53 0.31
21-4 22.8 0.38 0.49 0.78 0.36 0.53 0.45
21-5 22.8 0.33 0.45 0.73 0.35 0.53 0.35
J.-G. KANG ET AL. 1000
study tried to follow such study trend. CIRIA [8] pre- sented high turbulence in river TI = 0.35 as decision cri- terion, and CUR/RWS [9] presented TI = 0.30. In this context, this study selected 0.3 as the criterion to divide into normal turbulence and high turbulence considering the experimental data. As shown in Figure 13, different trends of turbulence (intensity) coefficient can be seen in two sections. Consequently, dividing based on 0.3 is considered appropriate. When dividing into normal tur- bulence and high turbulence, turbulence intensity coeffi- cient C from turbulence intensity TI can be calculated as follows:
2.78 1 0.40
C T for normal turbulence (4)
5.68 1 0.32
[image:9.595.114.483.295.487.2]C T for high turbulence (5)
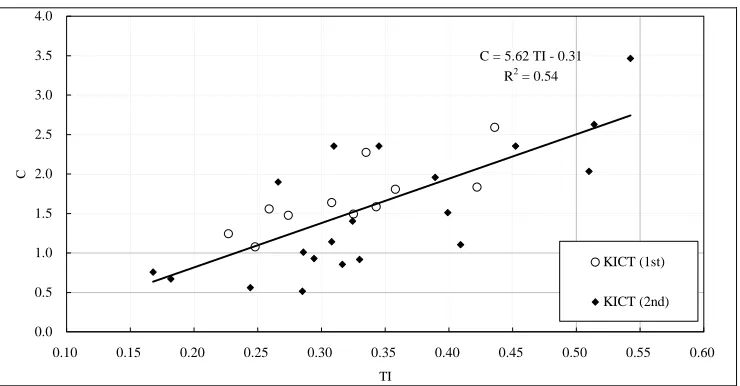
Figure 14 illustrates only the experimental results in this study task. When not considering the experimental
results of HR Wallingford, the TI impacts of turbulence intensity increased slightly.
5. Conclusions
To design apron length, bed protection length, and mate- rials in a weir, understanding of water conveyance char- acteristics is essential. This study reviewed water con- veyance induced in weir downstream through various discharges and water level conditions at downstream end. Based on the experimental results of Escarameia and May [5], this study carried out an experiment on riprap material diameter decision for bed protection by supple- menting the experimental conditions. As a result of the experiment, the following conclusions were drawn:
1) When apron length is considered to reach the point where flow instability eases considerably due to energy
C = 4.50 TI + 0.12 R2 = 0.65
0.0 0.5 1.0 1.5 2.0 2.5 3.0 3.5 4.0
0.0 0.1 0.2 0.3 0.4 0.5
TI
C
0.6 HR Wallingford
KICT (1st)
[image:9.595.112.483.513.704.2]KICT (2nd)
Figure 12. Experimental analysis results.
C = 2.78 TI + 0.40
C = 5.68 TI - 0.32
0.0 0.5 1.0 1.5 2.0 2.5 3.0 3.5 4.0
0.0 0.1 0.2 0.3 0.4 0.5 0.6
TI
C
HR Wallingford
KICT (1st)
KICT (2nd)
C = 5.62 TI - 0.31 R2 = 0.54
0.0 0.5 1.0 1.5 2.0 2.5 3.0 3.5 4.0
0.10 0.15 0.20 0.25 0.30 0.35 0.40 0.45 0.50 0.55 0.60
TI
C
KICT (1st)
[image:10.595.114.484.75.268.2]KICT (2nd)
Figure 14. Experimental results in this study.
dissipation after triggering water conveyance, the apron length can be estimated to be about 2.5 - 3 times the wa- ter conveyance length based on the experimental results.
2) When the scope of bed protection is defined to be up to the point where flowing water impact disappears, the length can be estimated to be about 3 - 5 times that of water conveyance as a result of the experiment.
3) The formula proposed by Escarameia and May [5] was based on the experimental results on ripraps and rounded stones; hence the slight difference from the re- sults of the experiment in this study. Note, however, that the trend is relatively similar when the experimental re- sults of ripraps were compared.
4) It was possible to improve the experimental results of Escarameia and May [5] to the formula with broader application scope.
5) The addition of the experimental results on ripraps with three different diameter sizes could improve the applicability of the existing formula. Consequently, when an experiment is carried out targeting a broader scope (bigger diameter) of material, such is expected to im- prove the existing formula’s applicability.
6. References
[1] Korea Water Resources Association, “River Design Cri-
teria,” 2004.
[2] D. Bijan, “Scour Development Downstream of a Spill- way,” Journal of Hydraulic Research, Vol. 41, No. 4, 2003, pp. 417-426. doi:10.1080/00221680309499986 [3] W. C. Little and J. B. Murphy, “Model Study of Low
Drop Grade control Structures,” Journal of Hydraulic Di- vision, Vol. 108, No. 10, 1982, pp. 1132-1146.
[4] M. Escarameia and R. W. P. May, “Channel Protection; Turbulence Downstream of Structures,” HR Report SR
313, 1992.
[5] J. C. Blodgett and C. E. McConaughy, “Rock Riprap Design for Protection of Stream Channels Near Highway Structures. Vol. 2, Evaluation of Riprap Design Proce- dures,” Water Resources Investigations Report, U.S. Geological Survey, Sacramento, 1986.
[6] W. C. Little and J. B. Murphy, “Model Study of Low Drop Grade control Structures,” Journal of Hydraulic Di- vision, Vol. 108, No. 10, 1982, pp. 1132-1146.
[7] Korea Institute of Construction Technology, “The Multi-Function River Design Criteria,” 2004.
[8] CIRIA, “Manual on Scour at Bridges and Other Hydrau- lic Structures,” 2002.