3152
©IJRASET: All Rights are Reserved
Proposal for Development of Nashik City as Green
City
Madhuri Nikam
1, Abhishek Singh
21, 2Dept. of Civil Engineering, Town and Country Planning section, Sandip University, Mahiravani, Nashik, Maharashtra, India
Abstract: The Indian cities have faced various challenges over the time, and such challenges in the field of effective city planning which are unsustainable growth, haphazard development, and insufficient infrastructure have negative impacts on the development and performance of these cities, producing series of problems. Therefore, it is necessary to find out effective systems and technologies to address such problems.
This paper introduces the practice in planning and developing ‘Green and Eco Nashik City’ in Maharashtra, including the elaboration of its land use, green systems and urban structure which produces most of its needed infrastructure without making any pressure on the national and local existing infrastructure systems.
The paper mostly focuses on Green City variables in Nashik city. To enhance the standard of living in a compact city, green city development is considered as an effective alternative other than conventional approaches. For the effective usage of the urban area, it becomes necessary to investigate the significant factors influencing the development potential of urban space. This study proposes a model to evaluate the green city index of Nashik city (GCI). For the development of a model to evaluate GCI, the Delphi method and Analytical hierarchy process (AHP) are used. A public survey is conducted to quantify GCI of six zones of Nashik city. On the basis of this analysis, the proposal is given for the healthy and environmentally friendly city.
Keywords: Green city, Green City Index (GCI), AHP, Delphi, Nashik. I. INTRODUCTION
In urban areas, depletion of conventional energy resources, city crowding, increased pollution, haphazard development, unsustainable growth as well as global warming with their consequences of quality of life, these are the most pressing issues of the 21st century.
Large settlements, high density of population and constructions, these will be most affected regarding in such issues. Therefore, planners will have to think about their functions and structures in order to meet the needs of sustainable urban living.
Green cities are those where economic growth and development is encouraging, that reduce negative environmental impact on natural resources and the pressure on the ecosystem. These cities have significant collaboration between environmental and economic objectives. Waste management and recycling, pollution preservation, treatment energy, clean and effective production and consumption of facilities related to movements of people and goods, resource extraction, agriculture, natural resource management, and other environmental services are prime components of the green city.
Relationship between urban planning and management and social health is not new but what has changed now is the health crisis, whether in developed or developing countries. Green cities movement is considered as a creativity and initiative plan in the promotion of health, urban planning, urban ecosystem conservation and moves towards decentralization of government to public sectors, the intersectional activities and social participation. the green town is thought a town that by making continuous development and physical conditions next to Social, environmental and efficient use of existing resources residents rise their ability while they are working together and support the community Participation in group life and do all their capabilities to deliver maximum.
3153
©IJRASET: All Rights are Reserved
II. STUDYAREAPROFILE–NASHIK
The city is finite on north, by the northern boundary of villages Gangapur, Anandwali, Makhamalabad, Mhasrul, and Adgaon; on east, by the japanese boundary of villages Adgaon, Manor, Panchak, Chadegaon; on south by the northern boundary of stream Darna, south boundary of half villages, Vihitgaon, Vadner, Pimpalgaon Khamb, south boundary of villages, Dadhegaon, Pathardi,; on west by western boundary of villages Chunchale, Satpur, Pimpalgaon–Bahula, and Gangapur. The Nashik town lies on each facet of the stream Godavari, Panchavati lying across on Latin Quarter with Tapovan on facet of it & the recent Nashik on the correct bank.
The main practical square measureas of the town are, the Nashik core space (the Nucleus), Satpur, Ambad Industrial areas, and therefore the second practical space is that the Nashik–Pune road space with Nashik-Road railroad station, supported by the economic activities at Eklahara Thermal station, Railway Traction manufactory, etc. tho' these 2 square measureas are separate, they themselves have robust interrelatedness. Satpur Industrial space is towards the west. The M.I.D.C. Satpur Industrial Estate is especially to blame for Industrial growth of Satpur space.
[image:2.595.105.505.305.481.2]The Nashik Municipal Corporation covers a neighborhood of concerning 267.48 sq. kilometers (26747.75 hectares) and includes twenty five villages out of that Vihitgaon, Vadner, and Pimpalgaon Khamb square measure part enclosed. the realm is figured out on the premise of village wise revenue record that is in an elaborate way mentioned within the forswearing chapter.
Fig. 1 Study Area Nashik city
A. Demographic features
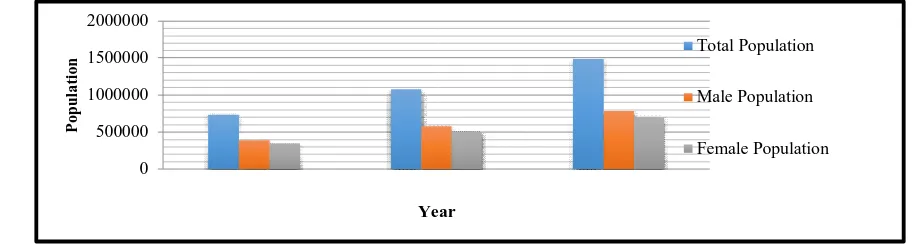
As per the 2011 census, the full population of the complete space of Nashik Municipal Corporation, was 14,86,053 souls as against the 2001 census population of ten,77,236 souls, indicating the expansion rate of thirty seven.95% throughout the 2001-2011 decade. Similarly, the population for 1991 was seven,33,000 souls indicating decadal growth of forty six.96%. Following Table shows decadal increment.The sex magnitude relation for Nashik Municipal Corporation as per 2011 census works dead set be 899 feminine per one thousand male as against the several sex magnitude relation figures of 929 for geographic region State. Out of the full population of fourteen,86,053 persons, the amount of males is seven,82,517 and 7,03,536 ar feminine. Following table shows the structure of the population for the last 20 years.
0 500000 1000000 1500000 2000000
P
op
u
la
ti
on
Year
Total Population
Male Population
Female Population
[image:2.595.80.538.607.729.2]3154
©IJRASET: All Rights are Reserved
B. Distribution of Population
On the idea of 2011 census figures, the population density of Nashik Municipal Corporation is 5556 persons per sq. km. The municipal corporation is split into sixty one wards. The table below offers village wise space & approximate population, gross density as per 2011 census. The very best gross density of 250.13 persons per area unit is in village Kamathwade. Very cheap gross density of four.22 persons per area unit is in village Dadhegaon.
21%
1%
6%
3% 1% 6%
3% 3%
1% 33%
3% 17%
2%
Residential Commercial
Industrial Public and Semi-Public
Public Utility Transportation
Garden, Play Ground and Recreation Military
C.I.D.C.O Agricultural
Water Bodies Vacant Land
[image:3.595.78.529.176.437.2]Forest
Fig. 3 Existing Land Use Structure of Nashik City
III.METHODOLOGY
The methodology adopted for this study is shown in figure. Understanding the existing available literature to attain the specific objective was the base of the study. Field and inventory data was collected as per the need of the study. Review of experts and public survey are recorded through well-designed questionnaires. After getting the entire required data Green city Index is developed. For Delphi and Analytic Hierarchy Process (AHP), Microsoft Excel software is used. Formulated Green City Index has been validated through computing the indices of public surveys from the study area. Proposals will be prepared based on analysis and literature review for Nashik City. The conclusion of the study at the end to summarized the work and carried out the study.
[image:3.595.132.472.553.741.2]3155
©IJRASET: All Rights are Reserved
For Green City Index of Nashik City, two types of surveys are carried out. To identify the potential factors literature is reviewed thoroughly. After that inventory, the survey is conducted through expert opinion to find out the significant influencing factors for the safety and comfort aspect of the Green City. After finalizing the factors and their subfactors AHP is applied to get the weights of the factors and subfactors. Thereafter, to quantify GCI public survey is done with a well- designed questionnaire.
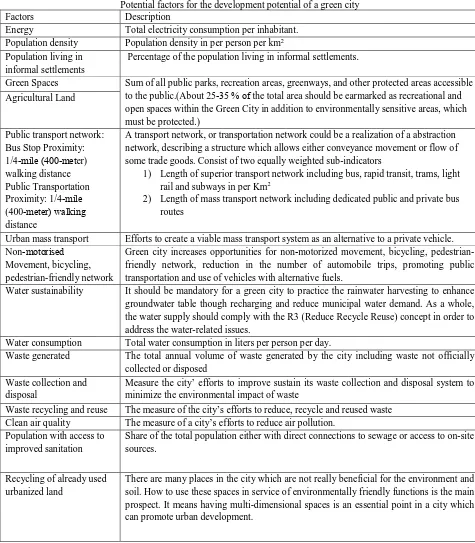
[image:4.595.58.533.198.741.2]A. Potential Factors
TABLE I
Potential factors for the development potential of a green city
Factors Description
Energy Total electricity consumption per inhabitant. Population density Population density in per person per km2
Population living in informal settlements
Percentage of the population living in informal settlements.
Green Spaces Sum of all public parks, recreation areas, greenways, and other protected areas accessible to the public.(About 25‐35 % of the total area should be earmarked as recreational and open spaces within the Green City in addition to environmentally sensitive areas, which must be protected.)
Agricultural Land
Public transport network: Bus Stop Proximity:
1/4‐mile (400‐meter)
walking distance Public Transportation Proximity: 1/4‐mile
(400‐meter) walking
distance
A transport network, or transportation network could be a realization of a abstraction network, describing a structure which allows either conveyance movement or flow of some trade goods. Consist of two equally weighted sub-indicators
1) Length of superior transport network including bus, rapid transit, trams, light rail and subways in per Km2
2) Length of mass transport network including dedicated public and private bus routes
Urban mass transport Efforts to create a viable mass transport system as an alternative to a private vehicle.
Non‐motorised
Movement, bicycling, pedestrian-friendly network
Green city increases opportunities for non‐motorized movement, bicycling, pedestrian-friendly network, reduction in the number of automobile trips, promoting public transportation and use of vehicles with alternative fuels.
Water sustainability It should be mandatory for a green city to practice the rainwater harvesting to enhance groundwater table though recharging and reduce municipal water demand. As a whole, the water supply should comply with the R3 (Reduce Recycle Reuse) concept in order to address the water-related issues.
Water consumption Total water consumption in liters per person per day.
Waste generated The total annual volume of waste generated by the city including waste not officially collected or disposed
Waste collection and disposal
Measure the city’ efforts to improve sustain its waste collection and disposal system to minimize the environmental impact of waste
Waste recycling and reuse The measure of the city’s efforts to reduce, recycle and reused waste Clean air quality The measure of a city’s efforts to reduce air pollution.
Population with access to improved sanitation
Share of the total population either with direct connections to sewage or access to on-site sources.
Recycling of already used urbanized land
3156
©IJRASET: All Rights are Reserved
B. Delphi Analysis
1) Delphi Survey: Round 1: In the first round of the Delphi survey, a well-defined questionnaire is provided for each of the selected experts for giving the priority to the factors as per their individual experience and knowledge. The brief description was given to the members of the expert panel about the identified factors of green city aspect and was asked to make their response in the questionnaire on Likert scale in between 1 to 5 with 5 being very significant and 1is not significant. The questionnaire was given personally to the experts who prefer hard copy and was also e-mailed to some of the experts. All the responses were recorded and the standard deviation and the geometric mean was calculated for all the factors. According to that, the Initial Rank is allotted to the individual factors.
2) Delphi Survey: Round 2: The results which are obtained from the first round of Delphi survey was presented before the members of the expert panel and were requested to mark their responses again in the questionnaire based on the significance level of factors. The sole purpose of this round is to reduce the standard deviation in the opinion of the expert. By providing them the result of round one, the experts have a better insight into the responses other experts, thus leads to the consensus among the experts and narrowing the results to provide a more unified ranking. After round two the factors were ranked again as revised ranking of the individual factors.
TABLEII
DELPHI RESULT FOR ROUND I AND II FOR GREEN CITY FACTORS
Factors
Delphi analysis of
Round I
Delphi analysis of
Round II
GM SD GM SD
Electricity consumption per capita 4.3491 0.5175 4.3491 0.5175 Population density 3.6093 1.0351 3.4363 0.7559 Population living in informal settlements 3.9044 0.9258 3.9044 0.9258
Green spaces 4.5986 0.5175 4.5986 0.5175
Agricultural Land 4.0148 0.9910 4.0148 0.9910 Public transport network: 4.5617 0.7440 4.5617 0.7440 Urban mass transport 4.5617 0.7440 4.3142 0.7440
Non‐motorized movement 4.4362 0.7559 4.4362 0.7559
Water sustainability 4.4721 0.5345 4.3491 0.5175 Water consumption 4.0148 0.9910 4.5617 0.7440
Waste generated 3.7415 0.9910 3.6385 0.8864
Waste collection and disposal 3.9243 1.2464 3.9243 1.2464 Waste recycling and reuse 4.1010 1.0351 4.1010 1.0351 Clean air quality 3.9360 0.7559 3.9360 0.7559 Population with access to improved
sanitation
3.2352 1.4142 2.7425 1.5526
Recycling of already used urbanized land 3.0398 0.8345 2.8473 1.0690
Thus, the top nine green city factors are selected for further analysis are: (1) Energy; (2) Population living in informal settlement; (3) Green Spaces; (4) Agricultural Land; (5)Public Transport Network; (6) Non-Motorized Movement; (7) Waste Management; (8) Water Management and (9) Clean Air Quality
C. AHP Application
The factors which are identified as a potential factor for the green city aspect by using the Delphi method are analysed to determine the weights of these selected factors using data collected from AHP.
3157
©IJRASET: All Rights are Reserved
TABLEIII
FINAL WEIGHTS OF GREEN CITY FACTORS
Weight % Weight
Energy 0.035 4%
green spaces 0.206 21%
agricultural land 0.147 15%
slum area 0.061 6%
public transport 0.091 9% non-motorized
movement 0.110 11%
waste management 0.040 4% water management 0.218 22%
air quality 0.092 9%
Total 1 100%
D. Formulation of GCI (Green City Index)
The GCI is an empirical formula to quantify the extent of Green City parameters of the Nashik City. The weighted sum method (WSM) approach was adopted for the formulation of GCI. Substituting the values of factors from Table, the final equation of GCI is shown.
GCI = w1X1+w2X2+w3X3+……. +wnXn
=0.035En + 0.206Gr + 0.147Ar + 0.091Slm + 0.061Pt + 0.11Nm + 0.04Wm + 0.218Wrm + 0.092Aq Where,
En = Energy Gr = Green Spaces
Ar = Agricultural Land Slm = Slum area
Pt = Public Transportation Nm = Non-motorized movement Wm = Waste Management Wrm = Water Management Aq = Air Quality
This equation defines the Green City Index of any zone in Nashik city in numerical values.
The GCI are functions of nine factors for a green city. Their values vary from 0 to 5, where 0 and 5 conditions are hypothetical as 0 indicates “No Green Zone” while 5 indicates “Fully Green Zone”. Both extremes are not feasible.
E. Illustration for Computation of GCI
Nashik city is selected as a sample for evaluation of Green City aspect. To evaluate these eighty public surveys are conducted through a well-designed questionnaire in each zone. Respondents are asked to give their response in the scale of 1 to 5 which they think suits best for the given question. The GCI for all six zones of Nashik City is given below:
TABLEVIII
GCI OF ALL ZONES OF NASHIK CITY
West Zone 3.4089
East Zone 3.3559
Panchavti Zone 3.2688
New Nashik Zone 3.3338
Nashik Road Zone 3.0163
Satpur Zone 2.8963
F. Practical application and validation of GCI
3158
©IJRASET: All Rights are Reserved
IV.CONCLUSIONS
The data obtained from four hundred and seventy-two public responses from six zones of Nashik City were analyzed to give scores for each Green City Parameters. The analysis of the study leads us to the result discussion in the previous chapter. This chapter covers a short summary of the whole study. The major findings and observation of the study are also discussed.
For this, the study was further divided into two parts (1) Identification of influencing factors for the green city aspect of Nashik city and select the most significant influencing factors using Delphi technique and (2) assigning the weights to the selected factors and sub factors using AHP and develop the GCI model using WSM. The data regarding green city factors were obtained from GCI scores. Afterward, the values for GCI for the six zones of Nashik city were checked for normality. The data set of six zones followed the normal distribution. The responses from each zone were collected. The rating scale 1 to 5 was given to that responses, after that average of each parameter is taken and put it in the model to evaluate of green city index of each zone. From that index, we came to know that which zone is lagging behind. West zone has good green city index on the other hand Satpur zone is lagging behind. Therefore the proposal is given to Satpur zone.
The proposal is given to Satpur zone for the selected parameters:
1) For energy conservation, can use renewable energy source, such as solar panels. Therefore solar farms are built for Satpur zone to reduced use of conventional energy sources for electricity.
2) For the population living in an informal settlement, slum rehabilitation is proposed to the zone.
3) For the green and recreational spaces, increasing the number of recreational spaces to twenty-five percent of the total area of the zone. Greenways, blue-green corridors, green roofs, the urban forest is proposed to increase the green spaces, to improve the quality of life and to reduce the percentage of CO2.
4) Public transport facility is made available within the 400m walking distance to people. A number of public mass transport vehicle must be increased to reduce traffic congestion and delay to work. Increased the number of non-motorized vehicle by proving well maintain pedestrian walking and bicyclist path.
5) Air quality meters are proposed to maintain the quality of air and restrict the air pollution which causes by the industries present in the zone.
V. ACKNOWLEDGMENT
I acknowledge Government of India and Department of planning for providing the maps of my study area and I am thankful to the Nashik Municipal Corporation for providing necessary data.
REFERENCES
[1] Hosam K. El Ghorab , Heidi A. Shalaby, Eco and Green cities as new approaches for planning and developing cities in Egypt, Elsevier Journal (2016). [2] M Casini, Green Technology for Smart Cities, 2nd International Conference on Green Energy Technology (ICGET 2017) IOP Publishing IOP Conf. Series:
Earth and Environmental Science 83 (2017) 012014 do i :10.1088/1755-1315/83/1/012014.
[3] Jennifer R. Wolcha, Jason Byrneb, Joshua P. Newellc, Urban green space, public health, and environmental justice: the challenge of making cities ‘just green enough’ Elsevier Journal (2014).
[4] Mostafa Basiri, Mina Farokhi Someh, Bahman Ghaderi, Ali Zeynali Azim, REVIEW, AND ANALYSIS THE INDICATORS OF GREEN CITY WITH NDVI (STUDY CASE SHEIKH TAPPEH NEIGHBORHOOD IN URMIA), European Scientific Journal November 2014 /SPECIAL/ edition vol.2 ISSN: 1857 – 7881 (Print) e - ISSN 1857- 7431.
[5] Ibrahim Hegazy, Wael Seddik, and Hossam Ibrahim, towards green cities in developing countries: Egyptian new cities as a case study, International Journal of Low-Carbon Technologies 2017, 12, 358–368.
[6] Amin Pujiati, Purbayu Budi Santosa, J.J. Sarungu, The Determinants of Green and Non-Green City: An Empirical Research in Indonesia, American International Journal of Contemporary Research Vol. 3 No. 8; August 2013.
[7] A Maltseva, Green Framework and Its Role in Sustainable City Development (by Example of Yekaterinburg), ICCATS 2017 IOP Publishing IOP Conf. Series: Materials Science and Engineering 262 (2017) 01214 doi:10.1088/1757-899X/262/1/012148.
[8] Aabshar U. K. Imam, Uttam Kumar Banerjee, Urbanisation and greening of Indian cities: Problems, practices, and policies, Springer Publications, (2016). [9] Ogenis Brilhante, and Jannes Klaas, Green City Concept and a Method to Measure Green City Performance over Time Applied to Fifty Cities Globally:
Influence of GDP, Population Size and Energy Efficiency, Sustainability 2018, 10, 2031; doi:10.3390/su10062031 www.mdpi.com/journal.
[10] Benjamin Richter, Martin Behnisch, Integrated evaluation framework for environmental planning in the context of compact green cities, Elsevier journal (2016).
[11] Sirkku Juhola, Planning for a green city: The Green Factor tool, Elsevier journal (2018).
[12] Hegazy I.Informal settlement upgrading policies in Egypt: towards improvement in the upgrading process. J Urban 2016;9:254–75. [13] Jones D. How urbanization affects energy use in developing countires. Energy Policy 1991;19:621–30.
[14] Uttara S, Bhuvandas N, Aggarwal V. Impacts of urbanization on environment. Int J Res Eng Appl Sci 2012;2:1637–45.
3159
©IJRASET: All Rights are Reserved
[17] Johnson M. Environmental impacts of urban sprawl: a survey of the literature and proposed research agenda. J Environ Policy Planning A 2001;33:717–35. [18] Alberti M, Booth D, Hill K, et al: The impact of urban patterns on aquatic ecosystems: an empirical analysis in Puget lowland sub-basins. Landscape and
Urban Planning, 80: 345-361,2007.
[19] Baycan-Levent T, Vreeker R, Nijkamp P: A multi-criteria evaluation of green spaces in European cities. IAEES, 2009.