©IJRASET: All Rights are Reserved
1665
Waste Detection in the Construction Industry using
Lean Techniques
Amal R Nath
1, Unnikrishnan S
2, Gayathri Thampi
31Post Graduate Student, Department of Civil Engineering, Sri Vellappally Natesan College of Engineering, Kattachira, Kerala 2Research Scholar, Department of Civil Engineering, NIT, Calicut, Kerala
3Assistant Professor, Department of Civil Engineering, Sri Vellappally Natesan College of Engineering, Kattachira, Kerala
Abstract: The construction industry contributes a lot to a country’s economic stability by providing employment, physical facilities and infrastructures. The effort towards economic development and urbanization has created a significant demand on natural resources, consuming more than half of the mineral resources excavated from nature and the rest gets wasted. Waste generation has, therefore, become a serious drawback that the construction industry is suffering from and one of the major challenges affecting its performance. Thus, the introduction of Lean Construction (LC) as a waste reduction, supply management, value for money and project quality management mechanisms in the construction industry. The aim of this study is to detect the waste affecting in the Kerala construction industry using Lean techniques. Data collection was done through well-structured questionnaire survey, carried out among clients, engineers and contractors. A total of 123 questionnaires were collected, the data were analyzed using SPSS software. From the study it concluded that ineffective planning, scheduling and inappropriate project coordination results in various forms of waste generation.
Keywords: Lean, ANOVA, CREDAI, Questionnaire, RII, SPSS.
I. INTRODUCTION
A. General
LC has become one of the primary performative improvement recipes for the construction Industry. Firstly, LC emphasizes on waste reduction from the technical and operational point of view and secondly on the elimination of harmful relationships in the process while promoting teamwork between the supply chain managers. These are wastes generated from all the activities involved in the construction processes.Waste is defined as any construction activities or process that incur costs which do not directly or indirectly add value to the construction project. These construction activities can be value-adding activities (conversion of raw materials to the final product) and non-value adding activities (wastes, wasteful operations). Construction waste could be because of errors in design, modifications, redoing of work, defects and the use of excess materials. It is therefore important to ensure waste generation is minimized in construction processes and activities.
B. Waste from construction processes
Construction waste comprises of waiting times, lack of safety, rework, unnecessary transportation trips, excess inventory, quality costs, set up, handling, inspections, expedition, prioritizing, improper choice of management method and lack of constructability amongst others. These wastes are generated at one stage or the other in a construction process.
1) Waste from Overproduction: Overproduction is related to the production of a quantity greater than required or than necessary. Making products for which there is no demand is wasteful, therefore waste from overproduction is difficult to identify, unless what is produced is compared with what is sold and shipped otherwise nothing appears wrong.
2) Waste from Rejects: Waste of defects occurs when the final or intermediate product does not fit the quality specifications. These will add additional rework, inspection, design changes, process changes, and machine downtime.
3) Waste in Transportation: The transportation is concerned with the internal movement of materials on site where workplace layout or a lack of process flow creates many stops and start in a production cycle. Every movement should have a purpose for items being moved incur a cost. Excessive handling, the use of inadequate equipment or bad conditions of pathways can also cause this kind of waste.
4) Waste in Over Processing: It is the extra processing of the job beyond the requirements of the client. This is also referred to as
©IJRASET: All Rights are Reserved
1666
5) Waste from Inventory: The excess inventory can be found in construction products and raw materials (in deterioration, losses due to inadequate stock conditions on site, robbery, and vandalism) and monetary losses due to the capital that is tied up.
6) Waste from Waiting: It includes waiting for materials, information, equipment, and tools among others. Waste of waiting is necessarily about jobs waiting to be processed. This can be drastically reduced by linking up the processes together to one which feeds directly into the next.
7) Waste from Motion: It is generated through the movement of resources including human being and equipment not necessary for the successful completion of the operation. This might also be caused by inadequate equipment, ineffective work methods, or poor arrangement of the working place resulting in processing delays
.
C. Research Objectives
The objective is to identify the non-value adding activities and wastes in the construction industry through questionnaire survey and to analyze the data collected using SPSS software.
D. Need for Study
The construction industry is faced with chronic problems such as time and cost overruns, low productivity, poor safety, inferior working conditions, insufficient quality, lack of skilled manpower etc. By implementing lean principles, major focus is on elimination of waste, it is important to understand and quantify the amount of waste present in Indian construction sites. Thus, with the help of adopting lean principles in the sites, the construction wastes can be effectively reduced and thus can increase the efficiency and productivity of the construction industry.
II. METHODOLOGY
This chapter is divided into different sections,
A preliminary survey was conducted in order to know the factors affecting in the formation of waste on various construction projects. For this preliminary survey a questionnaire was distributed to different companies in Kerala.
Process of Working on the Project is as follows: -
1) Literature review
2) Factors identification
3) Questionnaire preparation
4) Questionnaire survey
5) Data analysis using SPSS software
6) Conclusion
A. Identification of Factors
There are thirty plus literature are studied were done, based on literature survey top factors are identified and listed out. The main wastes classified as transportation, inventory, motion, overproduction, over processing, correction and waiting.
B. Questionnaire Sampling
Due to the limitation, the total population for this study were focused on the construction developers and their ongoing projects at Ernakulam, Thiruvananthapuram, Kozhikode, Kollam and Thrissur.
Simple random approach was selected as the list of sampling frame had been created. Sample sizes larger than 30 and less than 500 are appropriate for most research. Here the total ongoing projects on these cities are 287 projects and to provide questionnaire survey it gets sampled to a total of 100 ongoing projects.
C. Questionnaire Preparation
©IJRASET: All Rights are Reserved
1667
The questionnaires are all classified into 2 sections:
1) Section A:Company and respondent profile
2) Section B: Waste in the construction industry.
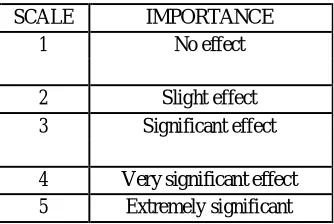
[image:3.595.215.382.209.321.2]Based on the literatures and factors considered, a questionnaire was designed as a measurement tool for impacts. The 94 factors were adapted to identify the waste in the construction industry. Also, the respondents were asked to rate their level of argument according to 5-point scale (Likert’s scale) according to level of contributing.
Table 2.1: Likert’s scale SCALE IMPORTANCE
1 No effect 2 Slight effect 3 Significant effect 4 Very significant effect 5 Extremely significant
D. Relative Importance Index (RII)
Relative Importance Index (RII) method was used as data analysis method to assess the most important factor. A five-point Likert’s scale was adopted. The relative importance index, RII, was computed for each factor to identify the most and the least significant factors affecting in the formation of waste in the construction industry.
The causes were examined, and the ranking of their attributes was done using the Relative Importance Index (RII). The relative importance index is given as:
Rii= ∑
×
Where,
Rii = Relative Important Index
W = Weighting given to each factor by the respondents (ranging from 1 to 5) A= Highest weight (here 5)
N= Total number of respondents
E. Data Analysis
This study will adopt the Statistical Packages for Science Social (SPSS) version 20 for interpretation to identify the most important factor affecting in the construction industry.
III. DATA ANALYSIS
A. General
The computer software plays a vital role in analyzing the collected data. The software would give an efficient result for our work study. The analysis software is discussed in detail.
B. Statistical Package For Social Sciences
SPSS trends provide the power and flexibility required by experienced time series analysts, while at the same time being easy enough for those not familiar with time series techniques to use and master quickly. Its power and flexibility can be seen in the wide variety of identification, estimation, forecasting and diagnostic methods available and the opportunity for continuous interaction during the model-building process and the ability to quickly create new series as functions, transformation or components of the observed series for further analysis
C. Survey Analysis
©IJRASET: All Rights are Reserved
1668
Table 3.1 Respondents status
From Table 3.1, it can be
[image:4.595.181.419.366.440.2]identified that the group who give the most feedback to the questionnaire is from the group of project executive, project manager and general manager which consist of 35% out of 123 respondents. It can be concluded that, project executive, project manager and general manager are the one who actively respond to the distributed questionnaire.
Table 3.2: Experience status
As from the Table 3.2, the highest respondents who had filled in the questionnaire completely are belonging to the group from between 10 - 15 years of experience. This means that 38% out of 123 respondents had an experience between 10 - 15 years in related to their status / title in their company. Whereas the least group who had participate in this study is contributed by those respondents who have an experience between 0-5 years.
IV. RESULT AND DISCUSSION
A. Ranking of Factors
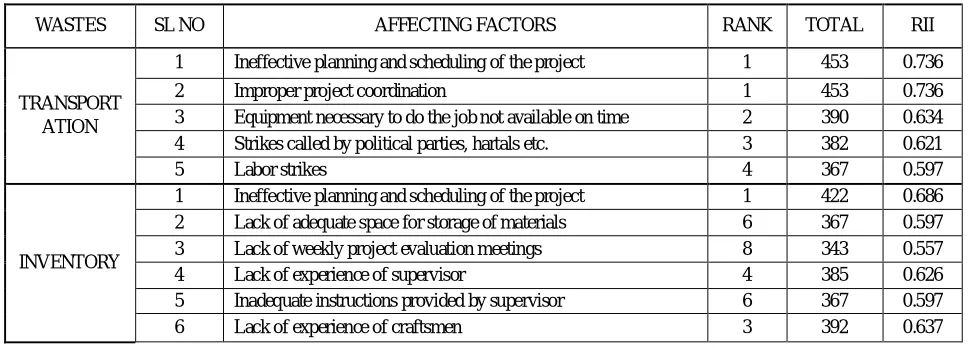
Questionnaire survey was conducted, and factors are analyzed by using SPSS software and they are ranked based on RII value. Table 4.1: Rank value
WASTES SL NO AFFECTING FACTORS RANK TOTAL RII
TRANSPORT ATION
1 Ineffective planning and scheduling of the project 1 453 0.736 2 Improper project coordination 1 453 0.736 3 Equipment necessary to do the job not available on time 2 390 0.634 4 Strikes called by political parties, hartals etc. 3 382 0.621
5 Labor strikes 4 367 0.597
INVENTORY
1 Ineffective planning and scheduling of the project 1 422 0.686 2 Lack of adequate space for storage of materials 6 367 0.597 3 Lack of weekly project evaluation meetings 8 343 0.557 4 Lack of experience of supervisor 4 385 0.626 5 Inadequate instructions provided by supervisor 6 367 0.597 6 Lack of experience of craftsmen 3 392 0.637
SL. NO DESIGNATION NO: OF RESPONSE 1 Managing Director, Executive Director 25
2 Project Manager, General Manager, Assistant Manager
43
3 Senior Engineer, Site Engineer 38 4 Main Contractor, Sub Contractor, Client, Supervisor 17
5 Others -
Total 123
Sl: NO YEAR OF EXPERIENCE RESPONTANCE
1 0-5 12
[image:4.595.56.540.577.751.2]©IJRASET: All Rights are Reserved
1669
7 Lack of team spirit among craftsmen 7 366 0.595 8 Unavailability of materials in time at the workplace 5 380 0.618 9 Delay in material delivery 2 413 0.672
10 Frequent revisions of drawing/ design resulting in additional
work/ rework 1 422 0.686
MOTION
1 Ineffective planning and scheduling of the project 1 428 0.696 2 Improper project coordination 2 421 0.684
3 Site congestion 5 380 0.618
4 Lack of interaction among the site community 8 344 0.559 5 Communication problem among craftsmen and supervisors 4 386 0.627 6 Unavailability of tools on time at the worksite 6 363 0.59 7 Equipment necessary to do the job not available on time 7 346 0.563 8 Accidents causing hindrance to work at site 10 287 0.467 9 Strikes called by political parties, hartals etc. 9 311 0.506
10 Labour strikes 3 396 0.644
WAITING
1 Ineffective planning and scheduling of the project 7 391 0.636 2 Improper project coordination 1 454 0.738 3 Interference from other trades or other crew members 13 363 0.59 4 Disputes with consultants/ owner causing stoppage of work 9 383 0.623 5 Lack of interaction among the site community 10 379 0.616 6 Communication problem among craftsmen and supervisors 11 377 0.613 7 Slowness in decision making 4 418 0.68
8 Lack of periodic meeting among the management, site personnel
and the contractors 5 403 0.655
9 Lack of experience of supervisor 8 384 0.624 10 Inadequate instructions provided by supervisor 6 393 0.639 11 Supervisor absenteeism 18 344 0.559 12 Lack of experience of craftsmen 10 379 0.616 13 Rework due to field errors committed by craftsmen 12 376 0.611 14 Craftsmen absenteeism 16 356 0.578 15 Unavailability of materials in time at the workplace 3 420 0.683 16 Slow response on doubts arising from the drawings 12 376 0.611
17 Frequent revisions of drawing/ design resulting in additional
work/ rework 2 427 0.694
18 Design difficult to construct 14 358 0.582 19 Unavailability of tools on time at the worksite 15 357 0.58 20 Equipment necessary to do the job not available on time 13 363 0.59 21 Lack of maintenance of tools and plants 20 323 0.525 22 Slow equipment repairs in case of breakdown 17 345 0.561 23 Accidents causing hindrance to work at site 26 280 0.455
24 Climatic changes 23 293 0.476
25 Strikes called by political parties, hartals etc. 24 285 0.463
26 Labor strikes 22 307 0.499
27 Poor pay 21 311 0.506
28 Lack of monetary incentives 25 284 0.462
29 Lack of workmanship 19 341 0.554
©IJRASET: All Rights are Reserved
1670
OVER PROCESSING
1 Ineffective planning and scheduling of the project 1 404 0.657 2 Lack of weekly project evaluation meetings 2 369 0.6
3 Lack of periodic meeting among the management, site personnel
and the contractors 3 362 0.588
4 Lack of experience of supervisor 5 339 0.551 5 Inadequate instructions provided by supervisor 6 338 0.55 6 Lack of experience of craftsmen 4 343 0.557 7 Lack of team spirit among craftsmen 7 327 0.532
OVER PRODUCTIO
N
1 Ineffective planning and scheduling of the project 1 431 0.701 2 Improper project coordination 2 393 0.639 3 Lack of adequate space for storage of materials 4 337 0.548
4 Site congestion 9 306 0.497
5 Lack of weekly project evaluation meetings 8 320 0.52
6 Lack of periodic meeting among the management, site personnel
and the contractors 7 323 0.525
7 Lack of experience of supervisor 6 328 0.533 8 Inadequate instructions provided by supervisor 3 371 0.603 9 Lack of experience of craftsmen 4 337 0.548 10 Lack of team spirit among craftsmen 5 334 0.543
CORRECTIO N
1 Ineffective planning and scheduling of the project 2 425 0.691 2 Interference from other trades or other crew members 18 331 0.538 3 Disputes with consultants/ owner causing stoppage of work 19 330 0.536 4 Lack of interaction among the site community 10 363 0.59 5 Communication problem among craftsmen and supervisors 7 386 0.627 6 Lack of weekly project evaluation meetings 12 358 0.582
7 Lack of periodic meeting among the management, site personnel
and the contractors 15 342 0.556
8 Lack of experience of supervisor 8 377 0.613 9 Inadequate instructions provided by supervisor 9 372 0.605 10 Supervisor absenteeism 21 315 0.512 11 Lack of experience of craftsmen 14 355 0.577 12 Lack of team spirit among craftsmen 13 357 0.58 13 Rework due to field errors committed by craftsmen 16 341 0.554 14 Craftsmen absenteeism 22 311 0.506 15 Poor quality of materials 3 414 0.673 16 Unavailability of drawings in time at the worksite 1 432 0.702 17 Errors in the drawings 4 406 0.66 18 Slow response on doubts arising from the drawings 6 394 0.641
19 Frequent revisions of drawing/ design resulting in additional
work/ rework 5 397 0.645
20 Poor quality of tools provided/ used 11 361 0.587 21 Lack of maintenance of tools and plants 20 324 0.527 22 Disregard of craft worker suggestions/ ideas 17 339 0.551
©IJRASET: All Rights are Reserved
1671
the occurrence of wastes including motion, over processing and over production respectively. In the case of waste due to correction, the main factor causing its occurrence is unavailability of drawings in time at the work site.
B. Analysis and Result of Regression in SPSS
[image:7.595.123.475.202.258.2]The multiple regression analysis was done based on the most importance factors that were previously identified. Both backward and forward regression analysis (BRM and FRM) can be used for cost overrun. From the literature review, backward regression is more valid and applicable than the forward regression analysis.
Table 4.2: Model Summary
Model R R Square Adjusted R Square Std. Error of the Estimate 1 .997a .995 .994 .48005
Table 4.2 provides the R and R2 values. The R value represents the simple correlation and is 0.997 (the "R" Column), which indicates a high degree of correlation. The R2 value (the "R Square" column) indicates how much of the total variation in the
dependent variable can be explained by the independent variable, Factors. In this case, 99.4% can be explained, which is very large. Table 4.3: ANOVA
Model Sum of Squares df Mean Square F Sig. 1 Regression 1756.699 7 250.957 1089.013 .0001
Residual 9.218 40 .230 Total 1765.917 47
The Anova table, which reports how well the regression equation fits the data (i.e., predicts the dependent variable). This table indicates that the regression model predicts the dependent variable significantly well. At the "Regression" row the "Sig." column indicates the statistical significance of the regression model. Here, p = 0.00001, which is less than 0.05, and indicates that, overall, the regression model statistically significantly predicts the outcome variable (i.e., it is a good fit for the data).
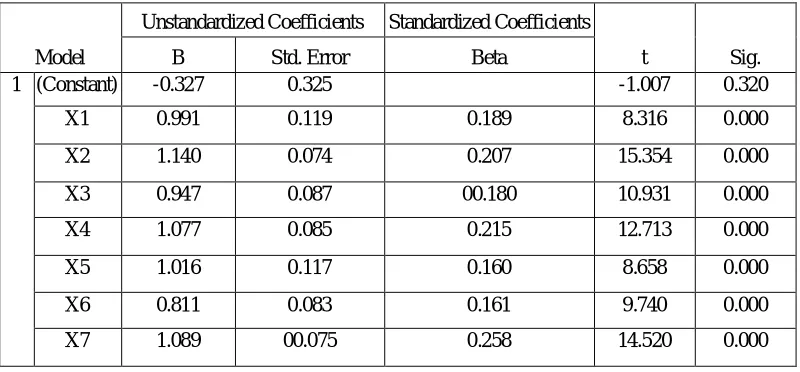
Table 4.4: Coefficients of Variables and T-test statistics
Model
Unstandardized Coefficients Standardized Coefficients
t Sig. B Std. Error Beta
1 (Constant) -0.327 0.325 -1.007 0.320 X1 0.991 0.119 0.189 8.316 0.000 X2 1.140 0.074 0.207 15.354 0.000 X3 0.947 0.087 00.180 10.931 0.000 X4 1.077 0.085 0.215 12.713 0.000 X5 1.016 0.117 0.160 8.658 0.000 X6 0.811 0.083 0.161 9.740 0.000 X7 1.089 00.075 0.258 14.520 0.000
The coefficients table provides us with the necessary information to predict waste from factors considered, as well as determine whether these factors contributes statistically significantly to the model (by checking at the "Sig." column). Furthermore, the values in the "B" column under the "Unstandardized Coefficients" was used to present the regression equation as:
Waste = 0.991 X1 + 1.140 X2 + 0.947 X3 + 1.077 X4 + 1.016 X5 + 0.811 X6 + 1.089 X7 – 0.327
[image:7.595.99.499.464.650.2]©IJRASET: All Rights are Reserved
1672
V. CONCLUSION
In overall, the objectives of this study have successfully conducted, and the data collected had also been analyzed. Totally 123 responses were collected through online and personal, and data were analyzed by using SPSS. From the findings, it was identified that waiting and transportation wastes are the major construction wastes affecting in the Kerala construction industry. While other wastes do not have heavy impact on the construction industry. Ineffective planning and scheduling of the project and improper project coordination are the major factors affecting in the occurrence of these major wastes. Through proper project managing and scheduling these wastes can be avoided.
.
VI. ACKNOWLEDGMENT
We are thankful to all the teaching and non-teaching staff of Sri Vellappally Natesan College of Engineering for supporting us throughout this work.
REFERENCES
[1] Oguntona O A and Aigbavboa C O (2018), An Assessment of Lean Construction Practices in the Construction Industry, International Conference on Applied Human Factors and Ergonomics,524 – 534, Springer, Cham.
[2] Hamzah Abdul Rahman and Chen Wang (2012), Waste Processing Framework for Non- Value Adding Activities using Lean Construction, Journal of Frontiers in Construction Engineering, 1, 8 – 13.
[3] Saad Sarhan and Amira Elnokaly (2018), Lean Construction and Sustainability through IGLC Community: A Critical Systematic Review of 25 Years of Experience, Annual Conference of the International Group for Lean Construction (IGLC), 1 – 9.
[4] Abbasian Hosseini and Nikakhtar (2012), Flow Production of Construction Processes through Implementing Lean Construction Principles and Simulation, IACSIT International Journal of Engineering and Technology, 4, 475 – 479.
[5] Luis Alarcon and Loreto Seguel (2002), Developing Incentive Strategies for Implementation of Lean Construction, Proceedings International Group of Lean Construction 10th Annual Conference, Universidad Federal de Rio Grande do Sul, 6 – 8.
[6] Amin Nikakhtar and Abbasian Hosseini (2015), Application of Lean Construction Principles to Reduce Construction Process Waste using Computer Simulation: A Case Study, International Journal of Services and Operations Management, 20, 4, 461 – 480.
[7] Sepani Senaratne and Duleesha Wijesiri (2008), Lean Construction as a Strategic Option: Testing its Suitability and Acceptability in Sri Lanka, Lean Construction Journal, 34 – 48.
[8] O Salem and J Solomon (2006), Lean Construction: From Theory to Implementation, Journal of Management in Engineering, 22, 4, 168 – 175. [9] O Salem and J Solomon (2005), Site Implementation and Assessment of Lean Construction Techniques, Lean Construction Journal, 2, 1 – 58.
[10] Fiona Keru Mwacharo (2013), Challenges of Lean Management: Investigating the Challenges and Developing a Recommendation for Lean Management Techniques.
[11] Saad Sarhan (2018), Institutional Waste within the UK Construction Industry: An Exploratory Study.
[12] Abdulsalam A Al – Sudairi (2007), Evaluating the Effect of Construction Process Characteristics to the Applicability of Lean Principles, Construction Innovation: Information, Process, Management, 7, 99 – 121.
[13] Formoso C T and Soibelman L (2002), Material Waste in Building Industry: Main Causes and Prevention, Journal of Construction Engineering and Management, 128, 316 – 325.
[14] A Forsberg and L Saukkoriipi (2007), Measurement of Waste and Productivity in relation to Lean Thinking, Proceedings for 15th Annual Conference of IGLC, 67 – 76.
[15] S Bertelsen (2004), Lean Construction: Where are we and How to proceed, Lean Construction Journal, 1, 46 – 49.
[16] Formoso C T and Isatto E L (1999), Method for Waste Control in the Building Industry, Proceedings of the 7th Annual Conference of IGLC, 325 – 334. [17] K P Ramaswamy and S N Kalidindi (2009), Waste in Indian Building Construction Projects, Proceedings of the 17th Annual Conference of IGLC, 3 – 14. [18] H R Thomas and M J Horman (2003), Improving Labour Flow Reliability for Better Productivity as Lean Construction Principle, Journal of Construction