Identification of Key
Indicators for Drinking Water
Protection Services in the
Urban Forests of Ljubljana
Urša Vilhar
Slovenian Forestry Institute Ljubljana
Slovenia
Primož Simončič
Slovenian Forestry Institute LjubljanaSlovenia
Original scientific paper
Abstract
Background and purpose: The importance of forest eco-system services, related to provisioning of fresh water and water purification are of increasing importance, especially in urbanized areas. This study investigates key indicators for ecosystem services, related to drinking water protec-tion, provided by urban and peri-urban forests.
Materials and methods: Seven different monitoring pro-grams, projects or directives, assessing water quality vari-ables were analysed. We determined which indicators, describing the drinking water protection services in forest ecosystems, can be applied to urban forests. A list of core indicators sensitive to the specifics of the drinking water supply and urban forest ecosystems in Ljubljana were sug-gested.
Results and conclusions: Analysis included over 86 po-tential indicators related to nutrient regulation, storage capacity and water purification in forest canopies, forest soils, surface streams, lakes and groundwater. Through scientific review and the application of “necessary” and “feasible” criteria to urban forests the number of indi-cators was reduced to 62. According to the specifics of drinking water supply and urban forest in Ljubljana 52 core indicators have been selected. Due to the influence of urbanization on water bodies, special emphasis should be given to indicators for storage capacity and water puri-fication capacity of urban forest ecosystems for hazardous substances. This might increase the willingness of decision and policy makers to acknowledge the water protection capacity of urban forests.
Keywords: urban forests, ecosystem services, drinking wa-ter protection, Ljubljana, Slovenia
INTRODUCTION
Forests are identified as the key landscape element for the provision of pristine surface and groundwater resources. Influence of forest cover on total runoff from a catchment [1-3] and water quality in rivers is increasing according to increasing share of forest cover in the basin [4, 5]. Nitrogen and phosphorous concentrations are lower in water bodies from forested catchment compared to a catchment with prevailing agriculture land [5, 6]. Forest ecosystem services of provisioning fresh water and water purification are of particular importance in those urbanized areas, where a great share of water sources (mainly for drinking use) comes from forested water catchments and drainage basins.
Urban forests are generally defined as tree stands or individual trees in and around urban community ecosystems, special due to their physiological, sociological, economic, and aesthetical benefits trees provide society [7]. Relative to natural ecosystems, urban ecosystems seem to possess similar climate, soils, vegetation, soil dynamics, and flows of energy as a result of natural ecological patterns and processes [8]. However, urban ecosystems differ from natural ecosystems in the importance and prevalence of certain disturbances (ibid.). Urbanization can negatively impact stream and drinking water quality by increasing loads of nutrients, metals and organic pollutants to surface and ground water [9]. Urban runoff and sewage releases were found to have a strong influence on the river geochemistry, including trace metal contamination [10]. Urbanization increases runoff frequency and duration due to increasing imperviousness [9].
their ecosystem services, related to drinking water protection and purification, is very limited. In order to increase the willingness of public entities [12] and private societies [13] to acknowledge the water protection capacity of urban forests, indicators and their benchmark definitions should be identified. Identification and systematic monitoring of indicators, related to drinking water protection services would help to link the decision making incorporated in urban planning system with the relevant scientific knowledge and environmental information, models and data, (e.g. water protection areas, human health exposure and risk by air pollutants, ecosystem exposure to exceedance of critical levels and loads, etc.) [11, 14, 15].
Indicators are numerical values that describe the state of a phenomenon or environment and are used as tools to summarize information about the condition of an ecosystem [16, 17]. Ecological indicators are communication tools that facilitate a simplification of the high complexity in human-environmental systems [18]. They reduce dimensionality of data, simplify interpretations, and facilitate communication between experts and non-experts [19]. Therefore, indicators could be used as metrics for key information concerning ecosystem structure, function and services [8].
This study investigates key indicators for ecosystem services, related to drinking water protection, provided by urban and peri-urban forests. A set of indicators was composed, based on a review of existing or proposed water quality variables from different programs, projects and directives. The specific hypotheses addressed in this study were to: 1) determine which indicators, describing the drinking water protection services in forest ecosystems, can be applied to urban and peri-urban forests and 2) suggest a list of core indicators, sensitive to the specifics of drinking water supply and urban forest ecosystems in Ljubljana.
Results could be used as part of a framework that uses indicators to assess the effects of urbanization and policies on urban forest structure and subsequent provision of its ecosystem services, related to drinking water protection.
MATERIAL AND METHODS
Study area
The City of Ljubljana has a population of 280 140 inhabitants. It is located at 46°03’20’’ N and 14°30’30’’ E in central part of Slovenia (South Eastern Europe) and covers an area of 275 km2 (http://www. ljubljana.si/si/ljubljana/). The climate is oceanic, with
average monthly temperature of -1.1 °C in January and 17.8 °C in June [20] and mean annual precipitation is 1393 mm in the reference period 1961 – 1990 [21].
Prevailing soils are diverse sorts of dystric soils on non-carbonate rocks: dystric regosols, dystric rankers and dystric cambisols [22]. Natural vegetation is mesic forest vegetation, characterized by Acidophilic, Submontane and (Alti-) montane Fagus sylvatica
forests [23]. Due to anthropogenic influences the natural forest vegetation is altered in many urban and peri-urban forests. Therefore in some areas secondary forests of Pinus sylvestris and Vaccinium myrtillus or
Picea abies monocultures prevail [22].
Urban and peri-urban forests
Forests cover an area of 11 651 ha, which is approximately 41 % of the total area of the City of Ljubljana [24]. The most forested is E part where forests cover 74 % of the area. In the central, more urbanized part, forest cover is 24 % [24]. 91 % of the forests are private, 7 % of the forests are state forests and the City of Ljubljana owns 2 % of the forests. Realization of forest management plans has been hindered by a high number of private forest owners in combination with the small average size of their forest land, often fragmented into a number of dislocated cadastral plots [24].
Forests in the City of Ljubljana belong to two forest management units of Slovenian Forestry Service which makes sylvicultural plans and hunting management plans every 10-years for all the forests regardless of the ownership. Fundamental principles of forest treatment and management are sustainability, close-to-nature management and multi-purpose management [25]. Compared to natural forests, urban and peri-urban forests in Ljubljana possess several specific social or environmental characteristics:
• deforestation due to infrastructure, urbanization and agriculture [24],
• pollution of air, soil, surface waters and groundwater [26]
• higher frequency of visitors and their use of forest infrastructure (e.g. recreational activities, transportation),
• illegal waste dumps, quarries and sandpits [24], • different species composition (e.g. lower
biodiversity compared to natural forests and higher occurrence of invasive species) [27], • smaller importance of wood production and
higher use of externalities [24],
• altered horizontal and vertical forest structure (e.g. intensive litter gathering in the past) [27], • different population dynamics of pests and
6. European Environmental Agency (EEA) core set of indicators [15];
7. World meteorological organization (WMO) - Gui-de to hydrological practices [34].
LTER-Europe and EnvEurope Project propose the design of environmental quality monitoring and the establishing of common parameter sets collected across a large network of long-term ecological research sites in Europe. Focusing on three types of ecosystems (terrestrial, freshwater and coastal/ marine) they aim at defining measures relevant to different scales of investigation, with specific monitoring intensities and with methods adjusted to the respective assessment intensity, implementing a multi-level and multi-functional approach [35]. We focused on water quality indicators for terrestrial and freshwater ecosystems.
The objectives of ICP Forests are to provide: 1) a periodic overview on the spatial and temporal variation of forest condition in relation to anthropogenic and natural stress factors (in particular air pollution) by means of European-wide and national large-scale representative monitoring on a systematic network and 2) a better understanding of the cause-effect relationships between the condition of forest ecosystems and anthropogenic as well as natural stress factors (in particular air pollution) by means of intensive monitoring on a number of selected permanent observation plots spread over Europe and to study the development of important forest ecosystems in Europe [36]. In this study we focused on Intensive monitoring (Level II) of ICP Forests which is carried out on plots installed in important forest ecosystems and are dedicated to in-depth investigation of the interactive effects of anthropogenic and natural stress factors on the condition of forest ecosystems. Special emphasis was given to the manuals on “Sampling and Analysis of Deposition” [37], “Sampling and Analysis of Soil” [38] and “Soil Solution Collection and Analysis” [39].
The overall aim of International Cooperative Programme on Integrated Monitoring of Air Pollution Effects on Ecosystems (ICP IM) allows the ecological effects of tropospheric ozone, heavy metals and persistent organic substances to be determined [40]. Implementation of the ICP IM provides a major contribution to the international data requirements for examining the ecosystem impacts of climatic change, changes in biodiversity and depletion of stratospheric ozone. In this study we focused on subprograms, related to Precipitation chemistry, Throughfall, Soil chemistry, Soil water chemistry, Runoff water chemistry, Stemflow, Groundwater
che-Water resources in the urban
and peri-urban forests
Most of the water supply for the Citiy of Ljubljana (pumping around 100 Ml d-1) is abstracted from groundwater of aquifer Ljubljansko polje and Ljubljansko Barje aquifer system [28]. The “Vodovod – kanalizacija” Public Utility provides, manages and maintains all water supply, sewerage, wastewater treatment and drainage services in Ljubljana (http:// www.jhl.si/vo-ka). The natural features of the groundwater aquifers allow the exploitation of drinking water that does not require additional treatment, but the city‘s activities put tremendous pressure on the soil and water reservoirs below it [29]. Hydrogeological survey of the available renewable water resources reports on 102 active and potential water resources (e.g. pumping stations, catchments and springs) in Ljubljana [28]. 36 of them are located in the forests, 61 in the forest edge and only 5 are located outside of the forest [30].
Water protection areas for water resources are regulated by national decrees on water protection areas for the water body of the Ljubljansko polje [31] and Ljubljansko Barje [32], which are in accordance to the European Community framework in the field of water policy [33]. The forest management measures formally correspond to the Water protection decrees, as reported by Vilhar et al. [30] in an assessment of implementation of the water protection regulations in the forest management planning.
Key indicators for drinking
water protection services
Key indicators for drinking water protection services in urban and peri-urban forests were selected based on a review of seven different monitoring programs, projects or directives, assessing water quality variables, which differ according to their objectives:
1. LTER-Europe, European Long-Term Ecosystem Research Network (http://www.lter-europe.net/); 2. EnvEurope Project, Life Environment Project LIFE08
ENV/IT/000339 (http://www.enveurope.eu/); 3. International Co-operative Programme on
Assessment and Monitoring of Air Pollution Effects on Forests (ICP Forests) (http://icp-forests. net/);
4. International Cooperative Programme on Integrated Monitoring of Air Pollution Effects on Ecosystems (ICP IM) (http://www.ymparisto.fi/ default.asp?node=6412&lan=en);
mistry, Lake water chemistry, Hydrobiology of streams and Hydrobiology of lakes [40].
Water Frame Directive of the European Parliament and of the Council [33] establishes a legal framework to protect and restore water across Europe and ensure its long-term, sustainable use. The directive establishes an innovative approach for water management based on river basins, the natural geographical and hydrological units, and sets specific deadlines for member states to protect aquatic ecosystems. The directive addresses inland surface waters, transitional waters, coastal waters and groundwater and targets at the achievement of an Ecological Quality Status (EQS) of all freshwater and coastal systems as well as a good ecological potential of heavily modified or artificial water bodies in the European Union until 2015. The directive requires from EU member states characterization of water bodies, monitoring and classifying the status of each water body in each river basin district and controlling pollution of surface waters by compliance with standards for priority substances and other substances discharged into surface water. We reviewed the environmental standards specifies for specific pollutants, priority substances and other pollutants and substances, the biological element status boundary values to water bodies, groundwater chemical status [41], etc.
European Environmental Agency (EEA) [15] has given higher priority to the development and publication of EEA core set of policy-relevant indicators for six environmental issues (air pollution, climate change, water, waste and material flows, biodiversity and terrestrial environment) and five sectors (transport, energy, agriculture, tourism and fisheries). We focused on indicators, related to water and terrestrial environment issues, mainly in agriculture sector.
World meteorological organization (WMO) in its Guide to hydrological practices [34] promotes the standardization of meteorological and hydrological observations describing in details the practices and procedures that members are requested or invited to follow, respectively, in monitoring and assessing their respective water resources. We focused on water quality related variables described in this Guide [34].
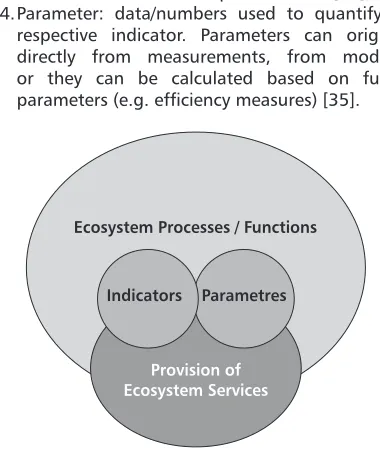
We defined a hierarchical indicator system, including the following components (Figure 1):
1. Ecosystem function or process considering specific environmental conditions (e.g. the storage capacity, referring to the nutrient, energy and water budgets of the ecosystem and the capacity of the ecosystem to store them when available and release them when needed [35]);
2. Provision of ecosystem service (e.g. drinking water protection) [42];
3. Indicator: a variable which provides aggregated information on a certain phenomenon [35]; 4. Parameter: data/numbers used to quantify the
respective indicator. Parameters can originate directly from measurements, from modeling or they can be calculated based on further parameters (e.g. efficiency measures) [35].
Ecosystem Processes / Functions
[image:4.558.291.481.127.353.2]Provision of Ecosystem Services Indicators Parametres
FIGURE 1
Linking ecosystem functions or processes and provision of ecosystem services to indicators and parameters
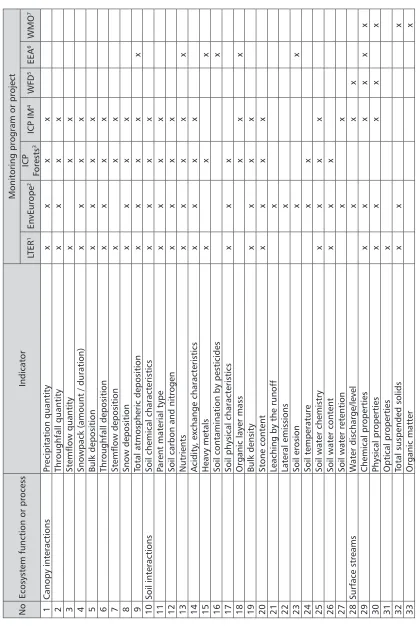
Political relevance, analytical soundness and measur-ability should be taken into account when selecting criteria for indicators [16]. Therefore the primary criteria were for each indicator to be necessary - contributing a unique perspective of an ecosystem component, and feasible - practical and able to be implemented [43]. We determined which indicators, describing the drinking water protection services in forest ecosystems, can be applied to urban and peri-urban forests and suggested a list of core indicators due to the specifics of drinking water supply and urban forest ecosystems in Ljubljana.
RESULTS
Selected indicators, sensitive to
specif-ics of urban and peri-urban forest
eco-systems
No
Ecosystem function or process
Indicator
Monitoring program or project
LTER 1 EnvEurope 2 ICP Forests 3 ICP IM 4 WFD 5 EEA 6 WMO 7 1 Canopy interactions Precipitation quantity x x x x 2 Throughfall quantity x x x x 3 Stemflow quantity x x x 4
Snowpack (amount / duration)
x x x x 5 Bulk deposition x x x x 6 Throughfall deposition x x x x 7 Stemflow deposition x x x 8 Snow deposition x x x x 9
Total atmospheric deposition
x x x x x 10 Soil interactions
Soil chemical characteristics
x
x
x
x
11
Parent material type
x
x
x
x
12
Soil carbon and nitrogen
x x x x 13 Nutrients x x x x x 14 Acidity
, exchange characteristics
x x x x 15 Heavy metals x x x 16
Soil contamination by pesticides
x
17
Soil physical characteristics
x
x
x
18
Organic layer mass
x x x 19 Bulk density x x x x 20 Stone content x x x x 21
Leaching by the runoff
x 22 Lateral emissions x 23 Soil erosion x x 24 Soil temperature x x 25
Soil water chemistry
x
x
x
x
26
Soil water content
x
x
x
27
Soil water retention
x x 28 Surface streams W ater discharge/level x x x 29 Chemical properties x x x x x x 30 Physical properties x x x x x 31 Optical properties x 32
Total suspended solids
x x x 33 Organic matter x
[image:5.558.81.497.78.704.2]No
Ecosystem function or process
Indicator
Monitoring program or project
LTER 1 EnvEurope 2 ICP Forests 3 ICP IM 4 WFD 5 EEA 6 WMO 7
* according to W
ater F
rame Directive 2000/60/EC [33]
1LTER-Europe: European
Long-Term Ecosystem Research Network (http://www
.lter
-europe.net/)
2EnvEurope Project, Life Environment Project LIFE08 ENV/IT/000339 (http://www
.enveurope.eu/)
3International Co-operative Programme on Assessment and Monitoring of Air P
ollution Effects on F
orests (ICP F
orests) (http://icp-forests.net/)
4International Cooperative Programme on Integrated Monitoring of Air P
ollution Effects on Ecosystems (ICP IM) (http://www
.ymparisto.fi/default.asp?node=6412&lan=en) 5Directive of the European Parliament and of the Council establishing a framework for the Community action in the field of water policy . W ater Frame Directive 2000/60/EC [33]
6European Environmental Agency (EEA) core set of indicators [15] 7W
orld meteorological organization (WMO) - Guide to hydrological practices [34].
34 Fluoride x x 35 Color x x 36
Hydrobiology of streams
x x x x x 37 Specific pollutants* x x 38 Priority substances* x 39 Other substances* x 40 Lakes Instantaneous discharge x 41 Physical properties x x x x x 42 Chemical properties x x x x x 43
Oxygen saturation, concentration (profile)
x 44 Metals x x 45 Fluoride x x 46 Transparency (L) x 47 W ater color x x x 48
Hydrobiology of lakes
x x x x x 49 Organic matter x 50 Ice cover x 51 Specific pollutants* x x 52 Priority substances* x 53 Other substances* x 54 Groundwater Groundwater chemistry x x x x 55 Groundwater level x x x x x 56 Groundwater recharge x x x x 57
Groundwater physical properties
x 58 Organic matter x 59 Microbiology x 60
Pesticides in groundwater
x
61
Other hazardous substances
x
x
62
Risks of contamination of surface and groundwater from contaminated sites
change the concentrations in the water. Thus the retention of fluxes in lakes might affect the values in the output to some degree.
Groundwater is defined as subsurface water, which occurs in the water saturated zone of ground [40]. It may lie near surface or deep in the bedrock. Groundwater is present everywhere and is, hence, one of the output media for elements in the terrestrial ecosystem. The monitoring of groundwater chemistry is dependent on the definition of the hydrological area. Usually it is monitored in open wells and observation tubes penetrating the loose overburden covering the bedrock. Monitoring may also take place in springs.
Water Frame Directive 2000/60/EC [33] defines environmental standards in surface streams, lakes and groundwater for specific pollutants (2,4-Dichlorophenoxyacetic acid, 2,4-Dichlorophenol, un-ionised ammonia as nitrogen, arsenic, chlorine(a), chromium VI, chromium III, copper, cyanide, cypermethin, diazinon, domethoate, iron, linuron, mecoprop, permethrin, phenol, toluene, zinc, total ammonia, etc.), priority substances (alachlor, atrazine, cadmium and its compounds, DDT total, lead and its compounds, mercury and its compounds, etc.) and other substances (3-chloro-3-methyl-phenol, bentazone, fenitrothion, 2-chlorophenol, biphenyl, malathion, 1,1,1-tichloroethane, chloronitrotoluenes, triphenyltin and its derivatives, 1,1,2-trichloroethane, dichlorvos, xylene).
Proposal of core indicators for
drinking water protection in urban
forests of Ljubljana
Most of the water supply for the City of Ljubljana is abstracted from groundwater [28]. The groundwater exhibits certain local characteristics as a result of land use and features of the natural supply of the aquifers [44]. Two recharging components of the groundwater, i.e. the local precipitation and infiltrated Sava river, are exposed to different sources of contamination because they originate from different parts of hydrological cycle [44]:
a. pollution from direct (dry/wet) deposition, b. pollution of Sava river.
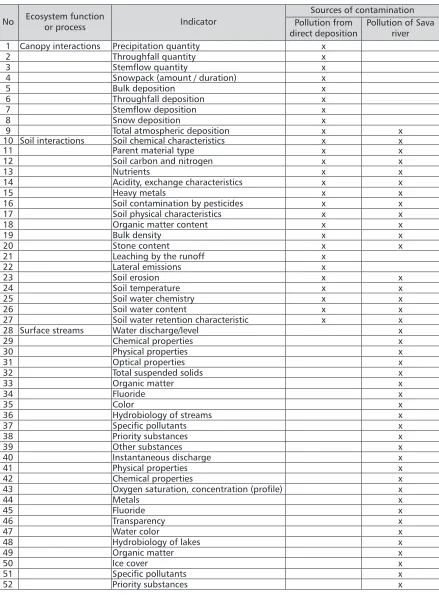
According to the specifics of drinking water supply and urban forest 52 core indicators have been selected (Table 2). Each core indicator was marked according to the indication of the two main sources of contamination. 17 of core indicators may indicate water purification services according to both main sources of contamination: pollution from direct deposition and pollution of Sava river.
The purpose of selected indicators for canopy interactions is to quantify the input of energy, nutrients and water to the urban forest area by deposition. In forests part of the precipitation falls through gaps in the canopy without being intercepted and part is intercepted during its passage through the canopy. Together the parts are called (crown) throughfall. The part of the precipitation running down the tree trunk is called stemflow. Together, throughfall and stemflow are called total throughfall or stand precipitation and enables us to estimate the total deposition input to the soil under the forest canopy and forest vegetation. In forested areas, throughfall and bulk deposition from an open area are both needed to estimate the total deposition input to forested sites. This is done by comparing total throughfall with bulk deposition from an open area, to assess canopy interception and the interaction and internal cycling of nutrients. For some types of forest stands, also stemflow amount is important. At sites frequently influenced by fog and clouds, a significant fraction of the deposition input may deposit by fog (occult deposition) and throughfall sampling may serve as an indicator of the amount of the fog deposition.
Indicators for soil interactions aim at describing cause/effect relationships within forest soils and soil water. Soil water percolating through the soil dissolves and weathers minerals, releasing base cations for nutrient uptake by microbes and roots alike, for seepage to deeper layers and ground water, and ultimately for outflow to rivers and lakes. Soil water is intimately coupled with the chemical and biological processes in the upper soil layers and is sensitive to both acidification and nitrogen pollution.
Surface streams (or runoff) are the main output of solutes from a catchment area. The amount of element loss can be calculated by measuring the runoff and analyzing the concentrations of the runoff water [40]. The biotic composition and biomass of streams react differently to acidification due to different species tolerance. Therefore hydrobiology of streams is considered a good indicator of acidification and the frequency of acid shocks to stream water, however universal indicators cannot be identified due to differences in geographical distribution [40].
No Ecosystem function or process Indicator
Sources of contamination Pollution from
direct deposition Pollution of Sava river
1 Canopy interactions Precipitation quantity x
2 Throughfall quantity x
3 Stemflow quantity x
4 Snowpack (amount / duration) x
5 Bulk deposition x
6 Throughfall deposition x
7 Stemflow deposition x
8 Snow deposition x
9 Total atmospheric deposition x x
10 Soil interactions Soil chemical characteristics x x
11 Parent material type x x
12 Soil carbon and nitrogen x x
13 Nutrients x x
14 Acidity, exchange characteristics x x
15 Heavy metals x x
16 Soil contamination by pesticides x x
17 Soil physical characteristics x x
18 Organic matter content x x
19 Bulk density x x
20 Stone content x x
21 Leaching by the runoff x
22 Lateral emissions x
23 Soil erosion x x
24 Soil temperature x x
25 Soil water chemistry x x
26 Soil water content x x
27 Soil water retention characteristic x x
28 Surface streams Water discharge/level x
29 Chemical properties x
30 Physical properties x
31 Optical properties x
32 Total suspended solids x
33 Organic matter x
34 Fluoride x
35 Color x
36 Hydrobiology of streams x
37 Specific pollutants x
38 Priority substances x
39 Other substances x
40 Instantaneous discharge x
41 Physical properties x
42 Chemical properties x
43 Oxygen saturation, concentration (profile) x
44 Metals x
45 Fluoride x
46 Transparency x
47 Water color x
48 Hydrobiology of lakes x
49 Organic matter x
50 Ice cover x
51 Specific pollutants x
[image:8.558.61.500.107.708.2]52 Priority substances x
TABLE 2
Pollution from direct deposition
Direct infiltration of precipitation makes the aqui-fer vulnerable to contamination by pollutants flushed through soils [44]. Deposition interception of forest canopies and buffering capacity of forest soils, e.g. the ability of soils to resist change [22], are therefore of ma-jor importance.
Infiltration of pollutants to the Sava river
Agricultural activities with excessive use of fertilizers and pesticides as well as other human activities (e.g. leakage from the sewer system, road accidents, indus-trial zones with insufficient emission control, expansion of existing physical planning areas, illegal waste deposit sites, excavation of gravel, etc.) and the resulting decreas-ing depth of the unsaturated zones may be a serious threat towards a safe drinking water supply [45]. Most frequent source of pesticides in freshwaters is neighbor-ing agricultural land [5]. Strips of riverside vegetation can reduce or even prevent the input of pesticides into freshwaters significantly (ibid.). Living and detrital bio-mass in a riparian buffer zones ameliorate diffuse-source pollution originating from adjacent landscapes [46]. Pol-lution removal is mediated by sediment trapping and uptake of nitrogen by plants and by denitrification by microbial communities in root zones using organic mat-ter and root exudates as energy sources (ibid.).DISCUSSION
Recent years have seen increasing focus on many environmental services provided by urban forests, such as flood regulation [47], moderation of the ur-ban climate [48] and air pollution reduction [49]. Pro-visioning of fresh water, water purification, regulat-ing water runoff and erosion in urban and peri-urban forests are important ecosystem services, closely re-lated to human well-being [42].
A review of seven different monitoring actions, assessing water quality variables, showed that a large number of different environmental indicators could be applied to monitor drinking water protection services of urban and peri-urban forests. As stated by Segnestam [8], two types of indicators are needed to quantify the capacity of urban forests: (1) State indicators describing which ecosystem function is providing a service and (2) How much of that service can be used in a sustainable way. This information could provide decision-makers with an evaluation tool for establishing baselines and developing management and maintenance strategies aimed at conserving urban and peri-urban forests (ibid.).
According to the specifics of drinking water supply and urban forests in Ljubljana the core set of
indicators reflects urban forest ecosystem functions or processes, related to local (wet / dry) deposition and river Sava quality. The highlighted ecosystem functions or processes include [35]:
• The canopy interactions and soil interactions, referring to the storage capacity of the forest ecosystem;
• Nutrient regulation, the capacity of the forest ecosystem to carry out the (re) cycling of nutrients; • Water purification, referring to the capacity of the
forest ecosystem to purify water.
Canopy interactions refer to the deposition of pol-lutants to the ecosystems by precipitation, which is as-sumed to be a major factor affecting the natural pro-cesses in the environment, with particular emphasis on the acidifying compounds and on nutrients [40]. Selected indicators for soil interactions 1) represent soil quality per se (e.g. the acidity, carbon and N status of the soil); 2) allow to estimate soil chemistry pools/ amounts (e.g. bulk density, stone content) and 3) refer to sulphate adsorption, nitrification rates and soil wa-ter retention characwa-teristics [40]. In urban forest soils special emphasis should be given to heavy metal accu-mulation in soil and soil contamination by pesticides [15]. Surface streams and lakes as intermediate pools of element fluxes are important bodies for compound changes, which in turn might cause reactions in their hydrobiological nature. If surface streams or lakes ex-ist within an urban forest area, their water chemex-istry should be monitored for the understanding of the effect of internal fluxes [41]. Groundwater is present everywhere and is, hence, one of the output media for elements in the terrestrial ecosystem [40].
Acknowledgments
This study was supported by EMONFUR project: Establishing a Monitoring Network to assess lowland Forest and Urban plantation status in Lombardy Region and Slovenian (Life+10 ENV/IT/000399) and
the Program group Forest biology, ecology and technology (0404-501), financed by the Ministry of Education, Science, Culture and Sport, Republic of Slovenia. We thank all reviewers for helpful comments on this manuscript.
1. VON BURGER H 1954 Einfluss des Waldes auf den Stand der Gewaesser. V. Mitteilung. Der Wasserhaushalt im Sperbel- und Rappengraben von 1942/1943 bis 1951/52. Mitteilungen der Schweizerischen Anstalt fuer forstliche Versuchswesen XXXI (1): 9-58
2. VON BURGER H 1954 Einfluss des Waldes auf den Stand der Gewaesser. II. Mitteilung. Der Wasserhaushalt im Sperbel- und Rappengraben von 1915/16 bis 1926/27. Mitteilungen der Schweizerischen Anstalt fuer forstliche Versuchswesen XVIII (2): 311-416
3. VENY E S 1986 Forest Harvesting and Water: The Lake States Experience. Water Resour Bull 22 (6): 1039-1047 4. PRYBOLOTNA N 2006 Content of the sediment in runoff in the small Beskid’s watershed. In: Boczon A (ed) Assesing of soil and water conditions in forests. Forest Research Institute, Center for Exellence PROFOREST for Protection of Forest Resources in Central Europe, Warsaw, pp 141-145
5. BINKLEY D, MACDONALD L H 1994 Forests as non-point sources of pollution, and effectiveness of Best Management Practices. National Council for Air and Stream Improvement, New York,p 57
6. CHANG M 2003 Forest hydrology: an introduction to water and forests. CRC Press LLC,p 392
7. KONIJNENDIJK C C, RICARD R M, KENNEY A, RANDRUP T B 2006 Defining urban forestry – A comparative perspective of North America and Europe. Urban For Urban Gree 4 (3-4): 93-103
8. DOBBS C, ESCOBEDO F J, ZIPPERER W C 2011 A framework for developing urban forest ecosystem services and goods indicators. Landscape Urban Plan 99 (3-4): 196-206
9. GALLO E L, LOHSE K A, BROOKS P D, MCINTOSH J C, MEIXNER T, MCLAIN J E T 2012 Quantifying the effects of stream channels on storm water quality in a semi-arid urban environment. J Hydrol 470-471: 98-110 10. LE PAPE P, AYRAULT S, QUANTIN C 2012 Trace element
behavior and partition versus urbanization gradient in an urban river (Orge River, France). J Hydrol 472-473: 99-110
11. MAES J, EGOH B, WILLEMEN L, LIQUETE C, VIHERVAARA P, SCHÄGNER J P, GRIZZETTI B, DRAKOU E G, NOTTE A L, ZULIAN G, BOURAOUI F, LUISA PARACCHINI M, BRAAT L, BIDOGLIO G 2012 Mapping ecosystem services for policy support and decision making in the European Union. Ecosystem Services 1 (1): 31-39
12. VULETIĆ D, POSAVEC S, KRAJTER S, PALADINIĆ E 2010
Payments for environmental services (PES) in Croatia. SEEFOR 1 (2): 51- 98
13. GLÜCK P, AVDIBEGOVIĆ M, ČABARAVDIĆ A, NONIĆ D, PETROVIĆ N, POSAVEC S, STOJANOVSKA M 2010
The preconditions for the formation of private forest owners’ interest associations in the Western Balkan Region. Forest Policy Econ 12 (4): 250-263
14. BEALEY W J, MCDONALD A G, NEMITZ E, DONOVAN R, DRAGOSITS U, DUFFY T R, FOWLER D 2007 Estimating the reduction of urban PM10 concentrations by trees within an environmental information system for planners. J Environ Manage 85 (1): 44-58
15. KRISTENSEN P, PIRC-VELKAVRH A 2003 EEA core set of indicators Revised version April 2003. Adopted version for ECCAA countries May 2003. p 79
16. OECD 2008 Key Environmental Indicators. p 38 17. JØRGENSEN S E, COSTANZA R, XU F L EDS 2005
Handook of ecological indicators for assessment of ecosystem health. CRC Press, Boca Raton, Florida, p 439 18. MÜLLER F, BURKHARD B 2012 The indicator side of
ecosystem services. Ecosystem Services 1 (1): 26-30 19. SEGNESTAM L 2002 Indicators of Environment and
Sustainable Development. Theories and Practical Experience. The International Bank for Reconstruction and Development / THE WORLD BANK ENVIRONMENT DEPARTMENT,p
20. MEKINDA-MAJARON T 1995 Klimatografija Slovenije. Temperatura zraka: obdobje 1961-1990. Hidrometeo-rološki zavod Republike Slovenije, Ljubljana,p 356 21. ZUPANČIČ B 1995 Klimatografija Slovenije. Količina
padavin: obdobje 1961-1990. Hidrometeorološki zavod Republike Slovenije, Ljubljana,p 366
22. URBANČIČ M, KOBAL M, FERREIRA A, SIMONČIČ P 2010 Gozdna tla Mestne občine Ljubljana. Gozdarski vestnik 68 (5-6): 292-300
23. KUTNAR L, KOBLER A 2010 Prostorska razporeditev
gozdov na območju Ljubljane v prihodnosti. Gozdarski vestnik 68 (5-6): 276-281
24. TAVČAR M 2010 Gospodarjenje z gozdovi v Mestni občini Ljubljana. Gozdarski vestnik 68 (5-6): 267-275 25. 1993, 1998, 2007, 2010 Zakon o gozdovih. Ur.l. RS št.
30/1993, št. 13/1998 Odl.US: 53/95, 24/1999 Skl.US: U-I-51/95, 56/1999-ZON (31/2000 popr.), 67/2002, 110/2002-ZGO-1, 112/2006 Odl.US: U-I-40/06-10, 115/2006, 110/2007, 61/2010 Odl.US: U-I-77/08-14, 106/2010 26. JAZBINŠEK SRŠEN N, JANKOVIČ M, STROJIN BOŽIČ Z,
27. JURC M 2010 Nekatere škodljive domače in tujerodne žuželke v gozdovih na območju Ljubljane. Gozdarski vestnik 68 (5-6): 321-329
28. URBANC J, PRESTOR J, JANŽA M, RIKANOVIČ R, STROJAN M, PRAPROTNIK B, ŽELEZNIK B, ŽLEBNIK L 2001 Hidrogeološke raziskave izvirov na območju Ljubljanskega polja in Barja za določitev razpoložljivih
in obnovljivih vodnih virov mesta Ljubljane. Ljubljana, Geološki zavod Slovenije, p 27
29. JAMNIK B, JANŽA M 2012 Layman’s report. INCOME:
Professional Support for Sustainable Management of Ljubljana’s Water Resources. Ljubljana, JP Vodovod-Kanalizacija d.o.o, Geological Survey of Slovenia, Anton Melik Geographical Institute SRC SASA, Technische Universität Darmstadt, Fugro Consult GmbH, Environmental Agency of the Republic of Slovenia, p 16
30. VILHAR U, PLANINŠEK Š, FERREIRA A 2010 Vpliv gozdov
na kakovost virov pitne vode Mestne občine Ljubljana.
Influence of forests on drinking water resources quality in the Municipality of Ljubljana. Gozdarski vestnik 68 (5-6): 310-320
31. 2004, 2006, 2012 Uredba o vodovarstvenem območju
za vodno telo vodonosnika Ljubljanskega polja. Ur. l. RS, št. 120/04, 7/06, 1/12
32. 2007, 2008, 2012 Uredba o vodovarstvenem območju
za vodno telo vodonosnikov Ljubljanskega Barja in okolice Ljubljane. Ur. l. RS, št. 115/07, 9/08, 65/12 33. 2000 Directive of the European Parliament and of the
Council establishing a framework for the Community action in the field of water policy. Water Frame Directive 2000/60/EC
34. WMO 2008 Guide to Hydrological Practices. Hydrology - From Measurement to Hydrological Information. World Meteorological Organization, p 296
35. BURKHARD B 2011 Conceptual framework for indicator assignment and selection for LTER-sites. EnvEurope project, p 54
36. LORENZ M 2010 Objectives, Strategy and Implementation of ICP Forests. Manual Part I. Manual on methods and criteria for harmonized sampling, assessment, monitoring and analysis of the effects of air pollution on forests. United Nations Economic Commission for Europe Convention on Long-range Transboundary Air Pollution, ICP Forests, Hamburg, p 21
37. CLARKE N, ŽLINDRA D, ULRICH E, MOSELLO R, DEROME
J, DEROME K, KÖNIG N, LÖVBLAD G, DRAAIJERS G P J, HANSEN K, THIMONIER A, WALDNER P 2010 Sampling and Analysis of Deposition. Manual Part XIV. Manual on methods and criteria for harmonized sampling, assessment, monitoring and analysis of the effects of air pollution on forests. United Nations Economic Commission for Europe Convention on Long-range Transboundary Air Pollution, ICP Forests, Hamburg, Part XIV, p 66
38. COOLS N, DE VOS B 2010 Sampling and Analysis of Soil. Manual Part X. Manual on methods and criteria for harmonized sampling, assessment, monitoring and analysis of the effects of air pollution on forests. United Nations Economic Commission for Europe Convention on Long-range Transboundary Air Pollution, ICP Forests, Hamburg, p 208
39. NIEMINEN T 2011 Soil Solution Collection and Analysis. Manual Part XI. Manual on methods and criteria for harmonized sampling, assessment, monitoring and analysis of the effects of air pollution on forests. United Nations Economic Commission for Europe Convention on Long-range Transboundary Air Pollution, ICP Forests, Hamburg: p 30
40. ICP IM 2010 Manual for Integrated Monitoring. ICP IM Programme Centre, Finnish Environment Institute, Helsinki, Finland United Nations Economic Commission for Europe Convention on Long-range Transboundary Air Pollution, International Cooperative Programme on Integrated Monitoring of Air Pollution Effects on Ecosystems:
41. ENGLAND, WALES 2010 The River Basin Districts Typology, Standards and Groundwater threshold values (Water Framework Directive) (England and Wales) Directions 2010
42. MEA 2005 Ecosystems and Human Well-Being: Synthesis. Washington, DC, p 281
43. SHEAR H, BERTAM P, FORST C, HORVATIN P 2005 Development and Application of Ecosystem Health Indicators in the Nort American Great Lakes Basin. Handook of ecological indicators for assessment of ecosystem health. Jørgensen S E, Costanza R, Xu F L. Boca Raton, Florida CRC Press, pp 105-126
44. JAMNIK B, ŽELEZNIK B B, URBANC J 2003 Diffuse
pollution of water protection zones in Ljubljana, Slovenia. Diffuse Pollution Conference, 7A Groundwater, Dublin, p 5
45. VIŽINTIN G, SOUVENT P, VESELIČ M, ČENCUR CURK B
2009 Determination of urban groundwater pollution in alluvial aquifer using linked process models considering urban water cycle. J Hydrol 377 (3-4): 261-273 46. RHEINHARDT R, BRINSON M, MEYER G, MILLER K 2012
Integrating forest biomass and distance from channel to develop an indicator of riparian condition. Ecol Indic 23: 46-55
47. GUO Z, XIAO X, LI D 2000 An Assessment of Ecosystem Services: Water Flow Regulation and Hydroelectric Power Production. Ecol Appl 10 (3): 925-936
48. ARMSON D, STRINGER P, ENNOS A R 2012 The effect of tree shade and grass on surface and globe temperatures in an urban area. Urban For Urban Gree 11 (3): 245-255 49. MCDONALD A G, BEALEY W J, FOWLER D, DRAGOSITS