635
©IJRASET: All Rights are Reserved
Prediction of Bio-Activity of some NNRTIs
Derivatives; SAR Study using Molecular Modeling
Kapil Tiwari1, P.K. Saxena2
1, 2
Department of Chemistry, Atarra P.G. College Atarra Banda U.P. INDIA
Abstract: The work describes QSAR and SAR studies on the TIBO derivatives as non-molecular reserve transcriptase inhibitor of HIV-1using the 2D-topological, physicochemical and hydrophobic parameters along with the indicator parameters.The set of 20compounds. Application of multiple linear regression analysis indicated that the combination of adhoc molecular descriptors and indicator parameters yielded a statically significant model for activity iog1/c (50%of effective concentration for inhabitation of reverse transcriptase of HIV.)
Keywords: LogP QSAR, anti HIV-1 cytotoxic concentration, NNRTI-1, physicochemical descriptors.
I. INTRODUCTION
Many structure-based techniques of drug discovery and development have evolved in the past 20 years during the search for therapeutically useful agents in the treatment of acquired immunodeficiency syndrome (AIDS)3.
RT catalyses the transcription of the HIV-encoded single-stranded RNA into double-stranded DNA. Many of the currently approved anti-AIDS agents are potent inhibitors of retroviral RT. The NNRTI, as opposed to the nucleoside analogues, constitute a number of different, structurally unrelated, classes of compounds that are highly selective against HIV-1 RT and are targeted at a non-substrate binding site of this enzyme. The TIBO7 were discovered to be active in cell culture before their target was identified. In the present work, a quantitative structure activity study has been performed to develop mathematical relationship between structural descriptors and biological activity log1/C (cytotoxic concentration) of 19 TIBO derivatives. (Shown in Table1.)
N
H
N
N
Z
R
X'
X
Figure 1 Parent structure of TIBO derivative used in present study
A. Experimental and Methodology
The cytotoxic concentration of the compound leading to 50% effect has been measured and expressed as log1/C in mol/l. Three separate descriptors were used namely, non-conventional physicochemical properties, classical physicochemical properties and hydrophobic parameter logP (Octanol/Water partition coefficient). Non-conventional physicochemical descriptors7 used in present study are calculated using Hyperchem7 software and presented in Table2. All classical physicochemical properties are calculated using ACD Chemsketch software and presented in Table3. The multiple linear regression analysis is carried out for obtaining QSAR model.
636
[image:2.612.92.523.89.371.2]©IJRASET: All Rights are Reserved
Table 1 Substituents and Biological Activity log1/C(Observed) of TIBO Derivatives used in present study.
S.no. X Z R X’ Obs.log1/C
1 H O CH2CH=CH2 5-Me 3.21
2 H O CH2C(Me)=CH2 5-Me 3.96
3 H O CH2CH=CMe2 5-Me 3.33
4 9-Cl O CH2C(Me)=CH2 5-Me 4.77
5 9-Me O CH2CH=(C2H5)2 5-Me 4.70
6 9-Cl O CH2CH=CMe2 5-Me 4.66
7 H S CH2CH=CMe2 5-Me 3.26
8 7-Me S CH2CH=CMe2 5-Me 4.13
9 H S C3H7 5-Me 3.25
10 9-Cl S CH2CH=CMe2 5-Me 4.47
11 9-Cl S CH2CH2C3H5 5-Me 4.44
12 9-Cl S CH2C1H7 5-Me 4.55
13 9-Cl S CH2CH=C(C2H5)2 5-Me 4.92
14 9-C1 S CH2C4H7 5-Me 4.72
15 9-Cl S CH2CH(Me)=CH2 4-Me 4.62
16 9,10-di-Cl S CH2CH=CMe2 5-Me 4.35
17 8-Cl S CH2CH=CMe2 5-Me 3.85
18 8-Cl S CH2CH=C(C2H5)2 5-Me 4.92
19 8-Br S CH2C=CMe2 5-Me 4.28
20 8-Me S CH2CH=CMe2 5-Me 4.10
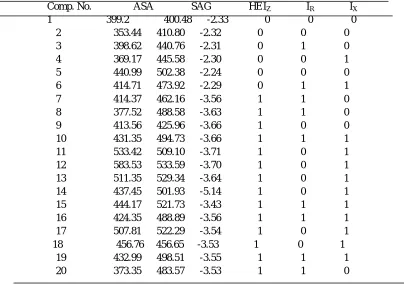
Table 2 Non-conventional physicochemical parameters and indicator parameters for subset of TIBO derivatives used in present study.
Comp. No. ASA SAG HE IZ IR IX
1 399.2 400.48 -2.33 0 0 0
2 353.44 410.80 -2.32 0 0 0
3 398.62 440.76 -2.31 0 1 0
4 369.17 445.58 -2.30 0 0 1
5 440.99 502.38 -2.24 0 0 0
6 414.71 473.92 -2.29 0 1 1
7 414.37 462.16 -3.56 1 1 0
8 377.52 488.58 -3.63 1 1 0
9 413.56 425.96 -3.66 1 0 0
10 431.35 494.73 -3.66 1 1 1
11 533.42 509.10 -3.71 1 0 1
12 583.53 533.59 -3.70 1 0 1
13 511.35 529.34 -3.64 1 0 1
14 437.45 501.93 -5.14 1 0 1
15 444.17 521.73 -3.43 1 1 1
16 424.35 488.89 -3.56 1 1 1
17 507.81 522.29 -3.54 1 0 1
18 456.76 456.65 -3.53 1 0 1
19 432.99 498.51 -3.55 1 1 1
20 373.35 483.57 -3.53 1 1 0
*ASA = Approximate surface area, SAG = Surface area grid, HE = Hydration energy IZ = 1 if S atom at Z position, IR = 1 if Acyclic structure at R position
[image:2.612.111.515.406.690.2]637
[image:3.612.100.524.89.374.2]©IJRASET: All Rights are Reserved
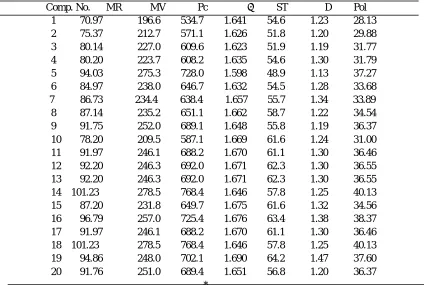
Table 3 Classical physicochemical properties for estimation of log1/C of TIBO derivatives. Comp. No. MR MV Pc η ST D Pol
1 70.97 196.6 534.7 1.641 54.6 1.23 28.13
2 75.37 212.7 571.1 1.626 51.8 1.20 29.88
3 80.14 227.0 609.6 1.623 51.9 1.19 31.77
4 80.20 223.7 608.2 1.635 54.6 1.30 31.79
5 94.03 275.3 728.0 1.598 48.9 1.13 37.27
6 84.97 238.0 646.7 1.632 54.5 1.28 33.68
7 86.73 234.4 638.4 1.657 55.7 1.34 33.89
8 87.14 235.2 651.1 1.662 58.7 1.22 34.54
9 91.75 252.0 689.1 1.648 55.8 1.19 36.37
10 78.20 209.5 587.1 1.669 61.6 1.24 31.00 11 91.97 246.1 688.2 1.670 61.1 1.30 36.46 12 92.20 246.3 692.0 1.671 62.3 1.30 36.55 13 92.20 246.3 692.0 1.671 62.3 1.30 36.55 14 101.23 278.5 768.4 1.646 57.8 1.25 40.13 15 87.20 231.8 649.7 1.675 61.6 1.32 34.56 16 96.79 257.0 725.4 1.676 63.4 1.38 38.37 17 91.97 246.1 688.2 1.670 61.1 1.30 36.46 18 101.23 278.5 768.4 1.646 57.8 1.25 40.13 19 94.86 248.0 702.1 1.690 64.2 1.47 37.60 20 91.76 251.0 689.4 1.651 56.8 1.20 36.37
*
[image:3.612.210.396.426.716.2]MR = Molar Refractivity, ST = Surface Tension, D = Density, Pol = Polarizability
Table 4 logP values of subset of TIBO derivatives for calculation of log1/C used in present study. Comp. No. logP
1. 0.456
2. 1.033
3. 1.753
4. 1.157
5. 2.986
6. 2.400
7. 1.738
8. 2.111
9. 0.876
10. 2.430 11. 2.260 12. 2.260 13. 3.244 14. 1.916 15. 3.655 16. 2.430 17. 3.244
18 2.434
638
©IJRASET: All Rights are Reserved
Table 5 Correlation matrix of non-conventional physicochemical properties, indicator parameter and biological activity of TIBO derivatives.
log 1/C ASA SAG HE IZ IR IX
log1/C 1.00000 ASA 0.44911 1.00000
SAG 0.71339 .72380 1.00000 HE - 0.16775 -.39684 -.54584 1.00000
IZ 0.11294 .45007 .61578 - .88533 1.00000
IR - 0.25432 - .36340 .07098 - .01476 .19096 1.00000
IX 0.69191 .55973 .63682 - .36765 .33796 - .04495 1.00000
Table 6 Correlation matrix of classical physicochemical properties and biological activity of TIBO derivatives. MR MV Pc η ST D Pol IZ IR IX log1/C
MR 1.000 MV 0.952 1.000 Pc 0.993 0.978 1.000
η 0.287 -0.016 0.185 1.000 ST 0.390 0.098 0.299 0.979 1.000 D 0.271 0.035 0.196 0.770 0.780 1.000 Pol 1.000 0.952 0.993 0.287 0.390 0.271 1.000
IZ 0.637 0.412 0.564 0.808 0.825 0.399 0.637 1.000
IR 0.174 0.104 0.134 0.226 0.148 0.193 0.174 0.190 1.000
IX 0.517 0.379 0.486 0.487 0.580 0.748 0.517 0.337 -0.044 1.000
log1/C 0.641 0.681 0.668 -0.046 0.067 0.256 0.641 0.112 -0.254 0.691 1.000
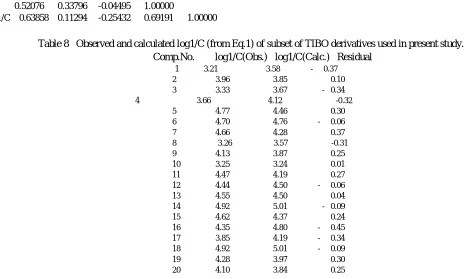
Table 7 Correlation matrix of logP, indicator parameter and biological activity of TIBO derivatives. logP IZ IR IX log1/C
logP 1.00000
IZ 0.42597 1.00000
IR 0.26299 0.19096 1.00000
IX 0.52076 0.33796 -0.04495 1.00000
[image:4.612.55.528.444.723.2]log1/C 0.63858 0.11294 -0.25432 0.69191 1.00000
Table 8 Observed and calculated log1/C (from Eq.1) of subset of TIBO derivatives used in present study. Comp.No. log1/C(Obs.) log1/C(Calc.) Residual
1 3.21 3.58 - 0.37
2 3.96 3.85 0.10
3 3.33 3.67 - 0.34
4 3.66 4.12 -0.32
5 4.77 4.46 0.30
6 4.70 4.76 - 0.06
7 4.66 4.28 0.37
8 3.26 3.57 -0.31
9 4.13 3.87 0.25
10 3.25 3.24 0.01
11 4.47 4.19 0.27
12 4.44 4.50 - 0.06
13 4.55 4.50 0.04
14 4.92 5.01 - 0.09
15 4.62 4.37 0.24
16 4.35 4.80 - 0.45
17 3.85 4.19 - 0.34
18 4.92 5.01 - 0.09
19 4.28 3.97 0.30
639
[image:5.612.202.429.97.367.2]©IJRASET: All Rights are Reserved
Table 9 Observed and calculated log1/C (from Eq.2) of subset of TIBO derivatives used in present study. Comp.No. log1/C(Obs.) log1/C(Calc.) Residual
1 3.21 3.33 -0.12
2 3.96 3.66 0.29
3 3.33 3.82 -0.49
4 4.77 4.55 0.21
5 4.70 4.61 0.08
6 4.66 4.71 - 0.05
7 3.26 3.53 - 0.27
8 4.13 3.87 0.25
9 3.25 3.13 0.11
10 4.47 4.42 0.04
11 4.44 4.35 0.08
12 4.55 4.35 0.19
13 4.92 4.93 - 0.01
14 4.62 4.25 0.36
15 4.35 4.39 - 0.04
16 3.85 4.42 - 0.57
17 4.92 4.93 -0.01
18 4.28 4.27 0.01
19 4.10 3.80 0.30
20 4.16 3.82 0.31
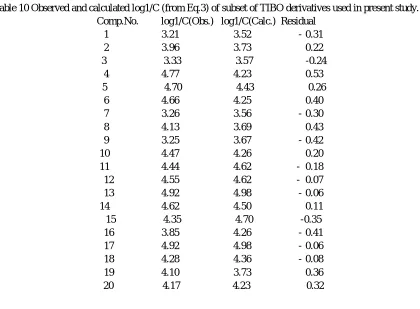
Table 10 Observed and calculated log1/C (from Eq.3) of subset of TIBO derivatives used in present study. Comp.No. log1/C(Obs.) log1/C(Calc.) Residual
1 3.21 3.52 - 0.31
2 3.96 3.73 0.22
3 3.33 3.57 -0.24
4 4.77 4.23 0.53
5 4.70 4.43 0.26
6 4.66 4.25 0.40
7 3.26 3.56 - 0.30
8 4.13 3.69 0.43
9 3.25 3.67 - 0.42
10 4.47 4.26 0.20
11 4.44 4.62 - 0.18
12 4.55 4.62 - 0.07
13 4.92 4.98 - 0.06
14 4.62 4.50 0.11
15 4.35 4.70 -0.35
16 3.85 4.26 - 0.41
17 4.92 4.98 - 0.06
18 4.28 4.36 - 0.08
19 4.10 3.73 0.36
[image:5.612.100.520.378.687.2]640
©IJRASET: All Rights are Reserved
3 3.5 4 4.5 5 5.5
3 3.5 4 4.5 5 5.5
Obs. log1/C
C
a
lc
.
lo
g
1
/C
Figure 2 Graph obtained between Obs. log1/C and Calc. log1/C from eq. 2
II.RESULTS AND DISCUSSION
As mentioned in introduction, this set of TIBO derivatives contains 19 compounds. The non-conventional physicochemical properties, Classical physicochemical properties and logP are chosen as previously for the prediction of log1/C (Cytotoxicity). Table5 in form of correlation matrix9 shows the correlation between the Approximate Surface Area (ASA), Surface Area Grid (SAG), Hydration energy (HE) and log1/C but individually they are poorly correlated with the biological activity (log1/C)10. Similarly, the classical physicochemical properties are poorly correlated with observed biological activity individually, but good correlation exist between MR, MV, Pc and Pol shown in form of correlation matrix in Table6. Table7 in form of correlation matrix shows that the good correlation (r = 0.6385) exist between logP and biological activity (log1/C) individually. All those correlations resulting in low value of R (<0.50) are not considered being statistically insignificant. Not a single univariate correlation of non-conventional physicochemical descriptors/ classical physicochemical properties11 is able to describe the structure activity relationship in quantitative manner.
In case of non-conventional physicochemical descriptors bivariate correlation of 16 combinations are tested and the regression coefficient is little higher but not sufficient to explain structure activity relationship quantitatively.
The best model obtained from above variables is:
log1/C = 0.0115(±0.0029)SAG - 0.5981(±0.1970)IZ + 0.4036(±0.1895)IX – 1.1528 (1) n = 19, Se = 0.3133, R = 0.8687, R2A = 0.7056, F = 15.379
In order to confirms our finding we have estimated the log1/C values from the best suited model and compared them with the observed values. Both, observed and calculated biological activities are presented in TableV-8 and such correlations are graphically presented in Figure V-2. The best model obtained from above variables is:
log1/C = 0.0646(±0.017)MV – 0.0197(±0.0063)Pc + 0.9094(±0.1757)IX + 1.1712 (2) n = 19, Se = 0.2772, R = 0.8988, R2A = 0.7695, F = 21.028
In order to confirms our finding we have estimated the log1/C values from the best suited model and compared them with the observed values. Both, observed and calculated biological activities (log1/C) are presented in Table9.
Both, observed and calculated biological activities are presented in Table 5-10.
The equations suggest that the indicator parameter IZS and IX have positive correlation coefficient and indicator parameter IR shows the negative correlation coefficient. Comparison of the magnitude of various indicator parameters shows the domination of presence of sulpher atom at X position. Positive coefficient of indicator parameter IX also exhibits the increase in cytotoxicity with the presence of Sulpher atom at X position.
III. CONCLUSION
641
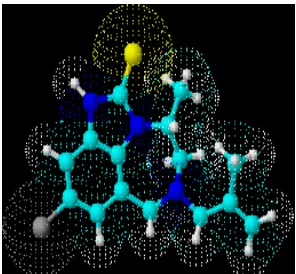
[image:7.612.233.381.77.214.2]©IJRASET: All Rights are Reserved
Figure 4. Opt. Structure of Comp. 17
REFERENCES
[1] ACD-Lab software for calculating the referred physicochemical parameters; Chemsketh 3.O, www.acdlabs.com [2] Hyperchem-7 software for calculating the molecular modeling parameters; www.hyper.com
[3] Garg R, Gupta S.P, Gao H, Mekapati S.B, Debnath A.K and Hanch C., Chem Rev. 1999, 99, 3525.. [4] Zhou Z, Madura JD, J Chem Inf Comput Sci. 2004 Nov-Dec;44(6):2167-78
[5] Chaterjee,S.; Hadi,A.S.; Price,B Regression Analysis by Examples, 3rd ed. Wiley VCH: New york, 2000
[6] Chaterjee,S.; Hadi,A.S.; Price,B Regression Analysis by Examples, 3rd ed. Wiley VCH: New york, 2000 [7] Abhilash Thakur, Mamta Thakur, Nitika.Kakani, Ashok. Joshi and Ashok Gupta, ARKIVOC, 2004, 10(1), 36. [8] Bharate SS, Kumar , Vishwakarma RA, Comb Chem High Throughput Screen. 2016;19(6):461-9.
[9] K. Roy et al., A Primer on QSAR/QSPR Modeling, SpringerBriefs in Molecular Science, DOI 10.1007/978-3-319-17281-1_2