Performance Evaluation of AODV, DSR and ZRP
Protocols for MANETs
Manjunatha D1, S. Ravishankar2
1
Department of Electronics, University College of Science, Tumkur University, Tumkur 2
Department of Electronics and Communication, R V College of Engineering, Bangalore
Abstract: Mobile ad-hoc network (MANET) consists of wireless mobile nodes and they communicate with each other without any centralized control. The node mobility in such networks causes frequent changes in network topology. Hence, dynamic and reliable routing protocols are needed in MANETs. In this paper, performance evaluation studies of AODV, DSR and ZRP routing protocols are carried out using QualNet Network simulator. The performance metrics such as throughput, packet delivery ratio, total data bytes received, end-to- end delay and jitter are considered for simulation study.
Keywords: MANET, AODV, DSR, ZRP, QualNet
I. INTRODUCTION
Mobile ad-hoc network (MANET) is a network which contains mobile nodes. The nodes communicate with each other using wireless links. As there is no pre-existing infrastructure, each participating node will function as a host as well as a router. When the nodes are in the transmission range with each other, they can communicate directly; otherwise they depend on the neighbouring nodes to rely the messages [1]. The node mobility causes link breakages and network topology changes continuously and hence link re-establishment must be done very quickly. Therefore, dynamic and reliable routing protocols are needed in MANETs [2]. In this work, simulation studies of AODV, DSR and ZRP routing protocols have been done and their performance is compared.
II. ROUTINGPROTOCOLS
The routing protocols paly vital role in route establishment and they must adapt quickly to the dynamic network topology. Ad-hoc routing protocols are categorized into following three types. They are, proactive, reactive and hybrid routing protocols.
Proactive routing protocols are also called as table driven routing protocols in which all the route information is maintained in the routing table. Routing tables contain updated list of destinations and their routes by exchanging their routing information time to time with nearby nodes [3]. The main drawback of proactive routing protocol is that every node maintains an updated table. Destination-Sequenced Distance-Vector Routing Protocol (DSDV) [4] and Optimized Link-State Routing (OLSR) [5] are proactive routing protocols.
In reactive or on demand routing protocols, all the nodes need not maintain up-to-date routing information. When a node wishes to send a packet to the destination node, the protocol initiates route search process in an on-demand manner and creates the link in order to send and receive the packets. Adhoc On Demand Distance Vector Routing (AODV) [6], Dynamic Source Routing (DSR) [7-8] and Temporally Ordered Routing Algorithm (TORA) [9] are the examples of reactive routing protocols.
Hybrid routing protocols have the merits of both reactive and proactive approaches. ZRP (Zonal Routing Protocol) is the example of hybrid routing protocol. In ZRP [10], the proactive routing approach is used inside the routing zones as IntrAzone Routing Protocol (IARP) and the reactive routing approach is used between the routing zones as IntErzone Routing Protocol (IERP).
III. RELATEDWORK
analyzed using the metrics such as throughput, end-to-end delay and network load by simulating multimedia (video conferencing) traffic. Simulation results show that proactive protocol OLSR which has readily available routing paths performs better than AODV and TORA.
IV. SIMULATIONENVIRONMENT
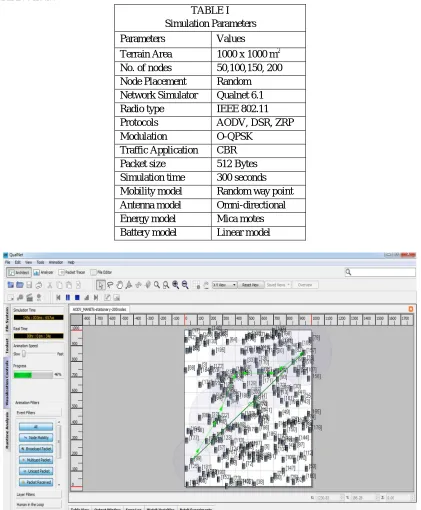
[image:2.612.96.517.201.711.2]QualNet 6.1 Network simulator [15] has been used to evaluate the performance of routing protocols AODV, DSR and ZRP for IEEE 802.11b standard. The simulations are carried out for networks with varying density of 50, 100, 150 and 200. Simulation time was set at 300 seconds and CBR (Constant Bit Rate) application was used that maintains the same bit rate throughout the process. Simulations parameters configured for the scenario is shown in the Table I. Fig. 1 and 2show the snapshots of Qualnet simulator for the scenario with 200 nodes.
TABLE I Simulation Parameters Parameters Values Terrain Area 1000 x 1000 m2 No. of nodes 50,100,150, 200 Node Placement Random Network Simulator Qualnet 6.1 Radio type IEEE 802.11 Protocols AODV, DSR, ZRP Modulation O-QPSK
Traffic Application CBR Packet size 512 Bytes Simulation time 300 seconds Mobility model Random way point Antenna model Omni-directional Energy model Mica motes Battery model Linear model
Fig. 2: Snapshot of the scenario for 200 nodes with ZRP protocol
V. RESULTS and ANALYSIS
Performance studies of the protocols are carried out with the help of metrics such as throughput, packet delivery ratio, total data bytes received, end-to- end delay and jitter. The results obtained from the simulations are compared.
A. Scenario with Stationary Nodes
To study the performance of routing protocols with IEEE 802.11b standard, various scenarios are deployed with different node density. In this case, simulation was done without mobility.
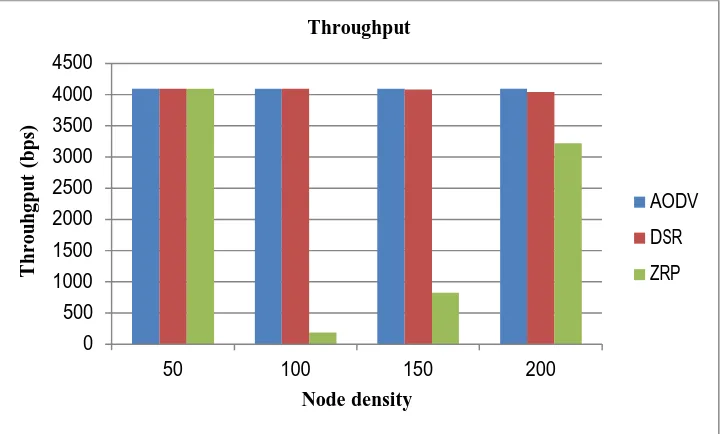
1) Throughput: Fig. 3 shows the variation of throughput as a function of number of nodes deployed in the scenario. From theFig. 3, it is observed that the throughput for AODV and DSR protocols almost same for the scenarios. For ZRP, it is similar to AODV and DSR with 50 nodes and it is decreased with 100, 150 and 200 nodes.
Fig. 3: Variation of Throughput with varying number of nodes 0
500 1000 1500 2000 2500 3000 3500 4000 4500
50 100 150 200
Th
r
o
u
h
gp
u
t
(b
p
s)
Node density Throughput
AODV
DSR
[image:3.612.126.488.476.693.2]2) Packet Delivery Ratio: It is the ratio of data packets received by the receiver to those transmitted by the source. A high value of packet delivery ratio is preferred, which indicates better performance of the protocol. Fig. 4depicts the packet delivery ratio for AODV, DSR and ZRP protocols. It is evident from the Fig. 4 that the packet delivery ratio is better with AODV and DSR protocols for all the tested scenarios. With ZRP, it is better for 50 nodes and is decreased with 100, 150 and 200 nodes.
Fig. 4: Variation of packet delivery ratio with different node density
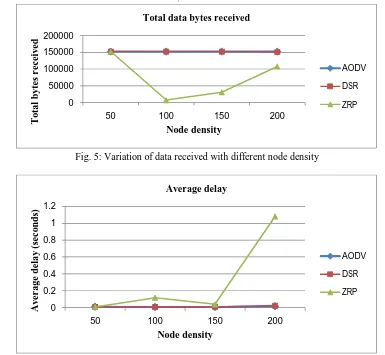
[image:4.612.109.494.366.721.2]3) Total Data Bytes Received: The variation of total bytes received with varying node density for the AODV, DSR and ZRP protocols is shown in Fig. 5. It is evident from the Fig. 5 that data bytes received using AODV and DSR protocols almost same. For ZRP, it is same for 50 nodes and is reduced with 100, 150 and 200 nodes.
Fig. 5: Variation of data received with different node density
Fig. 6: Variation of delay with different node density 0
20 40 60 80 100
50 100
150
200
P
ac
k
e
t
d
e
li
v
e
r
y
r
ati
o
Node density Packet delivery ratio
AODV
DSR
ZRP
0 50000 100000 150000 200000
50 100 150 200
To
tal
b
yte
s
r
e
c
e
iv
e
d
Node density Total data bytes received
AODV
DSR
ZRP
0 0.2 0.4 0.6 0.8 1 1.2
50 100 150 200
A
v
e
r
age
d
e
lay
(s
e
c
o
n
d
s)
Node density Average delay
AODV
DSR
4) End-to-End Delay: The average end-to-end delay is the ratio of total delay in receiving all the packets to the total number of packets sent by the source. The graph of average delay for AODV, DSR and ZRP protocols is shown in Fig. 6.It is observed that end-to-end delay is almost same for the scenarios with 50, 100 and 150 nodes. For ZRP, it is increased with 200 nodes.
[image:5.612.127.487.172.407.2]5) Average Jitter: The variation of delay in arrival of packets at the destination is referred to as jitter. This is due to network congestion, timing drift or changes in the route. A low value of jitter indicates batter performance. The plot for the variation of jitter with different network density is shown in Fig. 7. Jitter performance for both AODV and DSR protocols is low and for ZRP protocol, it is high.
Fig. 7: Variation of jitter with different node density
B. Scenario with Mobile Nodes
Performance of the AODV, DSR and ZRP Protocols has been studied for the scenario in which mobility of the nodes is considered. Random way point mobility model has been applied to the nodes.
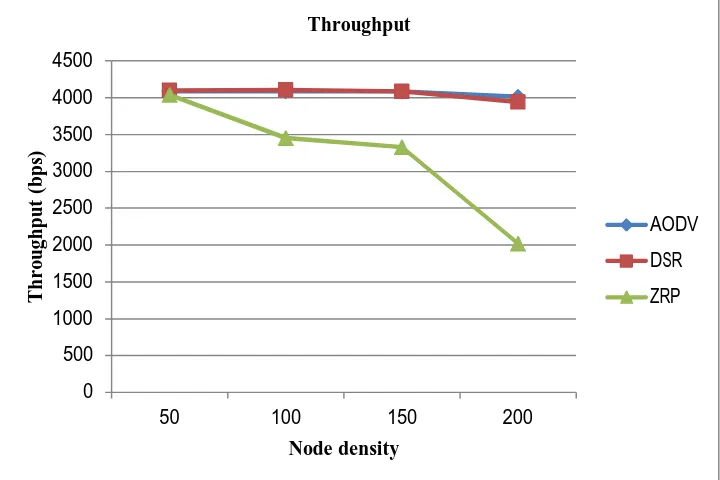
Fig. 8: Variation of throughput with node mobility 0
0.05 0.1 0.15 0.2 0.25
50 100 150 200
A
v
e
r
age
ji
tte
r
(s
e
c
o
n
d
s)
Node density Average jitter
AODV
DSR
ZRP
0 500 1000 1500 2000 2500 3000 3500 4000 4500
50 100 150 200
Th
r
o
u
gh
p
u
t
(b
p
s)
Node density Throughput
AODV
DSR
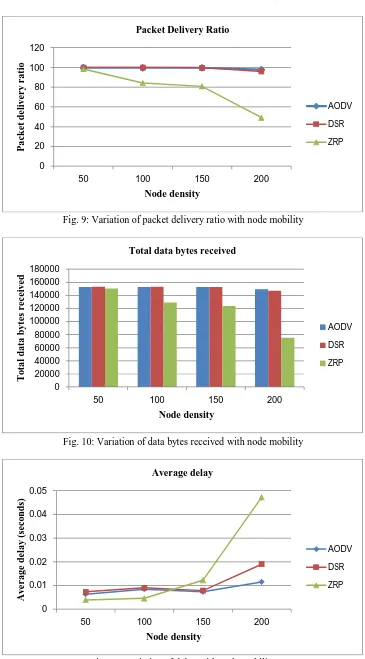
[image:5.612.126.486.474.714.2]Fig. 9: Variation of packet delivery ratio with node mobility
[image:6.612.126.487.79.272.2]Fig. 10: Variation of data bytes received with node mobility
Fig. 11: Variation of delay with node mobility 0
20 40 60 80 100 120
50 100 150 200
P
ac
k
e
t
d
e
li
v
e
r
y
r
ati
o
Node density Packet Delivery Ratio
AODV
DSR
ZRP
0 20000 40000 60000 80000 100000 120000 140000 160000 180000
50 100 150 200
To
tal
d
ata
b
yte
s
r
e
c
e
iv
e
d
Node density Total data bytes received
AODV
DSR
ZRP
0 0.01 0.02 0.03 0.04 0.05
50 100 150 200
A
v
e
r
age
d
e
lay
(s
e
c
o
n
d
s)
Node density Average delay
AODV
DSR
[image:6.612.123.488.494.714.2]Fig. 12: Variation of jitter with node mobility
Figures 8, 9 and 10 represent the plot for throughput, packet delivery ratio and total data bytes received respectively. It is observed from the figures that the performance of both AODV and DSR protocols almost same for the scenarios with varying node density of 50, 100, 150 and 200. For ZRP, the performance is better with 50 nodes and reduced with 100, 150 and 200 nodes in comparison with AODV and DSR protocols. Figures 11 and 12 depict the average delay and jitter performance of the protocols. AODV and DSR protocols show same performance in all the scenarios. Whereas ZRP, performs better with 50 and 100 nodes, and it has more delay and jitter for the scenarios of 150 and 200 nodes in comparison with AODV and DSR protocols.
VI. CONCLUSION
In this paper, performance evaluation of AODV, DSR and ZRP protocols for the scenarios with stationary and mobile nodes has been done by varying the node density using Qualnet-6.1 network simulator. From the simulation results, it is observed that routing protocols AODV and DSR are performing well with respect to throughput, packet delivery ratio and average jitter. Whereas in ZRP protocol, establishing the path for data transmission involves much time during route discovery and route maintenance.
VII. ACKNOWLEDGMENT
I wish to acknowledge Mr. Umesh and staff of Nihon communication solutions Pvt. Ltd., Bengaluru, for their timely help and technical support.
REFERENCES
[1] N. Qasim, F. Said, and H. Aghvami, “Mobile Ad Hoc Networking Protocols’ Evaluation through Simulation for Quality of Service,” IAENG International Journal of Computer Science, vol. 36, no. 1, Feb. 2009.
[2] C. Siva Ram Murthy and B. S. Manoj, “Ad Hoc Wireless Networks: Architectures and Protocols”, Prentice Hall, 2004.
[3] Shah, R.C., Rabaey, J. “Energy Aware Routing for Low Energy Ad Hoc Sensor Networks”, In: IEEE Wireless Communications and Networking Conference (WCNC 2002), vol. 1, pp. 350–355, 2002
[4] Perkins, C.E., Bhagwat, P. “Highly Dynamic Destination Sequenced Distance-Vector Routing (DSDV) for Mobile Computers”, In SIGCOMM 1994, pp. 234–244, August 1994
[5] Clausen, T., Jacquet, P. “Optimized link state routing protocol”, IETF RFC 3626 (2003), http://www.ietf.org/rfc/rfc3626.txt
[6] Perkins, C.E., Royer, E.M. “Ad Hoc On-Demand Distance Vector Routing”, In 2nd IEEE Workshop on Mobile Computing Systems and Applications (WMCSA 1999), pp. 90–100, February 1999
[7] S.R. Das, C.E. Perkins, and E.E. Royer, “Performance Comparison of Two on Demand Routing Protocols for AdHoc Networks,” Proc. INFOCOM, 2000, pp. 3-12.
[8] D.B. Johnson and D.A. Maltz, “Dynamic Source Routing in Ad Hoc Wireless Networks,” Mobile Computing, vol. 353. Kluwer Academic, 1996.
[9] Camp, T., Boleng, J., Davies, V. “A Survey of Mobility Models for Ad-hoc Network Research”, Wireless Communication and Mobile Computing [WCNC]: Special Issue on Mobile Ad-hoc Networking: Research, Trends and Applications 2(5), 483–502, 2002
[10] Z J. Haas, M. R. Pearlman, and P. Samar, “The Zone Routing Protocol (ZRP) for Adhoc Networks”, draft-ietf-manet-zone-zrp-04.txt.July 2002
[11] S. Mohapatra, P.Kanungo, “Performance analysis of AODV, DSR, OLSR and DSDV Routing Protocols using NS2 Simulator”, International Conference on Communication Technology and System Design 2011. Procedia Engineering 30 (2011) 69 – 76 ELSEVIER.
[12] Gaurav Sharma ,V. Sahu, P.K. Maurya, R. Paulus, “Analyzing the Effect of Constant and Lognormal Shadowing Model on Ad-hoc Routing Protocols” Volume 66– No.8,IJCA,March,pp-16-19,Mar 2013.
[13] M. Rajput, P. Khatri, A. Shastri, and K. Solanki, “Comparison of ad-hoc reactive routing protocols using opnet modeler," in Computer Information Systems and Industrial Management Applications (CISIM), 2010 International Conference on, pp. 530-534, IEEE, 2010.
[14] Ghaffari, A., Taghipour, S. “RRPD: The reliable routing algorithm with regard to packet deadline in wireless sensor networks”, J. Basic. Appl. Sci. Res., Vol. 2, No. 3, pp. 2970-2975, 2012
[15] QualNet user guide
0 0.02 0.04 0.06 0.08
50 100 150 200
A
v
e
r
age
ji
tte
r
(s
e
c
o
n
d
s)
Node density Average jitter
AODV
DSR