A Study on Comparative Analysis of Capital
Structure of SMEs
A. Rambabu1, B. Sirisha2
1
Assistant Professor, 2Student, School of Business Management, Anurag Group of Institutions, Venkatapur (V), Ghatkesar (M), Medchal (Dist.), Hyderabad-500088, Telangana State.
Abstract: This study examines Capital structure is essential for a firm to decide in what proportions to divide its cash flows. Its is vital to rescue its firm from the burden of over capitalization and under capitalization. Determining a proper capital structure is vital for small businesses like SMEs just like any other corporate firms. As they do need to decide on better mix to meet the short- and long-term debts as well as to plan their financials in a better way. It brings a balance between the risk and returns seeking to maximize the stock price and reducing the cost of capital on the other hand.
Keywords: Comparision, Capital Structure, SME, small &medium scale industries, Ratios
I. INTRODUCTION TO CAPITAL STRUCTURE
The important function of finance in a corporate firm lies with the financial decision which mainly studies the effective utilization of funds invested by the owners of such firm or those funds which are obtained from external sources that are retained or ploughed back out of surplus or undistributed profits. These decisions briefs to plan an appropriate mix with least count,to raise long term funds, and to mobilize the funds for working capital in a short period of time.as the financial decisions very nature is to plan the capital structure.
A. Objectives
The present study is made based on the following objectives:
1) To analyse the pattern of capital structure employed by the companies.
2) To assess the ability of the company to fulfill the obligations through the long term solvency. 3) To compare the company’s total debt and total equity by employing debt to equity ratio.
II. DATA ANALYSIS A. Ratio Analysis
Ratio analysis is one of the oldest methods of financial statement analysis. It was developed by banks and other lenders to help them choose amongst competing companies asking for their credit. Two sets of financial statements can be difficult to compare. The effect of time, of being in different industries and having different styles of conducting business can make it almost impossible to come up with a conclusion as to which company is a better investment. Ratio analysis helps creditors solve these issues.Ratio analysis is a tool that was developed to perform quantitative analysis on numbers found on financial statements. Ratios help link the three financial statements together and offer figures that are comparable between companies and across industries and sectors. Ratio analysis is one of the most widely used fundamental analysis techniques.
However, financial ratios vary across different industries and sectors and comparisons between completely different types of companies are often not valid. In addition, it is important to analyze trends in company ratios instead of solely emphasizing a single period’s figures.
What is a ratio? It’s a mathematical expression relating one number to another, often providing a relative comparison. Financial ratios are no different—they form a basis of comparison between figures found on financial statements. As with all types of fundamental analysis, it is often most useful to compare the financial ratios of a firm to those of other companies.
Financial ratios fall into several categories. For the purpose of this analysis, the commonly used ratios are grouped into four categories: activity, liquidity, solvency and profitability.
Following ratio have been used to analyze and interpret the results of the study: 1) Debt – Equity ratio.
B. Computation of Ratio
1) Debt-equity Ratio: The main object of calculating the debt-equity ratio is to measure the relative interest of owners and creditors in the firm. From the creditors’ point of view, it measures the extent to which their interest is covered by owned funds. A standard debt-equ
2) ity norm for all industrial units is neither desirable nor practicable. Different standard debt-equity ratios are used for different industry groups. However, in less developed countries, such standards cannot be accepted. Therefore, this ratio depends upon industry, circumstances, and prevailing practices and so on. The generally accepted standard norm of debt-equity ratio is 2:1. Debt - equity ratio is calculated by using the following formula:
Debt – Equity Ratio = Long Term Debt / Net Worth.
[image:2.612.54.559.230.374.2]The debt - equity ratio of Parag milk foods ltd and DFM foods ltd are presented below:
Table 4.2.1 Table showing the Debt – Equity Ratio of Parag milk foods and DFM foods,
YEARS
Parag milk foods ltd DFM foods ltd
Debt (in crores)
Net worth(in
crores) Ratio Debt (in crores)
Net worth(in
crores) Ratio
2017-2018 291 712 0.4 93 102 0.9
2016-2017 261 624 0.41 98 85 1.15
2015-2016 389 361 1.07 57 65 0.87
2014-2015 545 124 4.3 50 46 1.08
[image:2.612.155.463.409.619.2]2013-2014 556 97 5.73 51 38 1.34
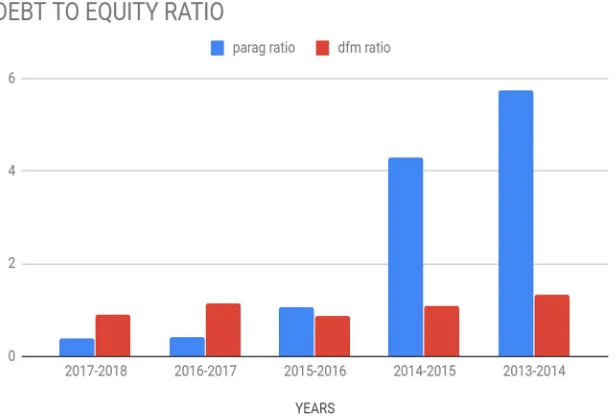
Figure 4.2.1: Graph showing the variation of ratios
Interpretations
a) Table 4.1 shows the debt to equity ratios of Parag milk foods ltd and DFM foods ltd The ratios are calculated by dividing long term debt and net worth.
b) From the figure 4.1 it is seen that the debt to equity ratio of Parag food ltd had fallen drastically from 2014 to 2018. It means that in 2014 it used more debt.
3) Solvency Ratio: Solvency is the term which is used to describe the financial position of any business which is capable to meet outside obligations in full out of its own assets. So their ratio establishes relationship between total liabilities and total assets. Solvency ratio is calculated by using the following formula:
[image:3.612.62.550.150.347.2]Solvency ratio = total liabilities / total assets.
Table 4.2.2.Table showing the Solvency ratios of Parag milk foods ltd and DFM foods ltd
Parag milk foods ltd DFM foods ltd
Years
Total
liabilities Total assets Ratio Years Total liability Total assets Ratio
2017-2018 1418 1418 1 2017-2018 275 275 1
2016-2017 1312 1312 1 2016-2017 262 262 1
2015-2016 1003 1003 1 2015-2016 192 192 1
2014-2015 932 932 1 2014-2015 142 142 1
2013-2014 823 823 1 2013-2014 127 127 1
2012-2013 675 675 1 2012-2013 139 139 1
2011-2012 580 580 1 2011-2012 123 123 1
[image:3.612.137.478.376.623.2]2010-2011 463 463 1 2010-2011 55 55 1
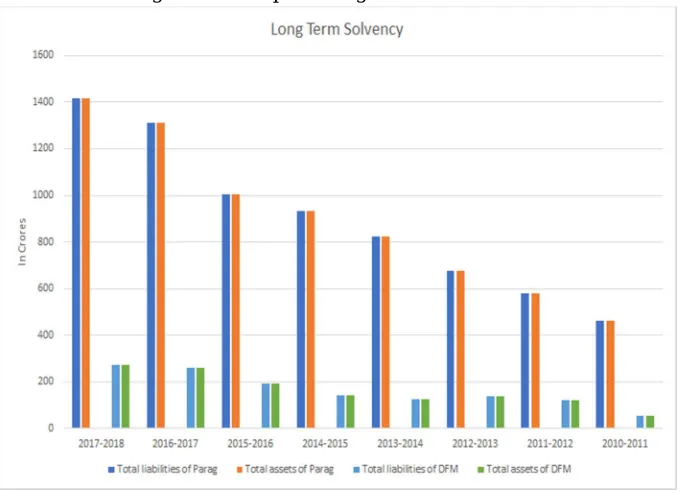
Figure 4.2.2: Graph showing the variation of ratios
Interpretations
a) Table 4.2 shows the solvency ratios of Parag milk foods ltd and DFM foods ltd The ratios are calculated by dividing total liabilities and total assets.
b) From the above figure and table we can see that the ability of Parag milk foods ltd has increased from 2010 to 2018
C. Capital Structure Theory
1) Net Income Approach: suggests that value of the firm can be increased by decreasing the overall cost of capital (WACC) through higher debt proportion. There are various theories which propagate the ‘ideal’ capital mix / capital structure for a firm. Capital structure is the proportion of debt and equity in which a corporate finances its business. The capital structure of a company/firm plays a very important role in determining the value of a firm.According to Net Income Approach, change in the financial leverage of a firm will lead to a corresponding change in the Weighted Average Cost of Capital (WACC) and also the value of the company.
a) The cost of debt is less than the cost of equity i.e. the capitalization rate of debt is less than the rate of equity capitalization. This prompts the firm to borrow.
b) The debt capitalization rate and the equity capitalization rate remain constant. c) The proportion of the debt does not affect the risk perception of investors. d) Investors are only concerned with their desired return.
e) The cost of debt remains constant at any level of debt.
f) Dividend payout ratio is 100%.
[image:4.612.102.514.303.598.2]Cost of Capital (Ko) or Weighted Average Cost of Capital (WACC) Ko/WACC = Net Income (NI)/Market Value of the firm (V)
Table showing the cost of capitals of DFM foods and Parag milk foods.
YEARS COST OF CAPITAL OF PARAG % COST OF CAPITAL OF DFM %
2011 4 18.6
2012 4.89 4.4
2013 4.14 4.4
2014 3.6 5.7
2015 3.74 5
2016 5.1 5.17
2017 7 3
[image:4.612.77.535.307.449.2]2018 6.8 3
Figure showing the cost of capitals of DFM foods and Parag milk foods.
Interpretations
i) Table 4.3.1 shows the cost of capital of Parag milk foods ltd and DFM foods ltd. The cost of capital of the companies are calculated by dividing the net income of the firm (EAT) by the market value of the firm following the assumptions of the theory.
ii) From the figure 4.3.1 the fluctuations in the cost of capital are seen due to the increase and decrease in the use of debt.
iii) In 2011 the cost of capital of the DFM food was 18.6% as their equity was more than the debt in the capital structure of the company. From the next years the cost of capital reduced due to increase in the portion of debt in the pattern of the capital structure.
[image:4.612.164.445.474.589.2]2) Net Operating Income (NOI) Approach: As per this approach, the market value of the firm is based on the earnings available for fund providers after paying all other expenses except interest on debt. The profit available for funds providers or for calculating the market value of the firm is called Net Operating Income (NOI).This theory is just opposite to NI approach. NI approach is relevant to capital structure decision. It means decision of debt equity mix does affect the WACC and value of the firm.According to this approach with the increase in debt, the cost of equity increases. An increase in debt in the capital structure results in increased risk for shareholders. As a compensation of investing in the highly leveraged company, the shareholders expect higher return resulting in higher cost of equity capital. Hence,
Market value of the company = EBIT/WACC ;Total Equity =Total market value – total debt a) There are no corporate taxes.
b) Cost of debt remains constant at all level of debt. c) Overall cost of capital remains constant.
[image:5.612.125.487.273.443.2]d) Value of the firm depends on expected net operating income and overall capitalization rate or the opportunity cost of capital. e) Net operating income of the firm is not affected by the degree of financial leverage.
Table showing the cost of equity of DFM foods and Parag milk foods.
YEARS Cost of Equity of Parag Cost of Equity of DFM Foods
2011 9.5 0.64
2012 12.8 3.8
2013 15.13 4
2014 17.49 3.5
2015 24.76 5.3
2016 25.71 8.5
2017 10.53 9.6
[image:5.612.159.455.472.632.2]2018 26 16.7
Figure showing the cost of Equity of Parag milk foods and DFM foods
Interpretations
a) Table 4.3.2 shows the cost of equity of Parag milk foods ltd and DFM foods ltd. The cost of equity of the companies are calculated by deducting the total debt of the firm from the market value of the firm.
b) Based on the assumptions of the theory the cost of equity is computed and observed that with an increase in the debt the cost of equity is also increasing.
III. FINDINGS
A. The average ratio of debt and equity is better in Parag milk foods ltd as compared to DFM foods ltd. It shows that Parag is using more debt financing in its capital structure pattern as compared to DFM foods ltd electronics. It implies that the company is adopting NOI approach of capital structure. The more use of debt financing in this industry is increasing the value of the firm and minimizing the cost of capital resulting in overall wealth maximization of shareholders.
B. It has been found from the study that the average solvency ratio is maintained as 1:1 from the last five years in both Parag milk foods ltd and DFM foods ltd.
C. The pattern of capital structure of DFM foods is observed to be better than that of Parag foods from both the NI and NOI approaches.
D. The capital structure of the Parag food is weaker than the DFM as they are causing risk to the shareholders from NOI approach and their market value is less from the NI approach.
IV. SUGGESTIONS
A. The Parag milk foods should construct a better pattern of capital structure which would improve their market value with less
cost of equity to their shareholders.
B. The Parag milk foods ltd and DFM foods ltd should improve their debt equity ratio as it is not as per the standard norm. These industries are not using as much debt as expected from them.
C. Both the SMEs are advised to maintain a trade –off between debt and equity in future also so as to achieve the objective of optimum capital structure.
D. The solvency ratio of Parag milk foods ltd and DFM foods ltd presented is good and if maintained in the same manner would
be profitable.
V. CONCLUSION