An Expert System for Type-2 Diabetes Mellitus
Risk Stratification: Data Mining Techniques
Abhishek Bajpai1, Sanjiv Sharma2 1, 2
Department of Computer Science Engineering & Information Technology, Madhav Institute of Technology & Science Gwalior, Madhya Pradesh, India.
Abstract: Due to continuously increasing of diabetes mellitus, more and more families are influenced with this chronic and crucial disease. Type-2 diabetes has a very popular and high incidence disease all over the world. In order to provide the treatment and prevention for the diabetes, early prediction of this chronic disease is demanded in the globally world. So for that, a wide range of the machine learning and mining methods and tools are available for analysis of that problem. In this study, uses advantages of these methods and tools to make a model for the prediction of the disease as early. So, this study provides a novel hybrid (Two-level) model for predicting the risk of type-2 diabetes mellitus. This study uses the K- means clustering algorithm to extract the pattern such as- incorrectly instances and then remove it. After that, apply the classification algorithm to the result set from the K- means algorithm. Logistic regression algorithm is used to make a final classifier for the model in order to predict the risk of the diabetes in the patients. This study also provides the comparison analysis with the decision tree algorithm (48) in the terms of accuracy. This model attained the greatest accuracy with the regression algorithm rather than J-48 algorithm. In order to get the result, this study used the PIMA Indian diabetes data set obtained from the University of California at Irvine (UCI) machine learning repository. The conclusion of this work shows that this model ensure the better accuracy rather that other experiments researches in the literature. In order to evaluate the performance of the proposed model accuracy, sensitivity, specificity be used. On the basis of the result, this proposed model would be useful for the type 2 diabetes management and realistic care of the diabetes.
Keyword: Diabetes Mellitus, data mining, classification, clustering, PIMA Indian diabetes.
I. INTRODUCTION
Now a day, Diabetes is one of the most common crucial diseases in all population and all age groups and it is growing rapidly. The major causes for the diabetes are disorder of the glucose metabolism in the body [1]. Glucose metabolism means that whatever we eat then eat is broken down in the glucose (in the form of sugar). Glucose metabolism is done by one of the hormone in our body is called Insulin. Pancreas is failure to produce sufficient insulin to the body and inefficient of the insulin in the body are the causes for the disorder for the glucose metabolism. So Insulin play very vital role in the diabetes mellitus because Insulin is a hormone that is produced by the pancreas. After eating anything, the pancreas β cells automatically releases an adequate quantity of insulin to move the glucose present in our blood into the cells, as soon as glucose enters the cells blood-glucose levels drop. Lack of insulin in body is major cause for the diabetes. However, diabetes develops when the pancreas does not produce enough insulin for good glucose metabolism in body, or the cells in muscle, liver, and fats do not use insulin properly, or both. There are three type of the diabetes.
1) Type 1 Diabetes
2) Type 2 Diabetes
3) Gestational Diabetes
(unconsciousness). According to the IDF (International Diabetes Federation),I n the past 30 year of developments in world, 382 million people are deeply influenced with this chronic disease and their family has been also impacted with this. And According to some diagrammatic statistics, the number of diabetics in China was nearly 110 million in 2017 [4]. This means that China has the largest diabetic population country rather than other country in world.
Recently, Health care system is generating continuously massive amount of data (diabetes diseases related, health records etc.) for observing the different kind of diseases such as- diabetes risk prediction etc. and provide the scope for analysis of that data to extract the knowledge so that diseases can be observed by the different mining techniques and learning algorithms. . In order to decrease the morbidity and reduce the influence of diabetes mellitus, it is crucial for us to focus on a high-risk group of people with DM. So for that data mining techniques are gaining increasing importance in medical diagnosis field by their classification capability. In order to detect the high-risk group of DM, mining play vital role in order to utilize the information technology methods (classification methods machine learning methods etc.). Therefore, data mining technology is an appropriate study field for us. Data mining, also known as Knowledge Discovery in Databases (KDD), is defined as the computational process of discovering patterns in large datasets involving methods at the intersection of artificial intelligence, machine learning, statistics, and database systems. The main purposes of these methods are pattern recognition, prediction, association, and clustering. Data mining contains a series of steps disposed automatically or semi-automatically in order to extract and discover interesting, unknown, hidden features from large quantities of data. It is reasonable to believe that there are various valuable patterns and waiting for researchers to explore them. Therefore it is necessary to establish a model that can classify the patient into two category such as- Diabetic person category and non-diabetic category. This study provides a way to solve to improve the accuracy of the prediction model, and to make the comparison of our model with others researches experiment.
Section 2 and section 3 presents, the detailed literature survey and background of the Mining methods which include the different levels of the KDD (Knowledge discovery in data) model. It also includes various existing models to predict the risk of the diabetes mellitus in the terms of various research studies. Some of the various researches provide the link between the diabetes and data mining in order to establish the relation between the mining and that crucial disease.
Section 4 describe about the proposed methodology to predict the risk of the diabetes in patients. It also includes clustering and classification methods respectively to make an effective hybrid model with better accuracy.
Section 5, shows the result analysis of the experiments done by the different algorithms, comparison of performance measurement based on various parameters such as- accuracy, sensitivity, specificity, and true positive value (TP- value) and comparative analysis. Section 6 concludes the whole research work and suggests few directions where future work can be continued with enhancement.
II. LITERATURE REVIEW
In recent year, use of the data mining classification techniques is one of the most essential and has been used with increasing the accuracy to predict the outcomes for the diseases. Its application has been advantageous for the medical diagnosis due to the various earlier researcher’s activities in the medical field. Many algorithms and different tool list are provided by the existing researchers. Over the last few years, many of the researchers have highlighted the potential prediction model to predict the risk of the diabetes with goal to increase the accuracy of the model. Many of them result provides good classification accuracy. In this section, a few potential models that are related to the proposed model are presented.
Based on several studies, common PIMA Indian data from the Californian University are used by the various researches to estimate the result of the model. W. Chen, S. Chen et al. [5] proposed a hybrid model to predict the risk assessment of the diabetes. This model use Pima Indian diabetes data set used for the experiment. As in the model, this is the hybrid model because it uses two algorithms for the data reduction and classification for the final results. K-means (K=2) clustering algorithm is used to remove the miss classified instances and then decision tree algorithm (J-48 ) is used for the final classifier which predict the result in two classes diabetic patients or non-diabetic patient with the 90.04 % accuracy.
In order to obtain more useful and meaningful data, data pre-processing should be used. V. Vijyan [6] provides the comparison analysis of the different processing techniques. It Principal component analysis and discretization filters for the data pre-processing on order to get the better result. After that pre-processed data are classifies using two classification techniques such as Naïve Bayes classifier and support vector machine. The result of this study shows that the classification using naïve Bayes provide that accuracy is increasing frequency but with the support vector machine it shows the accuracy is decreasing.
neighbour) to predict the diabetes in the patients. The result of this study shows that J-48 decision tree algorithm attained the greater accuracy with 73.82 than other algorithm.
To make emphasize on the better accuracy, B M. Patil, R C joshi et al. [8] reviewed the Pima Indian diabetes data set and make a pre-processing of that data set and then provide a hybrid model to predict the risk of the diabetes. This model uses K-Means clustering algorithm to remove the incorrectly classified instances. Then C 4.5 classification is chooses as final class label to perform by constructing the decision tree using C4.5 algorithm with the accuracy 92.38 %.
K. Sowjanya [9] developed an android application based to predict the risk of the diabetes based on some features using mining techniques in order to make convenient for everyone. It used decision tree classifier (ID-3) choose at two class label to predict the risk of the diabetes. This application also provides the information and treatment for the diabetes. This application used real time data set of the patients which are collected from the hospital of the Chhattisgarh India. Bases on this system, G. Shi, S. Liu et al. [10] provide a risk score device based on the mobile device that calculate the risk score of the diabetes in the person based on the continuous classification.
M. Xue Meng [11] provides the comparative analysis of the different classification algorithms for the prediction of the diabetes. This study used three algorithms such as- Logistic Regression, Artificial neural network, and decision tree) then compare the performance based on the accuracy parameters. The result of this study shows that C 5.0 algorithm provides the better accuracy with 76.13 % than other algorithms.
K. Polat, S.Gunes [12] presented a cascade learning system based on Generalized Discriminate Analysis (GDA) and Least Square Support Vector Machine (LS-SVM) to the diagnosis of Pima Indian diabetes disease Classification accuracy reported by this method was 82.05 %.
M. Durairaj, G. Kalaiselvi [13] developed diabetes prediction model using three algorithms; Naïve Bayes, Artificial Neural Networks & K- Nearest Neighbours and their efficiency was calculated. The result indicate that Artificial neural network was the best followed by Naïve Bayes and then K nearest neighbour.
L. Lukmanto, R. Budi et al. [14] proposed fuzzy hierarchical model for early detection of diabetes mellitus. In order to overcome the crisp boundary problem in traditional decision Tree,
.A. Jarullah [15] conducts a diabetes prediction model by using the decision tree algorithm. In this study, Weka's J48 decision tree classifier was applied to the dataset to construct the decision tree model. The accuracy of the resulting model was 78.1768%. Han and Luo [16] proposed a pair wise and size-constrained K-means method to screening the high risk population of the diabetes mellitus. This method also provides a tool for the risk stratification of the clinical disease.
In summary, some of the studies of the algorithm comparison and model establishing for the diabetes mellitus prediction have been accomplished by these related works. However, the prediction accuracy and data validity were not too high enough for the realistic application. Therefore this study proposed the hybrid model for the high accuracy and PIMA Indian diabetes dataset is used for this experiment work.
III. BACKGROUND AND METHODS
This section provides the discussion about the data mining introductory, data mining tool and data mining methods such as- (Clustering and Classification) used for this model.
A. Data Mining
B. Data Mining Tool Kit
For the implementation of the proposed model, it is compulsory to make use of some data mining tools in order to make some useful decision. An efficient data mining tool could assist us to transforming the huge data into useful information. In earlier, there are various open source mining tools are available for use, such as Waikato Environment for knowledge analysis, TANGARA, Rapid miner, Orange, KNIME etc. Among all these tools, WEKA is one of the most fully functional and popular tools. Due to this, WEKA is used to analyse the result for this system. WEKA tool is utilized to create a model for classifying the instances into the two classes; diabetic patient or non-diabetic patient. WEKA is free and non-commercial tool kit. It consists of standard machine learning and data mining algorithms, which are written in the java environment. These algorithms can be applied to obtain useful knowledge form database which are too large to be analysed by hand. Using these pre-processing, classifying, clustering, associating algorithms, and the visual interface, provide more convenient approach for obtain the useful information from the data base easily [17]. In recent years, utilizing data mining algorithm in medical predictive analysis has increased due to earnest research in related areas. Over the last few years, several researches have posited that it is possible to acquire the clinically assistive supports and predictive models from basic patient data [18].
C. Data Set Description
The Pima Indian Diabetes data set used for this work was taken from the UCI Machine Learning Repository. It consist the information on 768 patients of population of the Phoenix, Arizona, USA [19] in which 268 are the tested positive patients and 500 are the tested negative patients with 376 records contains missing values. Tested positive means that the patient is diabetic and tested negative means that the patient is non-diabetic. It contains the 8 features of the particular instances which all are numeric. These all are features are utilized to predict whether a person would be test positive or negative. The attribute information presented in the dataset has been given in following table 1.
1) Number of times pregnant (prag).
2) Plasma glucose concentration at 2 hour in an oral glucose tolerance test (plas).;
3) Diastolic blood pressure (pres).
4) Triceps skin fold thickness (skin).
5) 2-hour serum insulin (insu)
6) Body Mass Index (Bmi)
7) Diabetic pedigree function (pedi).
8) Age (age).
9) Class variable (class).
TABLE 1
ATTRIBUTE INFORMATION
S.No. Attribute Mean Standard deviation Type
1 Prag 3.8 3.4 Numeric
2 Plas 120.9 32.0 Numeric
3 Pres (mm Hg) 69.1 19.4 Numeric
4 Skin (mm) 20.5 16.0 Numeric
5 Insu (mm U/ml) 79.8 115.2 Numeric
6 Bmi (height in m)^2 32.0 7.9 Numeric
7 Pedi 0.5 0.3 Numeric
8 Age 33.2 11.8 Numeric
D. Data Mining Techniques
1) K-means Clustering Algorithm: The k-means clustering method is one of the most popular partitioning methods. K-means algorithm has a rich history as it was independently discovered in different scientific fields by Ball & Hall (1956) and McQueen (1967). It is one of the most popular used clustering algorithms. It is most popular and efficient algorithm because it provides ease of implementation, efficiency, simplicity, and empirical success to any applicable domain[20]. The aim of this method is to partitioning the whole data into disparate clusters so that observations with in the same cluster are more closely related to each other than those assigned to different clusters [21]. The procedure follows a simple and easiest way to classify a given data instances into a certain number of specified clusters (suppose k clusters) means fixed apriori. This algorithm follows a simple and easy way to classify a given data set through a certain number clusters (assume K clusters) fixed apriori. K-means algorithm randomly chooses K objects, representing the K initial cluster center. The following step is to take each point belonging to a given data set and associate it to the nearest center based on the closeness of the object with cluster center using Euclidean distance. When all the objects are distributed, it is time to recalculate new K cluster centres. The process would be repeated until there is no change in K cluster centres. K-means aims at minimizing an objective function known as squared error function that is given by the following [22].
( ) = ∑ ∑ (|| − ||)∗(|| − ||) (1)
The K-means algorithm can be modulated into two phases: the initialization phase and the iteration phase. In the initialization phase, the algorithm randomly assigns the instances into k clusters. In the iteration phase, the algorithm computes the distance between each instances and each cluster and assigns that instances to the nearest cluster.
Let D = {d1, d2, d3... dn} be the set of data points and C = {c1, c2, ……., cc} be the set of centres. a) Randomly select ‘c’ cluster centres.
b) Calculate the distance between each data point and cluster centres.
c) Assign the data point to the cluster center whose distance from the cluster center is minimum of all the cluster centres.
d) Recalculate the new cluster centre distance using:
Vi = (1 ci⁄ ) ∑ Di (2)
Where, Ci is the number of similar type of instances in ith cluster. e) Recalculate the distance between each instances and newly cluster centres.
f) If no data point was there or assigned then stop, otherwise repeat from step 3.
2) Logistic Regression Algorithm: The goal of the classification algorithm is to establish a model which can provide the mapping between the data items and given class category. This study uses the logistic regression algorithm to make classify the instances into the two class labels such as- positive class and negative class. Logistic regression algorithm provide the binary classification that means it could predict the result into two category such as- yes or no, true or false, etc. based upon the threshold value. The main purpose of this study is to predict whether a person is diabetic or not. However, regression algorithm is used in data mining, disease automatic diagnosis, and especially for predicting and classifying of medical and health problem. So for this study logistic regression is used to make the final classifier as output result. This logistic regression algorithm is similar as the linear regression algorithm, the difference is that linear model gives the continuous value as a output but regression model gives the discrete value as output. Linear algorithm always maintains the consistency and sensitivity over the real number. But in the regression model may set a critical point or threshold value based upon the sigmoid function. So, the output is 0 if the calculated value below to the threshold and 1 if he calculated value above 1. Therefore, regression algorithm always gives the output in the range between 0 and 1 or [0, 1]. Based on the regression algorithm, it add one more step in the linear algorithm (sigmoid function). The features are summed then apply the sigmoid function to make the prediction. The formulas for the logistic regression algorithm are represented by the equation (3), (4).
( ) ( ) = (3)
( = +1| ) ( . ) ( = −1| ) = 1− ( = +1| ) (4)
In this work, the output will come into the two category i.e. diabetic patient or non-diabetic patient. In the equation (4), Y represents the probability for the diabetic patient. And X represents one of the instances with 8 features as an independent variable. Every input
3) Decision Tree Algorithm: Classification is the process to build a model of choose class label from a data set that contain class labels. In the last few years, a great number of algorithms have been developed for classification based on the data mining. Decision tree algorithm is a popular classification algorithm. A Decision tree represents a function that takes as input a vector of attribute values and returns a Decision called a single output value. Also on the bases of the training data the classes for the newly instances are being found. This algorithm generates the rules for the prediction of the target variable [23]. With the help of decision tree classification algorithm, it is easy to distribute of the data into class labels. A Decision tree provides an efficient decision by performing a number of tests on the number of instances.
E. J-48 Tree Algorithm
J-48 is one of the most common java implementation of the C 4.5 tree algorithm. J-48 is the extension version of the ID3 (Iterative Dichotomise 3) algorithm. J-48 algorithm provide an additional features for missing values removal, decision trees pruning, continuous attribute value, made a number of rules, etc. In the WEKA data mining tool, J48 is an open source Java implementation of the C4.5 algorithm [24]. The WEKA tool provides a number of filters which are associated with tree pruning. In other algorithms the task of classification is performed recurrently till every single leaf is pure, that result of the classification of the data should be as possible as perfect. The objective of this algorithm is generalization of a decision tree until it provide as perfect as flexibility and accuracy.
Steps
1) In the first step, those instances which are belong to the same class label then the tree represents those instances a leaf so the leaf is returned by the same class labelling.
2) The potential information means entropy and gain is calculated for every attribute, given by a test on the attribute. Then the calculated the gain that would be result from a test on the attribute.
3) Then the best attribute is found on the basis of the maximum gain value of particular attribute and that attribute selected for branching.
F. Procedure
1) Calculate the entropy and gain of every attribute of the data set D.
2) Split the data set D into subset using the attribute for which the resulting entropy (after splitting) is minimum (or, equivalent, information gain is maximum).
3) Calculate the gain value of every attribute.
4) Make decision tree node containing that attribute based on the gain value of the particular value.
5) Recurs on subset using remaining attributes.
G. Entropy & Gain Calculation
Entropy is the measurement of the randomness in the information being processed. This process used the entropy which measures of the data disorder.
( ) = (− ⁄ + ) ( ⁄ + )−( ⁄ + ) ( ⁄ + ) (5)
For class Attribute
Where p is the Possibility of true amd N is the possibility of false ( | ) = ∑ ( + )⁄ + ( ( , ) (6) And the Gain is
( , ) = ( )− ( | ) (7)
H. Features of the Algorithm:
1) J-48 algorithm handle discrete and continuous both type of attributes. A threshold value is decided by C4.5 for making the prediction for continuous attributes values. This value divides the data set list into those who have their attribute value below the threshold and who are having more than or equal to it.
IV. PROPOSED MODEL
A. Problem Statement
For the prevention and treatment of the diabetes, early detection of diabetes is demanded. Disease prediction is plays impotent role in data mining. Prediction of the any serious disease using conventional methods such as- Medical test like- HBA1c for diabetes consumes more time. Hence, diagnosis of a disease using data mining and machine learning algorithm provide better and time consuming treatment to the patient. However, data mining techniques reduces the pathological test which provides the better performance in the terms of accuracy of the model. In the previous studies, some of the researches provide various models in order to predict the different disease like- diabetes, stroke, cardiology disease etc. with good accuracy as a comparison parameter using different classification algorithms. In the few pas studies, noticed that, some of the researchers focused is to find the correctly classified instances and boost up the accuracy of the models. But medical domain still has room to enhance the accuracy in order to decrease the misclassified instances and then remove all these instances. Suppose if the diabetic patient is predicted in the non-diabetic class or non-non-diabetic is predicted in non-diabetic class then it causes heavy losses to the tested person which can be causes of the serious illness or even death. So for that, this study provides a hybrid model to decrease the incorrectly classified instances and enhance the TP (true positive) rate, decrease the FP (false positive) rate and enhance the accuracy.
B. Working Principle
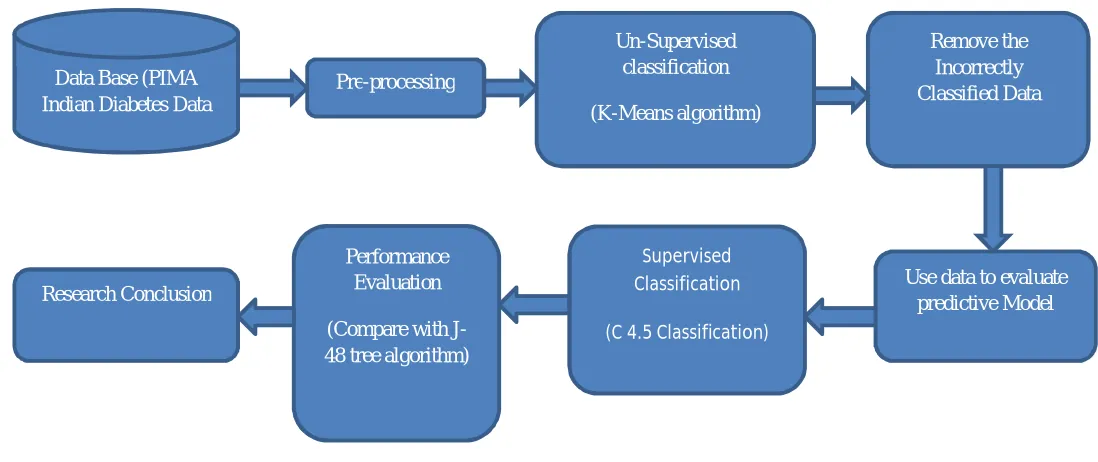
For the purpose of prediction, a prediction model defined. The working principle of the proposed model has been shown in Fig. 1. It consist four steps:
1) Data collection: Collecting data set for this study.
2) Data Pre-processing: Replace the missing values and impossible values ;with mean.
3) Data Reduction: Remove the in correctly classified data using K-means algorithm to cluster the data set.
4) Classification: Constructing logistic regression by using the reduced data. And compare with the Decision tree algorithm.
5) Performance Evaluation: Evaluate the performance by using some of the classifier evaluation metrics
C. Data pre-processing
Data Pre-processing is play important role in result prediction. The quality of the data is the key to whole prediction model because it directly affects the result of the prediction model. It must be done before the data analysis. The Pima Indian Diabetes data set contains various missing and impossible values such as body mass index features have value 0 and 0 for plasma glucose. In this study, data pre-processing is done by some appropriate methods to optimize the original data set. First, there are various missing and impossible values in the original data set due to errors. To reduce the influence of the impossible or missing values, we used the means form the original data set to replace all that values.
= ( − ⁄ ) (8) Where new value is the normalize value,
X’ is mean value of the that features, S is standard deviation of the features
D. Data Reduction
The aim of this study is to remove incorrectly classified instances to enhance the result of the model. So for that in the first level, before the application of the classification algorithm, K-means clustering algorithm is applied to extract the pattern (incorrectly classified instances) and remove those instances using the k-means techniques in the WEKA tool. After the data reduction, this study found the 513 correctly classified instances.
E. Classification
After the first level (to remove the incorrectly classified instances), it could be seen that 255 instances are incorrectly classified, these instances would be removed using k-means algorithm. After that the regression algorithm applied to make final classifier and compare the performance with the decision tree algorithm (J-48) with 10 fold cross validation method.
F. Performance Measurers
1) Accuracy, sensitivity and specificity: Firstly, there are four additional terms are used in computing many evaluation measures. A prediction always having the four different possible outcomes. The true positives (TP) and true negatives (TN) are correctly classified. A false positive (FP) occurs when the prediction result as incorrectly classified as yes (or positive) when it is actually no (negative). A false negative (FN) occurs when the prediction result as incorrectly predicted as no when it is actually yes. This study uses following equation to measure the accuracy Eq. 9, specificity Eq. 10, and sensitivity Eq. 11.
a) True positives (TP): The positive tuples that were correctly labelled by the classifier.
b) True negatives (TN): The negative tuples that were correctly labelled by the classifier.
c) False positives (FP): The negative tuples that were incorrectly labelled as positive.
d) False negatives (FN): The positive tuples that was miss-labelled as negative.
In this study, the following equations are used to measure the accuracy, sensitivity and specificity.
= ( ) (9)
= (10)
= (11)
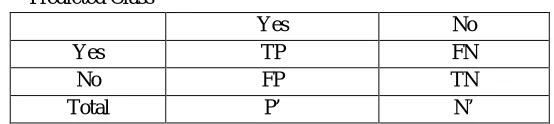
G. Confusion Matrix
[image:8.612.166.443.401.463.2]The confusion matrix is a useful tool or analysing how well a classifier can recognize tuples of different classes. The confusion matrix is in the form of table contains rows and columns. Rows define the actual class and columns represent the predicted class. TP and TN tell us when the classifier is predicting things right, while FP and FN tell us when the classifier is predicting things wrong. For a classifier that has good accuracy, ideally most of the tuples would be represented along the diagonal of the confusion matrix with the rest of the entries being zero or close to zero.
TABLE 2 Confusion Matrix Predicted Class
Actual Class
H. K-fold Cross Validation
In order to have a measure the performance of the classifier model, k-fold cross-validation method has been popular useful. This method trained and tested the classification algorithm for the specified K-times. In the most elementary form, cross validation consists of dividing the data into k subgroups. Each sub group is tested via classification rule constructed from the remaining (k - 1) groups. Thus the different k- test results are obtained for each train–test configuration.
For a k-fold cross validation, each single example occurs exactly (k-1) times as a training example. Hence, the time needed to compute the statistics of all test examples is reduced by a factor k-1 compared to running the original algorithm k times [26]. The time needed to sort examples into child nodes is reduced by k-1 if the same test is selected in all folds, otherwise a smaller reduction occurs. In this study, we used 10-fold cross-validation in the proposed model. It can reduce the bias associated with random sampling method.
Yes No
Yes TP FN
No FP TN
Fig. 1: Algorithmic model
V. EXPERIMENT RESULT AND ANALYSIS
[image:9.612.36.585.85.316.2]This study provides an efficient model to predict the risk of the diabetes in patients using mining techniques (clustering and classification) with better accuracy compare to the existing model. So for that to evaluate the performance of the model in order to make evidence that the result of this proposed model is better than other existing model using different measures parameters which already describe in section IV. These results include various performance measures parameters, including the ones that are integral to this thesis i.e. accuracy. To ensure that the model provide good result, so accuracy is the most common performance measure parameters to provide analysis among different existing models. In this study accuracy is the primary evaluation criteria for experiment the model. This study uses the optimization filer which remove the incorrectly or misclassified instances which provides the result to this model with better accuracy. This study analyses that accuracy is more than as compared other existing work by removing the miss-classified or incorrectly classified instances that means prediction rate is improved as compared to other models. In this way it can be said that this model provides better result. In this way, it can be said that model provides the better accuracy. This model provides a better accuracy in a way to increase the True Positive rate and decrease the false positive rate. Using the Weka tool kit, it was convent for us to study the result of the experiment through a visualize interface. In the present study, firstly replaced the missing values and impossible values by mean and then removed the incorrectly classified samples. After this step, we had 513 samples left. Finally applied the regression algorithm with 10 cross fold validation data set and get the final result with 98.64 % accuracy. According the confusion matrix, this study could give out the accuracy, sensitivity, and specificity of the proposed model are 98.64 %, 99 %, 96%. After that this model classified one or more classified algorithm such as- J- 48 algorithm then this model classified the instances with the accuracy 97.46%. It shows that this model give better accuracy with the logistic regression algorithm. Therefore, this study provides an efficient model to predict the result as diabetic patient or non-diabetic patient with the accuracy of the 98.64 %.
TABLE 3
CONFUSION MATRIX OF THE RESULT
Predicted class Actual class No Yes
No 377 3
Yes 4 129
Data Base (PIMA Indian Diabetes Data
Set)
Pre-processing
Un-Supervised classification
(K-Means algorithm)
Remove the Incorrectly Classified Data
Use data to evaluate predictive Model Performance
Evaluation
(Compare with J-48 tree algorithm) Research Conclusion
Supervised Classification
TABLE 4
PERFORMANCE OF THE PROPOSAL MODEL
S. No Parameter Value
1 Accuracy 98.64 %
2 Sensitivity 99.21%
3 Specificity 96%
5 Correctly Classified Instances 506 instances 6 Incorrectly Classified Instances 7 instances
7 Error 3.4811%
Fig. 2 Result of the Proposed Model
From the Fig. 2, represent the output of the regression hybrid model with better 98.64 % accuracy.
From the figure 3, after applying the decision tree algorithm this model shows the 97.46 % accuracy. Therefore, this model provides the better accuracy with the logistic regression algorithm.
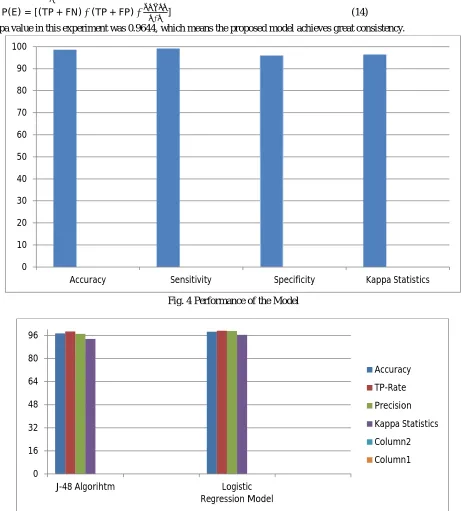
A. Kappa Statistics
It is a significant parameter to judge the consistency of the model. It computes the result of the proposed model. It compares the result of the proposed model with a result generated by the randomly classified method [27]. The value of the Kappa statistics was between 0 and 1. The value closer to 1 present the expected effect the model, while 0 represent invalid model. The equation of the Kappa statistics is shown in eq. 5.1, eq. 5.2, and eq. 5.3
K(A) = [P(A)−P(E)] 1⁄ −P(E) (12)
P(A) =( ) (13)
P(E) = [(TP + FN)∗(TP + FP)∗
∗ ] (14)
[image:11.612.74.535.209.720.2]The kappa value in this experiment was 0.9644, which means the proposed model achieves great consistency.
Fig. 4 Performance of the Model
Fig. 5 Comparison between the J-48 and Logistic Regression
0 10 20 30 40 50 60 70 80 90 100
Accuracy Sensitivity Specificity Kappa Statistics
0 16 32 48 64 80 96
J-48 Algorihtm Logistic
Regression Model
Accuracy
TP-Rate
Precision
Kappa Statistics
Column2
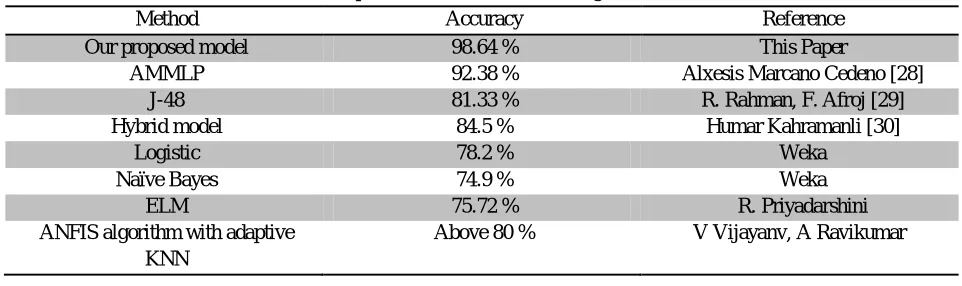
TABLE 5
Comparison with the other Existing Work
Method Accuracy Reference
Our proposed model 98.64 % This Paper
AMMLP 92.38 % Alxesis Marcano Cedeno [28] J-48 81.33 % R. Rahman, F. Afroj [29] Hybrid model 84.5 % Humar Kahramanli [30]
Logistic 78.2 % Weka
Naïve Bayes 74.9 % Weka
ELM 75.72 % R. Priyadarshini
ANFIS algorithm with adaptive KNN
Above 80 % V Vijayanv, A Ravikumar
VI. CONCLUSION AND FUTURE ENHANCEMENT
This research work has proposed a new approach for efficiently predicting the diabetes from medical records of patients. The Pima Indians Diabetes Data Set has been used for experimental purpose. It has come up with the information of patients with and without having diabetes. The modified J48 classifier has been used to increase the accuracy rate of the data mining procedure. The data mining tool WEKA has been used as an API of MATLAB for generating the modified J-48 classifiers. Experimental results have shown a significant improvement over the existing logistic regression algorithm. It has been proved that the proposed algorithm can achieve accuracy up to 98.64 %. This model attained better accuracy than j-48 decision algorithm.
There are also few aspects of this study that could be improved further or extended in the future. For instance, the proposed model is proposed to apply to Type 2 diabetes diagnosis which is a two-class classification problem. It would be interesting to see its behaviour on multi-class classification problems. The proposed model is applied to numeric data only; this study proposed model could improve to see its behaviour on different types of medical data, such as images and signals. Moreover, for practical implementation, future work is required to assess the effectiveness of the proposed method with a larger amount of data. The performance of reported classifier can be improved by using ensemble methods which can be taken as future work
REFERENCES
[1] S. A. Kaveeshwar and J. Cornwall, “The current state of diabetes mellitus in India”, Australas Medical Journal, (45–48), January 2014.
[2] Z. Punthakee, R. Goldenberg, “Definition, Classification and Diagnosis of Diabetes, Prediabetes and Metabolic Syndrome”, Canadian Journal of Diabetes”, Vol.42, (10-15), 2018.
[3] RA. Oram, K. Patel, A. Hill, “A type 1 diabetes genetic risk score can aid discrimination between type 1 and type 2 diabetes in young adults”, Diabetes Care, Vol. 337 (39–44), 2016.
[4] F. Aguiree, A. Brown, NH. Cho, “IDF Diabetes Atlas: sixth edition”, International Diabetes Federation, (81-97), 2013.
[5] W. Chen, S Chen, H. Zhang, “A Hybrid Prediction Model for Type 2 Diabetes Using K- Means and Decision Tree”, IEEE Explore, Vol. 17, 2017.
[6] V V. Vijayan and C. Anjali, “Decision Support System for predicting diabetes mellitus- a review, proceeding of Global Conference of communications technologies”, 2015.
[7] J P. Kandhasamy, S. Balamurali, “Performance Analysis of Classifier Models to Predict Diabetes Mellitus”, Procedia Computer Science, Vol. 47, (45-51), 2015.
[8] B M. Patil, R.C. Joshi, D. Toshniwal, “Hybrid Prediction Model for Type-2 Diabetic Patients”, Experts Sysystem with Applications, Vol. 37, (8102-8108), 2010.
[9] K. Sowjanya, “MobDBTEST: A Machine Learning based System for Predicting Diabetes risk using mobile device”, IEEE International Advance Computing Conference, 2015.
[10] G. Shi, S. Liu and D. Ye, “Design and Implementation of diabetes risk assessment model based on Mobile Things”, 2015, 7th International Conference on Information Technology in Medicine and Education.
[11] X H. Meng, Y X. Huang, D P. Rao, “Comparison of three data mining models for predicting diabetes or prediabetes by risk factors”, Kaohsiung Journal of Medical Sciences, Vol. 2, (29-93), 2013.
[12] K. Polat, S. Gunes, and A. Aslan, “ A cascade learning system for classification of diabetes disease: Generalized discriminant analysis and least square support vector machine” , Expert Systems with Applications, Vol. 34(1), ( 214–221), 2008.
[13] M. Durairaj, and G. Kalaiselvi, “ Prediction of diabetes using back propagation algorithm”, International Journal of Emerging Technology and Innovative Engineering, 2015.
[14] Lukmanto, R. Budi, and E. Irwansyah, “The Early Detection of Diabetes Mellitus (DM) Using Fuzzy Hierarchical Model”, Procedia Computer Science, Vol. 59, (312-319), (2015)
[16] H. Longfei, L. Senlin, “An Intelligent risk strartificatio model based on pair wise and size constrained K-means”, IEEE journal Biomedical Health Informatics, Vol. 12, (88-96), 2016
[17] A. Jovic, K. Bogunovic, “An overview of free software tools for general data mining”, International Convention on Information and Communication Technology, Electronics and Microelectronics IEEE, (1112-1117), 2014.
[18] A. Pavate, N. Ansari, “Risk prediction of disease complications in Type 2 diabetes patients using soft computing techniques”, International Conference on advances in Computing and Communications, 2015
[19] UCI Machine Learning Repository.https://archive.ics.uci.edu/ml/datasets/Pima+Indian+Diabetes.
[20] A k. Jain, “Data clustering: 50 years beyond K-means”, Pattern Recognition Letters, Vol. 31, (651-666), 2010
[21] T. Velmurugan “ Efficiency of k-Means and K-Medoids Algorithms for Clustering Arbitrary Data Points, International Journal of Computer Technology & Applications”, Vol. 5, (1758-1764), 2012
[22] G. Guojun, M. Chaoqu, W. Jianhong, “Data clustering theory algorithm and application”, American Standard Association -SIAM, (46-51), 2007.
[23] B R. Patel, K K. Rana, “A Survey on Decision Tree Algorithm for Classification”, International Journal of Engineering Development and Research, Vol. 2, (1– 5), 2014.
[24] J R. Quinlan, “C4.5 programs for machine learning San Mateo”, CA: Morgan Kaufmann Publishers, Vol. 8, (56-67), 1993.
[25] N V. Chawla, K W. Bowyer, L O. Hall, and W P. Kegelmeyer, “SMOTE: Synthetic minority over-sampling technique”, Journal of Artificial Intelligence Research (JAIR), Vol. 16, (321–357), 2002.
[26] ] E L. Mohamed, R. Linderm, G. Perriello, Di Daniele, S J. Poppl, A. De Lorenzo, (2002). “Predicting type 2 diabetes using an electronic nose-base artificial neural network analysis”, Diabetes Nutrition and Metabolism” Vol. 15(4), (215–221), 2002.
[27] K. Polat , S. Gunes, A. Aslan, “A cascade learning system for classification of diabetes disease: Generalized discriminant analysis and least square support vector machine”, Expert Systems with Applications, Vol. 34(1), (214–221), 2008.
[28] A M. Cedeno, T. Joaquin, A Diego, “A Prediction model to diabetes using artificial metaplasticity”, IWINAC, Vol. 45, P.418, 2011
[29] R. Rahman, F. Afroj, “Comparison of various classification techniques using different data mining tools for Diabetes diagnosis”, Journal of Software Engineering & Research, Vol. 3, (85-97), 2013.