Automatic Text Categorization
in Terms of Genre and Author
E f s t a t h i o s S t a m a t a t o s * University of Patras G e o r g e K o k k i n a k i s * University of Patras
N i k o s F a k o t a k i s t University of Patras
The two main factors that characterize a text are its content and its style, and both can be used as a means of categorization. In this paper we present an approach to text categorization in terms of genre and author for Modern Greek. In contrast to previous stylometric approaches, we attempt to take full advantage of existing natural language processing (NLP) tools. To this end, we propose a set of style markers including analysis-level measures that represent the way in which the input text has been analyzed and capture useful stylistic information without additional cost. We present a set of small-scale but reasonable experiments in text genre detection, author identification, and author verification tasks and show that the proposed method performs better than the most popular distributional lexical measures, i.e.,functions of vocabulary richness and frequencies of occurrence of the most frequent words. All the presented experiments are based on unrestricted text downloaded from the World Wide Web without any manual text preprocessing or text sampling. Various performance issues regarding the training set size and the significance of the proposed style markers are discussed. Our system can be used in any application that requires fast and easily adaptable text categorization in terms of stylistically homogeneous categories. Moreover, the procedure of defining analysis-level markers can be followed in order to extract useful stylistic information using existing text processing tools.
1. I n t r o d u c t i o n
The rapid expansion of the World Wide Web (WWW) in recent years has resulted in the creation of large v o l u m e s of text in electronic form. N L P applications such as i n f o r m a t i o n retrieval a n d i n f o r m a t i o n extraction h a v e b e e n d e v e l o p e d to treat this i n f o r m a t i o n automatically. Since the Internet is a v e r y h e t e r o g e n e o u s domain, these applications usually involve text categorization tasks w i t h the following desiderata:
• minimal c o m p u t a t i o n a l cost,
• ability to h a n d l e real-world (or unrestricted) text, a n d
• either ease of a d a p t a t i o n to a certain d o m a i n or application or generality in o r d e r to cover a w i d e range of d o m a i n s or applications.
* University of Patras, Department of Electrical & Computer Engineering, 26500 Patras, Greece. E-mail: [email protected].
t University of Patras, Department of Electrical & Computer Engineering, 26500 Patras, Greece. E-mail: [email protected].
Computational Linguistics Volume 26, Number 4
The two main factors that characterize a text are its content and its style, both of which can be used for categorization purposes. Nevertheless, the literature on compu- tational stylistics is very limited in comparison to the work dealing with the proposi- tional content of the text. This is due to the lack of a formal definition of style as well as to the inability of current NLP systems to incorporate stylistic theories that require complicated information. In contrast to traditional stylistics based on formal linguistic theories, the use of statistical methods in style processing has proved to be a reliable approach (Biber 1995). According to the stylostatisticians, a given style is defined as a set of measurable patterns, called
style markers.
We adopt this definition in this study.Typical classificatory tasks in computational stylistics are the following:
• Text genre detection concerns the identification of the kind (or functional style) of the text (Karlgren and Cutting 1994; Michos et al. 1996; Kessler, Nunberg, and Schi.itze 1997).
• Authorship attribution concerns the identification of the author of the text (Holmes and Forsyth 1995; Baayen, Van Halteren, and Tweedie 1996; Tweedie, Singh, and Holmes 1996).
These tasks have so far been considered completely separate problems. A typical text categorization system utilizing stylistic analysis (i.e., either text genre or authorship identification) is usually based on the following modules:
.
2.
Extraction of style markers:
A set of quantifiable measures are defined and a text-processing tool is usually developed, to automatically count them.Classification procedure:
A disambiguation method (e.g., statistical, connectionist, etc.) is applied to classify the text in question into a predefined category (i.e., a text genre or an author).The most important computational approaches to text genre detection have fo- cused on the use of simple measures that can be easily detected and reliably counted by a computational tool (Kessler, Nunberg, and Sch~itze 1997). To this end, various sets of style markers have been proposed (Karlgren and Cutting 1994), all of which are, in essence, subsets of the set used by Biber (1995), who ranked registers along seven di- mensions by applying factor analysis to a set of lexical and syntactic style markers that had been manually counted. In general, the current text genre detection approaches try to avoid using existing text processing tools rather than taking advantage of them. Authorship attribution studies have focused on the establishment of the authorship of anonymous or doubtful literary texts, such as the Federalist Papers, 12 of which are of disputed authorship (Mosteller and Wallace 1984; Holmes and Forsyth 1995). Typical methodologies deal with a limited number of candidate authors using long text samples of several thousand words. Almost all the approaches to this task are based mainly on distributional lexical style markers. In a review paper of authorship attribution studies, Holmes (1994) claims: "yet, to date, no stylometrist has managed to establish a methodology which is better able to capture the style of a text than that based on lexical items" (p. 87).
Stamatatos, Fakotakis, and Kokkinakis Text Categorization
In this paper we describe an approach to text categorization in terms of genre and author based on a new stylometric method that utilizes already existing NLP tools. In addition to the style markers relevant to the actual output of the NLP tool (i.e., the analyzed text), we introduce analysis-level style markers, which represent the w a y in which the text has been analyzed by that tool. Such measures contain useful stylistic information and are easily available without additional computational cost.
To illustrate, we apply the proposed technique to text categorization tasks for Mod- ern Greek corpora using an already existing sentence and chunk boundaries detector (SCBD) in unrestricted Modern Greek text (Stamatatos, Fakotakis, and Kokkinakis 2000). We present a set of small-scale but reasonable experiments in text genre detec- tion, author identification, and author verification tasks and show that the performance of the proposed method is better in comparison with the most popular distributional lexical measures, i.e., functions of vocabulary richness and frequencies of occurrence of the most frequent words. Our approach is trainable and can be easily adapted to any set of stylistically homogeneous categories.
We begin by discussing work relevant to text genre detection and authorship attri- bution focusing on the various types of style markers employed (Section 2). Next, we describe the proposed solution for extracting style markers using already existing NLP tools (Section 3) and apply our method to Modern Greek (Section 4), briefly describing the SCBD and proposing our set of style markers. The techniques used for automatic categorization of the stylistic vectors are discussed in Section 5. Section 6 deals with the application of our approach to text genre detection, and Section 7, with authorship attribution, for both author identification and author verification. In Sections 8 and 9, we discuss important performance issues of the proposed methodology and the conclusions that can be drawn from this study.
2. Current Trends in Stylometry
The main feature that characterizes both text genre detection and authorship attri- bution studies is the selection of the most appropriate measures, namely, those that reflect the style of the writing. Various sets have been proposed in the literature. In this section, we classify the most popular of the proposed style markers, taking into account the information required for their calculation rather than the task they have been applied to.
2.1 Token-Level Measures
The simplest approach considers the sample text as a set of tokens grouped in sen- tences. Typical measures of this category are word count, sentence count, character per word count, and punctuation marks count. Such features have been widely used in both text genre detection and authorship attribution research since they can be easily detected and computed. It is worth noting that the first pioneering works in author- ship attribution, when no powerful computational systems were available, were based exclusively on these measures. For example, Morton (1965) used sentence length for testing the authorship of Greek prose, Brinegar (1963) adopted word length measures, and Brainerd's (1974) approach was based on distribution of syllables per word. Al- though such measures seemed to work in specific cases, they became subject to heavy criticism for their lack of generality (Smith 1983, 1985).
2.2 Syntactic Annotation
Computational Linguistics Volume 26, Number 4
of the characteristics of style (Biber 1995). Typical paradigms are passive count, nom- inalization count, and counts of the frequency of various syntactic categories (e.g., part-of-speech tags). Recently, syntactic information has also been applied to author- ship attribution. Specifically, Baayen, Van Halteren, and Tweedie (1996) used frequen- cies of occurrence of rewrite rules as they appear in a syntactically annotated corpus and proved that they perform better than word frequencies. Their calculation requires tagged or parsed text, however. Current NLP tools are not able to provide accurate calculation results for m a n y of the previously proposed style markers. In the study of register variation conducted by Biber (1995), a subset of the measures (i.e., the simplest ones) was calculated by computational tools and the remaining were counted manu- ally. Additionally, the automatically acquired measures were counterchecked manually. Many researchers, therefore, try to avoid the use of features related to syntactic an- notation in order to avoid such problems (Kessler, Nunberg, and Sch~itze 1997). As a result, the recent advances in computational linguistics have not notably affected research in computational stylistics.
2.3 Vocabulary Richness
Various measures have been proposed for capturing the richness or the diversity of the vocabulary of a text and they have been applied mainly to authorship attribution studies. The most typical measure of this category is the type-token ratio
V/N,
where V is the size of the vocabulary of the sample text, and N is the number of tokens of the sample text. Similar features are the hapax legomena (i.e., words occurring once in the sample text) and the dislegomena (i.e., words occurring twice in the sample text). Since text length dramatically affects these features, many researchers have pro- posed functions of these features that they claim are text length independent (Honor6 1979; Yule 1944; Sichel 1975). Additionally, instead of using a single measure, some researchers have used a set of such vocabulary richness functions in combination with multivariate statistical techniques to achieve better results in authorship attribution (Holmes 1992). In general, these measures are not computationally expensive. How- ever, according to results of recent studies, the majority of the vocabulary richness functions are highly text length dependent and quite unstable for texts shorter than 1,000 words (Tweedie and Baayen 1998).2.4 Common Word Frequencies
Stamatatos, Fakotakis, and Kokkinakis Text Categorization
NCPtoo,
A ,ys,s
I
i
measures
J
L.
measures j
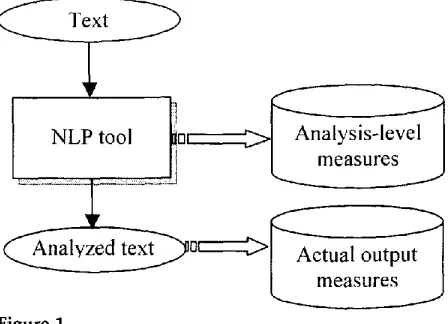
Figure 1
The proposed method.
The application of a principal components analysis on the frequencies of occurrence of the most frequent words achieved remarkable results in plotting the texts in the space of the first two principal components, for a wide variety of authors (Burrows 1992). This approach is language independent and computationally inexpensive. Vari- ous additional restrictions to this basic method have been proposed (e.g., separation of common homographic forms, removal of proper names from the most frequent word list, etc.), aimed at improving its performance. For a fully automated system, such restrictions require robust and accurate NLP tools.
3. The Proposed Method
Our method attempts to exploit already existing NLP tools for the extraction of stylistic information. To this end, we use two types of measures, as can be seen in Figure 1:
• measures relevant to the actual output of the NLP tool (i.e., usually tagged or parsed text), and
• measures relevant to the particular methodology by which the NLP tool analyzes the text (analysis-level measures).
Thus, the set of style markers is adapted to a specific, already existing NLP tool, taking into account its particular properties. Analysis-level measures capture useful stylistic information without additional cost. The NLP tool is not considered a black box. Therefore, full access to its source code is required in order to define and measure analysis-level style markers. Moreover, tool-specific knowledge, rather than language- specific knowledge, is required for the definition of such measures. In other words, researchers using this approach can define analysis-level measures based on their deep understanding of a particular NLP tool even if they are not familiar with the natural language to which the methodology is to be applied.
[image:5.468.40.264.56.218.2]Computational Linguistics Volume 26, Number 4
we use a set of analysis-level features, i.e., measures that represent the w a y in which the input text has been analyzed by the SCBD.
The particular analysis-level style markers can be calculated only when this specific computational tool is utilized. However, the SCBD is a general-purpose tool and was not designed for providing stylistic information exclusively. Thus, any NLP tool (e.g., part-of-speech taggers, parsers, etc.) can provide similar measures. The appropriate analysis-level style markers have to be defined according to the methodology used by the tool in order to analyze the text. For example, some similar measures have been used in stylistic experiments in information retrieval on the basis of a robust parser built for information retrieval purposes (Strzalkowski 1994). This parser produces trees to represent the structure of the sentences that compose the text. However, it is set to "skip" or surrender attempts to parse clauses after reaching a time-out threshold. When the parser skips, it notes that in the parse tree. The measures proposed by Karlgren (1999) as indicators of clausal complexity are the average parse tree depth and the number of parser skips per sentence, which in essence are analysis-level style markers.
4. Style Markers for Modem Greek
As mentioned above, the subset of style markers used for Modern Greek depends on the text analysis by the specific NLP tool, the SCBD. Thus, before describing the set of style markers we used, we briefly present the main features of the SCBD.
4.1 Description of the SCBD
The SCBD is a text-processing tool able to deal with unrestricted Modern Greek text. No manual preprocessing is required. It performs the following procedures:
Sentence boundary detection: The following punctuation marks are considered potential sentence boundaries: period, exclamation point, question mark, and ellipsis. A set of automatically acquired
disambiguation rules (Stamatatos, Fakotakis, and Kokkinakis 1999) is applied to every potential sentence boundary in order to locate the actual sentence boundaries. These rules utilize neither lexicons with specialized information nor abbreviation lists.
Chunk boundary detection: Intrasentential phrase detection is achieved through multiple-pass parsing making use of an approximately
Stamatatos, Fakotakis, and Kokkinakis Text Categorization
Unrestricted Text
i,
Sentence Boundary I:!
Detection II
. . .
Assignment of ~ t_.._._.__._._.l Morphological Descriptions H
~_ ~ = ~ ... ~ . . . ~,X~K~yv~r~ts I
I
Multiple-Pass Parsing ~ [-_.._.______.J [image:7.468.39.252.51.242.2]Parsed Text
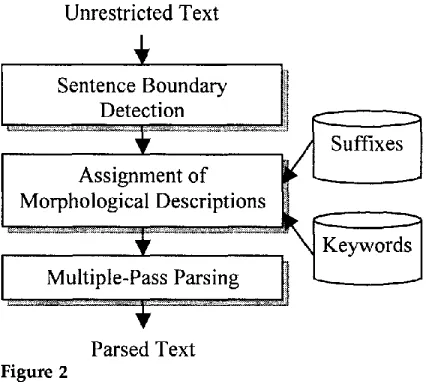
Figure 2
The SCBD structure.
prepositional phrases (PPs), verb phrases (VPs), and adverbial phrases (APs). In addition, two chunks are usually connected by a sequence of conjunctions (CONs).
The SCBD is able to cope rapidly with any piece of text, even ill-formed text, and its performance is comparable to more sophisticated systems that require more com- plicated resources. Figure 2 gives an overview of the SCBD. An example of its output for a sample text, together with a rough English translation (included in parentheses), is given below (note that special words, those that do not match with any of the stored suffixes, are marked with an asterisk):
VP[&eu 0gAco uoz pg{oo (I don't want to pour)] NP[A&& (oil)] PP[crrr/9~wr~& (in the fire)] CON[of&kale (but)] VP[rr~¢re4a; (I believe)] CON[drL (that)] NP[r/
err~fldpvu~rr/(the encumbrance)] PP[o-rou rrpo~rcoko7Lcr#6 (of the budget)] PP[ozrr6 rov¢ flov&evrg¢ (by the deputies)] VP[&u #rcopeg uce rrpoe#erpeirc~L (can not be measured)] #6uo (merely) PP[#e rc~ 5*&¢.*6px. rcou c~uc,Spo#~n&u (with the 5 bil. Dr. of the retroactive salaries)] troy (that) NP[rc~po~u re&evrcdc~ (they took lately)] VP[rrponc~&cburc~¢ (causing)] NP[rr/(Sva~op&~ r~]g ~oLu~¢ 7v,&#r/~ (the discontent of the public opinion)].
It is worth noting that we did not modify the structure of the SCBD in order to calculate style markers, aside from adding simple functions for their measurement.
4.2 Stylometric Levels
Our aim during the definition of the set of style markers was to take full advantage of the analysis of the text by the SCBD. To this end, we included measures relevant to the actual output of this tool as well as measures relevant to the methodology used by the SCBD to analyze the text. Specifically, the proposed set of style markers comprises three levels:
•
Token Level:
The sample text is considered as a set of tokens grouped inComputational Linguistics Volume 26, Number 4
detector: Code M01 M02 M03
Description
detected sentences/words 1 punctuation m a r k s / w o r d s
detected sentences/potential sentence boundaries
Phrase Level: The sample text is considered as a set of phrases (i.e., chunks). This level is based on the output of the chunk boundary detector:
Code M04 M05 M06 M07
M08
M09 M10 M l l M12 M13
Description
detected NPs/total detected chunks detected VPs/total detected chunks detected APs/total detected chunks detected PPs/total detected chunks detected CONs/total detected chunks words included in N P s / d e t e c t e d NPs words included in VPs/detected VPs words included in APs/detected APs words included in PPs/detected PPs words included in C O N s / d e t e c t e d CONs
Analysis Level: Measures that represent the w a y in which the sample text has been analyzed by the particular methodology of the SCBD are included here:
Code M14
M15 M16 M 1 7 M18 M19 M20 M21 M 2 2
Description
detected k e y w o r d s / w o r d s special w o r d s / w o r d s
assigned morphological descriptions/words
chunks' morphological descriptions/total detected chunks words remaining unanalyzed after pass 1 / w o r d s
words remaining unanalyzed after pass 2 / w o r d s words remaining unanalyzed after pass 3 / w o r d s words remaining unanalyzed after pass 4 / w o r d s words remaining unanalyzed after pass 5 / w o r d s
It is clear that the analysis level contains extremely useful stylistic information. For example, M14 and M15 are valuable markers that indicate of the percentage of high- frequency words and the percentage of unusual words included in the sample text, respectively. M16 is a useful indicator of the morphological ambiguity of the words and M17 indicates the degree to which this ambiguity has been resolved. Moreover, markers M18 to M22 indicate the syntactic complexity of the text. Since the first parsing passes analyze the most common cases, it is easy to understand that a large part of a syntactically complicated text w o u l d not be analyzed by them (e.g., high values for M18, M19, and M20 in conjunction with low values for M21 and M22). Similarly, a syntactically simple text w o u l d be characterized by low values for M18, M19, and M20.
Stamatatos, Fakotakis, and Kokkinakis Text Categorization
Note that all the proposed style markers are produced as ratios of two relative measures in order for them to be stable over the text length. However, they are not standardized.
5. Text Categorization
The methodology described in the previous section provides a vector of 22 variables for each text. For automatically classifying this vector into one group (either genre or author) various techniques are available, which stem from multivariate statistics (e.g., discriminant analysis), neural networks, and machine learning (e.g., decision trees). Recently, Yang (1999) studied the performance of several classifiers on text categoriza- tion tasks and concluded that all the tested methods perform comparably when the training set comprises over 300 instances per category. On the other hand, when the number of positive training instances per category is small (less than 10) a regression- like method called linear least-squares fit and k-nearest neighbors outperform neural networks and naive Bayes classifiers (Yang and Liu 1999).
In the present paper we used two well-known techniques of multivariate statistics: multiple regression and discriminant analysis. The response of these techniques is very fast since they are based on the calculation of simple linear functions. Moreover, their training procedures do not require excessive time or computational cost. Thus, they can be easily incorporated into a real-time application.
5.1 Multiple Regression
Multiple regression predicts values of a group of
response
(dependent) variables from a collection ofpredictor
(independent) variable values (Edwards 1979). The response is expressed as a linear combination of the predictor variables, namely:y i = bo + z~bli + z 2 b 2 i + • " q- zrbri q- ei
where yi is the response for the ith category (i.e., text genre), Zl, z2,... , Zr are the pre- dictor variables (i.e., in our case r = 22), b0, bli, b2i . . . bri, are the unknown coefficients
calculated during the training procedure, and ei is the random error. An indication of the goodness of fit of the model is provided by the coefficient of determination, R 2, defined as follows:
n
R 2 _ j = l y/
E (yj - 9)
j = l
where n is the total amount of the training data (texts), 9 is the mean response, and finally, ~j and yj are the estimated response and the training response value, respec- tively. R 2 equals 1 if the fitted equation passes through all the data points, and, at the other extreme, equals 0.
Moreover, multiple regression can also be used for the estimation of the signifi- cance of the independent variables. In particular, the amount by which R 2 is reduced if
a certain independent variable is deleted from the regression equation (in other words, the contribution of the independent variable to R 2) is represented by the squared semi- partial correlation sri 2 (Tabachnick and Fidell 1996):
sr~ = t~ (1 - a 2)
Computational Linguistics Volume 26, Number 4
where ti is the value of the t statistic for the ith variable and dffr¢~ are the residual degrees of freedom. Thus, the contribution of an independent variable to R 2 can be expressed as a function of the absolute value of t. The absolute t value of the jth estimated regression coefficient bj is calculated as follows:
bj
tbj = S--~
where Sb i is the standard error. The greater the t value, the more important the con- tribution of the independent variable (i.e., style marker) to the response value. 5.2 Discriminant Analysis
The mathematical objective of discriminant analysis is to weight and linearly com- bine the discriminating variables in some w a y so that the groups are forced to be as statistically distinct as possible (Eisenbeis and Avery 1972). The optimal discriminant function, therefore, is assumed to be a linear function of the variables and is deter- mined by maximizing the between-group variance while minimizing the within-group variance using a training sample.
Discriminant analysis can be used for predicting the group membership of pre- viously unseen cases (i.e., test data) based on Mahalonobis distance (i.e., a measure of distance between two points in the space defined by multiple correlated variables). Initially, for each group, the location of the centroids, i.e., the points that represent the means for all variables in the multivariate space defined by the independent vari- ables, is determined. Then, for each case the Mahalanobis distances from each of the group centroids are computed and the case is classified into the closest group. The Mahalanobis distance d of a vector x from a mean vector mx is given by the formula:
d 2 = ( x - mx)'C~-l(x - m x )
where Cx is the covariance matrix of x. Using this classification method we can also derive the probability that a case belongs to a particular group (i.e., posterior proba- bilities), which is roughly proportional to the Mahalanobis distance from that group centroid. Discriminant analysis has been employed by researchers in automatic text genre detection (Biber 1993b; Karlgren and Cutting 1994) since it offers a simple and robust solution despite the fact that it presupposes normal distributions of the dis- criminating variables.
6. Text Genre Detection
6.1 Genre-based Corpus
Since no Modern Greek corpus covering a wide range of text genres was available, we decided to compose one from scratch. The corpus used in experiments in Michos et al. (1996) includes a limited number of carefully selected and manually edited texts divided into generic categories (e.g., journalistic, scientific, etc.). In general, the use of already existing corpora not built for text genre detection (e.g., the Brown corpus) raises several problems since such categories m a y not be stylistically homogeneous (Kessler, Nunberg, and Schiitze 1997). The corpus used in our study contains texts that meet the following criteria:
Stamatatos, Fakotakis, and Kokkinakis Text Categorization
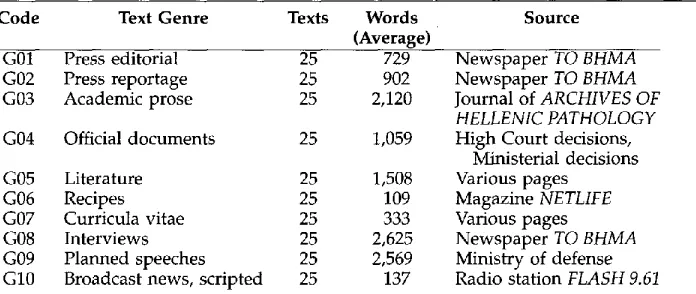
Table 1
The genre-based corpus.
Code Text Genre Texts Words Source
(Average)
G01 Press editorial 25 729
G02 Press reportage 25 902
G03 Academic prose 25 2,120
G04 Official documents 25 1,059
G05 Literature 25 1,508
G06 Recipes 25 109
G07 Curricula vitae 25 333
G08 Interviews 25 2,625
G09 Planned speeches 25 2,569 G10 Broadcast news, scripted 25 137
Newspaper TO B H M A
Newspaper TO B H M A
Journal of ARCHIVES OF HELLENIC PATHOLOGY
High Court decisions, Ministerial decisions Various pages
Magazine NETLIFE
Various pages
Newspaper TO B H M A
Ministry of defense Radio station FLASH 9.61
• R a w text: Neither manually inserted tags nor other manual
text-preprocessing restrictions are set.
• Whole text: Neither text length limitations nor other manual
text-sampling restrictions are set. In other words, a text has to be available as it appears in its source.
We constructed a corpus by downloading texts from various WWW sites edited in Modern Greek, trying to cover as m a n y genres as possible. This corpus is shown in Table 1. Although the complete set of text genres may differ significantly among two languages (Biber 1995), they usually overlap to a great extent, especially for Indo- European languages. The set we propose, therefore, can be compared to the ones used in similar studies of English (Karlgren and Cutting 1994; Biber 1995). Additionally, no manual preprocessing was performed aside from removing unnecessary headings irrelevant to the text itself.
It must also be pointed out that the last three text genres (i.e., G08, G09, and G10) refer to spoken language that has been transcribed either before (i.e., planned speeches, broadcast news) or after (i.e., interviews) it has been uttered. On the other hand, G01 to G07 refer to written language.
The genre-based corpus was divided into a training part and a test part of equal size. Ten texts per genre were included in the training corpus and ten texts per genre were included in the test corpus. The remaining five texts per genre were used only in the experiments described in Section 7.
6.2 Setting the Baseline
To evaluate the proposed approach, we decided to apply two previous stylometric ap- proaches that are based on distributional lexical measures to the same testing ground: (i) a multivariate model of functions of vocabulary richness (Holmes 1992) and (ii) the frequencies of occurrence of the most frequent words (Burrows 1992). These two meth- ods were selected since they are language independent and computationally inexpen- sive.
[image:11.468.37.385.88.235.2]Computational Linguistics Volume 26, Number 4
defined as follows:
10 4 (Ei~__i i 2 W i - N )
K =
N 2
(1001ogN) R -
(1 - ( ~ - ) )
W = N v - ~
V2
S -
V
V i ( i - 1)
D = Z.-,
'NTlqL-i'~
i=1 " "
where V i is the number of words used exactly i times (see Section 2.3 for the defini- tion of V and N) and o~ is a parameter usually fixed at 0.17. The same set of func- tions has been used by Baayen and his colleagues for similar purposes (Baayen, Van Halteren, and Tweedie 1996). For every text, these functions are calculated and a vec- tor of five parameters is produced. These vectors can then be classified to the most likely genre b y applying one of the classification techniques discussed in the previ- ous section. Hereafter, this approach will be called VR (which stands for vocabulary richness).
The second method, which is lexically based, uses the frequencies of occurrence of the most frequent words of the training corpus as style markers. Typically, sets of 30 or 50 most frequent words are used (Baayen, Van Halteren, and Tweedie 1996; Holmes and Forsyth 1995). For comparison purposes, we employed two sets of common words based on 30 and 50 most frequent words of the training corpus, respectively. Thus, for each text a vector of 30 (or 50) parameters indicating the frequencies of the most frequent words of the training corpus (normalized by the text length) are calculated. As above, these vectors can then be classified to the most likely genre. These two approaches will be called CWF-30 and CWF-50 for common word frequencies and the number of the high-frequency words.
6.3 Results
The entire corpus described in the previous section was analyzed b y the SCBD, which automatically provided a vector of 22 parameters for each text. The vectors of the train- ing corpus were used in order to extract the classification model using both multiple regression and discriminant analysis. These classification models were then applied to the vectors of the test corpus for cross-validating their performance on unseen cases. The same training and test procedure was performed for the VR approach and for the CWF-30 and CWF-50 methods.
[image:12.468.179.301.68.202.2]Stamatatos, Fakotakis, and Kokkinakis Text Categorization
Our approach V R C W F - 5 0 C W F - 3 0
[ ] Discriminant analysis • Multiple regression
0.44 • . . . ,,,, i i i,i l 0 . 4 1
0.22
. . I 0.2]
0.22 1 0.22
0 0.1 0.2 0.3 0.4
I d e n t i f i c a t i o n e r r o r Figure 3
Comparative results for text genre detection.
0.5
Table 2
The text genre detection results.
Identification Error
Code Multiple Regression Discriminant Analysis
G01 0.7 0.4
G02 0.2 0.1
G03 0.0 0.0
G04 0.1 0.2
G05 0.1 0.4
G06 0.0 0.0
G07 0.4 0.4
G08 0.1 0.0
G09 0.2 0.2
G10 0.0 0.1
Average 0.18 0.18
gression w e r e caused b y G01 a n d G07, while 65% of the identification errors using discriminant analysis w e r e caused b y G01, G05, a n d G07. O n the other h a n d , G04, G06, G08, a n d G10 are stylistically h o m o g e n e o u s to a great extent in b o t h cases.
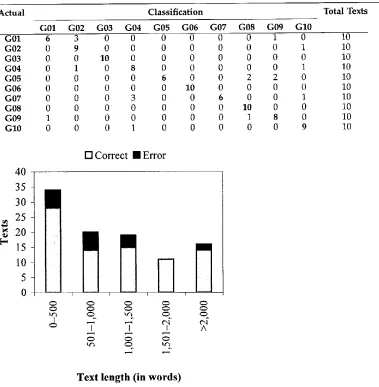
The complete identification results of o u r m e t h o d using discriminant analysis are p r e s e n t e d in a confusion matrix in Table 3. Each r o w represents a text genre b e i n g tested a n d the c o l u m n s represent the classification results of the test texts of that particular genre. The m a i n misclassifications are as follows:
• press editorial ~ press reportage. Notice that the texts w e r e taken f r o m the
same n e w s p a p e r , w h i c h is p u b l i s h e d on a w e e k l y basis. In m a n y cases, therefore, the reportage d o c u m e n t s r e v i e w a w h o l e w e e k a n d present some c o m m e n t s b y the author.
• curricula vitae --~ official documents. Both are usually characterized b y an
abstract style.
• literature ~ i n t e r v i e w s and p l a n n e d speeches. These t w o text genres of the
[image:13.468.35.351.49.200.2] [image:13.468.35.420.59.332.2]Computational Linguistics Volume 26, Number 4
Table 3
Confusion matrix for text genre detection using discriminant analysis.
Actual Classification
G01 G02 G03 G04 G05 G06 G07 G08 G09 G10
Total Texts
G01 6 3 0 0 0 0 0 0 1
G02 0 9 0 0 0 0 0 0 0
G03 0 0 10 0 0 0 0 0 0
G04 0 1 0 8 0 0 0 0 0
G05 0 0 0 0 6 0 0 2 2
G06 0 0 0 0 0 10 0 0 0
G07 0 0 0 3 0 0 6 0 0
G08 0 0 0 0 0 0 0 10 0
G09 1 0 0 0 0 0 0 1 8
G10 0 0 0 1 0 0 0 0 0
0 10
1 10
0 10
1 10
0 10
0 10
1 10
0 10
0 10
9 10
40 35 30 25 20 15 10 5 0
t.¢3
I
[] Correct • Error
I I A
T e x t l e n g t h ( i n w o r d s ) Figure 4
Text length related to accuracy for the text genre detection experiment.
N o t e that s p o k e n l a n g u a g e text genres (i.e., G08-G10) h a v e a l o w e r identification error rate, on a v e r a g e (0.10), t h a n w r i t t e n l a n g u a g e text genres (0.21) as calculated b y either m u l t i p l e regression or d i s c r i m i n a n t analysis.
[image:14.468.41.424.80.473.2] [image:14.468.49.428.83.470.2]Stamatatos, Fakotakis, and Kokkinakis Text Categorization
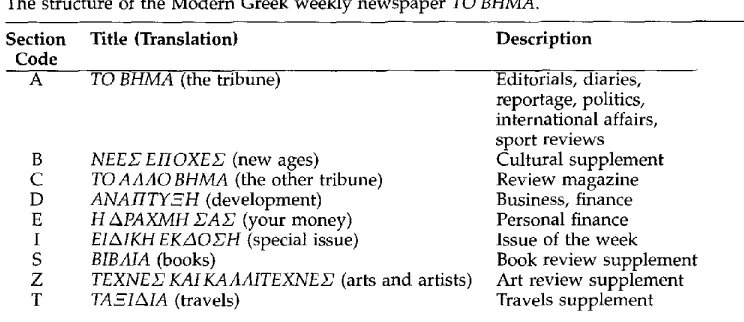
Table 4
The structure of the Modern Greek weekly newspaper TO BHMA.
Section Title (Translation) Description
Code
A TO BHMA (the tribune)
B C D E I S Z T
NEEX' E I I O X E E (new ages) T O A A A O B H M A (the other tribune) A N A F i T Y ~ H (development) H & P A X M H Z A Z (your money) EI&IKH EKZ~O Z H (special issue) BIBAIA (books)
TEXNE22KAIKAAAITEXNEZ~ (arts and artists) TA~I,~IA (travels)
Editorials, diaries, reportage, politics, international affairs, sport reviews Cultural supplement Review magazine Business, finance Personal finance Issue of the week Book review supplement Art review supplement Travels supplement
7. Authorship Attribution 7.1 Author-based Corpus
In authorship attribution experiments we chose to deal with texts taken from news- papers, since a wide variety of authors frequently publish their writings in the press, making the collection of a considerable number of texts for several authors easier. In particular, the corpus used for this study comprises texts downloaded from the WWW site of the Modern Greek weekly newspaper T O B H M A , (the tribune).2 The structure of this newspaper is shown in Table 4. We performed experiments based on two groups of authors, namely:
.
2.
Group A: Ten randomly selected authors whose writings are frequently found in section A. This section comprises texts written mainly by journalists on a variety of current affairs. Moreover, a certain author may sign texts from different text genres (e.g., editorial, reportage, etc.). Note that in many cases such writings are highly edited to conform to a predefined style, thus washing out specific characteristics of the authors, which complicates the task of attributing authorship.
Group B: Ten randomly selected authors whose writings are frequently found in section B. This supplement comprises essays on science, culture, history, and so on, in other words, writings in which the idiosyncratic style of the author is not overshadowed by functional objectives. In general, the texts included in the B section are written by scholars, rather than journalists.
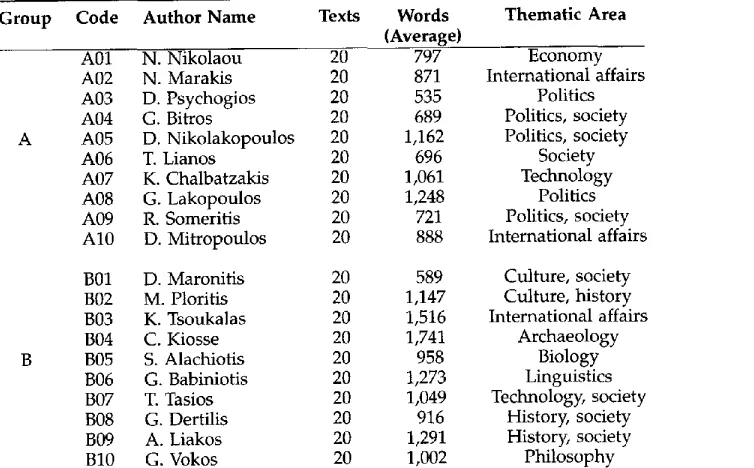
Analytical information on the author-based corpus is in Table 5. All the downloaded texts were taken from issues published during 1998 in order to minimize the potential change of the personal style of an author over time. The last column of this table refers to the thematic area of the majority of the writings of each author. This information was not taken into account during the construction of the corpus. The author-based
[image:15.468.34.406.79.240.2]Computational Linguistics Volume 26, Number 4
Table 5
The author-based corpus.
Group Code Author Name Texts Words Thematic Area (Average)
A
A01 N. Nikolaou 20 797 Economy
A02 N. Marakis 20 871 International affairs
A03 D. Psychogios 20 535 Politics
A04 G. Bitros 20 689 Politics, society
A05 D. Nikolakopoulos 20 1,162 Politics, society
A06 T. Lianos 20 696 Society
A07 K. Chalbatzakis 20 1 , 0 6 1 Technology
A08 G. Lakopoulos 20 1,248 Politics
A09 R. Someritis 20 721 Politics, society A10 D. Mitropoulos 20 888 International affairs
B01 D. Maronitis 20 589 Culture, society B02 M. Ploritis 20 1,147 Culture, history B03 K. Tsoukalas 20 1,516 International affairs B04 C. Kiosse 20 1 , 7 4 1 Archaeology
B05 S. Alachiotis 20 958 Biology
B06 G. Babiniotis 20 1 , 2 7 3 Linguistics B07 T. Tasios 20 1,049 Technology, society
B08 G. Dertilis 20 916 History, society
B09 A. Liakos 20 1,291 History, society
B10 G. Vokos 20 1 , 0 0 2 Philosophy
corpus was divided into a training part and a test part of equal size (i.e., 10 texts per author for training and 10 texts per author for test).
7.2 A u t h o r Identification
As for the text genre detection experiment, the entire corpus was first analyzed auto- matically by the SCBD. We then used the stylistic vectors of the training corpus to train the classification model for each group separately, based on multiple regression and discriminant analysis. We cross-validated the acquired models by applying them to the test corpus of the corresponding group. The same procedure was followed based on the VR, CWF-30, and CWF-50 approaches. Comparative results in terms of the identification error rate for groups A and B are given in Figures 5 and 6, respectively. As in the case of text genre detection, the VR method achieved far lower accuracy results than the others. The performance of the CWF-30 and CWF-50 is significantly better in group B than in group A. In both groups, our approach achieved the best performance.
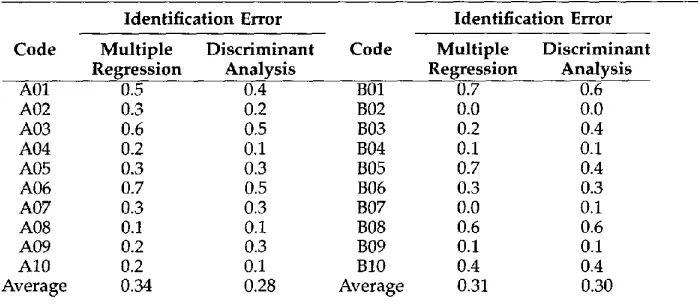
The identification error rates of our approach using both multiple regression and discriminant analysis are presented in Table 6. For group A, there are significant dif- ferences in the accuracy of the two techniques. However, three authors (A01, A03, and A06) are responsible for approximately 50% of the average error rate, probably because the average text length of these authors is relatively short, i.e., shorter than 800 words (see Table 5).
[image:16.468.47.424.90.324.2]Stamatatos, Fakotakis, and Kokkinakis Text Categorization
[] D i s c r i m i n a n t analysis • Multiple regression O u r a p p r o a c h
V R C W F - 5 0 C W F - 3 0
0.34
:ili,, I I),28
. . . L . . . . = .... . . . l l J l l ~ $
I i I I i i
0 0.1 0.2 0.3 0.4 0.5 0.6 0.7 I d e n t i f i c a t i o n e r r o r
Figure 5
Comparative results for authorship identification in group A.
O u r a p p r o a c h V R C W F - 5 0 C W F - 3 0
[] D i s c r i m i n a n t analysis • Multiple regression 0 . 3 1
0 . 3
0 . 3 5
10.35
i i i J
0 0.1 0.2 0.3 0.4 0.5
I d e n t i f i c a t i o n e r r o r Figure 6
Comparative results for authorship identification in group B.
0.6
Table 6
The author identification results for both group A and group B. Identification Error
Code Multiple Discriminant Code Regression Analysis
Identification Error Multiple Discriminant Regression Analysis
A01 0.5 0.4 B01
A02 0.3 0.2 B02
A03 0.6 0.5 B03
A04 0.2 0.1 B04
A05 0.3 0.3 B05
A06 0.7 0.5 B06
A07 0.3 0.3 B07
A08 0.1 0.1 B08
A09 0.2 0.3 B09
A10 0.2 0.1 B10
Average 0.34 0.28 Average
0.7 0.6
0.0 0.0
0.2 0.4
0.1 0.1
0.7 0.4
0.3 0.3
0.0 0.1
0.6 0.6
0.1 0.1
0.4 0.4
[image:17.468.71.370.59.213.2] [image:17.468.73.366.260.414.2] [image:17.468.34.383.502.654.2]Computational Linguistics Volume 26, Number 4
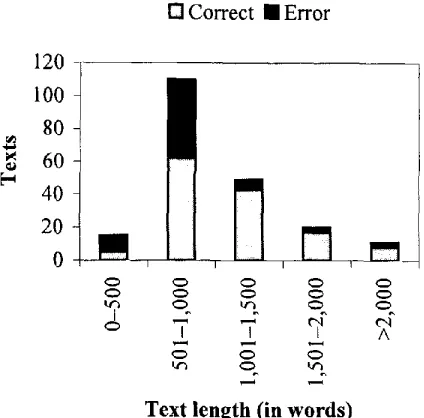
[] Correct • Error 120
100 80
60 ~D
[image:18.468.51.263.53.262.2]40 20
Figure 7
o I ~ A
t¢3 O hr~
Text length (in words)
Text length related to accuracy for the author identification experiments.
It seems, therefore, that text length is a crucial factor in identifying the stylistic features that characterize a certain author. Classification accuracy for both groups us- ing multiple regression related to text length is presented in more detail in Figure 7. Approximately 80% (i.e., 53 out of 65) of the total erroneously classified texts are shorter than 1,000 words. Moreover, the accuracy results for the two groups are com- parable. In fact, the best results have been achieved under discriminant analysis for group A. This fact verifies that the proposed set of style markers is capable of captur- ing the underlying stylistic features that characterize the author of a text even when dealing with texts taken from various text genres. Note that CWF-30 and CWF-50 failed to achieve comparable performance for groups A and B.
7.3 Author Verification
Instead of trying to select the most likely author of a given text from among a given group of authors (i.e., the author identification problem), m a n y applications require the confirmation (or rejection) of the hypothesis that a given person is the author of the text (i.e., the author verification problem). In such cases, the classification procedure is less complicated since there are only two possible answers: yes, i.e., the author in question is indeed the person who wrote the text, or no, i.e., the text was not written by this person.
Implementing an automatic author verification system requires:
The development of a response function for a given author. For a given text, this function must provide a response value based on the vector of the style markers of the text.
Stamatatos, Fakotakis, and Kokkhlakis Text Categorization
- - FR . . . FA . . . . Mean 1
0.9 0.8 0.7 0.6 0.5 0.4 0.3 0.2 0.1
0 P I I - - I " . . . i [ ~ " " " i . . . ?" . . . . J
0 0.1 0.2 0.3 0.4 0.5 0.6 0.7 0.8 0.9 1 x R
Figure 8
FR, FA, and mean error for group A related to threshold values expressed as subdivisions of R.
Additionally, for measuring the accuracy of the author verification method for a given author, False Rejection (FR) and False Acceptance (FA) can be used. These measures are commonly used in the area of speaker verification in speech processing (Fakotakis, Tsopanoglou, and Kokkinakis 1993) and are defined as follows:
FR = rejected texts of the author~total texts of the author FA = accepted texts of other authors~total texts of other authors
In our study, we used the response functions taken from the application of multiple regression to group A and group B, as described in the previous section. The selection of a threshold value, on the other hand, is highly dependent on the application. Some applications require either minimal FR or minimal FA, while others require minimal mean error, i.e., (FR + FA)/2.
[image:19.468.45.332.51.261.2]Computational Linguistics Volume 26, Number 4
- - FR . . . FA . . . . M e a n 1
0.9 0.8 0.7 0.6 0.5 0.4 0.3 0.2 0.1
0 ~ t ~ ~ , k . . . . ? . . . ? ....
[image:20.468.43.338.52.260.2]0 0.1 0.2 0.3 0.4 0.5 0.6 0.7 0.8 0.9 1 x R
Figure 9
FR, FA, and mean error for group B related to threshold values expressed as subdivisions of R.
Table 7
The author verification results for both groups (threshold=R/2).
Code R/2 FR FA Code RI2 FR FA
A01 0.33 0.5 0.033 B01 0.32 0.3 0.022 A02 0.33 0.3 0.011 B02 0.42 0.0 0.044 A03 0.36 0.6 0.044 B03 0.33 0.0 0.155 A04 0.36 0.2 0.111 B04 0.33 0.1 0.089 A05 0.35 0.3 0.067 B05 0.28 0.6 0.144 A06 0.35 0.7 0.044 B06 0.36 0.2 0.011 A07 0.34 0.2 0.044 B07 0.38 0.0 0.022 A08 0.31 0.1 0.111 B08 0.30 0.6 0.100 A09 0.35 0.2 0.055 B09 0.36 0.0 0.055 A10 0.35 0.1 0.089 B10 0.40 0.4 0.033 Average 0.35 0.32 0 . 0 6 1 Average 0.35 0.22 0.068
8. Performance Issues 8.1 Training Set S i z e
[image:20.468.43.427.325.458.2]Stamatatos, Fakotakis, and Kokkinakis Text Categorization
. . . . VR - - - CWF-30 . . . CWF-50 Our approach
t _
t _
.2
0.6 0.5 0.4 0.3 0.2 0.1 0
6
Q
7 8 9 10
11
12 13 14 15 16 [image:21.468.41.300.53.251.2]Training set (in texts per genre)
Figure
10The identification error rate of the text genre detection experiment related to the training set size.
The performance of VR is not significantly affected by increasing the training set size. On the other hand, the identification error rate of CWF-30, CWF-50, and that of our approach is generally reduced by increasing the number of texts used for training. The performance of CWF-30 is more stable as compared to CWF-50 but is lower than that of our set of style markers.
The best results are achieved by our approach using 14 training texts per genre (i.e., only 15 out of 100 texts misclassified). However, the identification error rate does not continuously decrease from 11 to 15 training texts; the identification error rate using 12 as well as 15 training texts for each category is greater than the rate attained by using 10 texts. Thus, it is clear that satisfactory accuracy can be achieved with only 10 training texts.
8.2 Significance of Style Markers
The proposed set of style markers is divided into three levels--token level, syntax level, and analysis level. It would be useful to calculate the contribution of each marker, and consequently of each level, to the classification procedure. To this end, we used the absolute t values of the linear regression functions that indicate the contribution of each independent variable to the response value (see Section 5.1).
The average absolute t values of the 22 style markers, taking into account the regression functions for both text genre and author identification experiments, are presented in Table 8. In both cases, the most important stylometric level is the token level, while the syntax level contributes the least to the final response. On the other hand, M02, M12, and M15 are the most important style markers for text genre detection (i.e., average t > 1.50) while the token-level measures, M01, M02, and M03, are the most valuable measures for authorship attribution (for the specific groups of authors).
8.3 Defective Computational Analysis
Computational Linguistics Volume 26, Number 4
Table 8
Absolute t values (average) for the regression functions of both text genre detection and authorship attribution.
Absolute t Values (Average) Stylometric Style Marker Text Genre Authorship
Level Detection Attribution
M01 1.06 1.80
Token level M02 2.52 1.85
M03 1.43 1.98
Level average 1.67 1.88
M04 0.57 0.76
M05 0.58 0.77
M06 0.56 0.77
M07 0.57 0.75
M08 0.57 0.76
Syntax level M09 0.77 0.98
M10 0.93 0.85
Mll 0.59 0.90
M12 1.72 1.07
M13 0.67 0.97
Level average 0.75 0.86
M14 1.03 1.30
M15 2.11 1.05
M16 1.45 0.79
M17 1.08 1.42
Analysis level M18 0.72 1.06
M19 1.14 0.84
M20 1.00 0.86
M21 0.81 0.90
M22 0.65 0.84
Level average 1.11 1.01
the SCBD, w e created an artificial defect in the o u t p u t of the SCBD b y c o r r u p t i n g the sentence a n d c h u n k b o u n d a r y detection procedures. In particular:
in the sentence b o u n d a r y detection p r o c e d u r e , o n l y p e r i o d s w e r e c o n s i d e r e d to d e n o t e a potential sentence b o u n d a r y , a n d
the fifth parsing pass was e x c l u d e d f r o m the c h u n k b o u n d a r y detection p r o c e d u r e .
[image:22.468.50.363.97.398.2]Stamatatos, Fakotakis, and Kokkinakis Text Categorization
Table 9
Absolute values of t (average) of the stylometric levels for both regular and defective analysis. Absolute t (average)
Stylometric
Level Regular Analysis Defective Analysis
Token level 1.67 1.55
Syntax level 0.75 0.97
Analysis level 1.11 1.29
9. C o n c l u s i o n s
In this paper we presented an approach to text categorization in terms of stylisti- cally homogeneous categories, either text genres or authors. The results of apply- ing this methodology to text genre detection and author identification and verifica- tion experiments are strongly encouraging; this methodology outperforms existing lexically based methods. Since the stylistic differences are clearer among text gen- res, the results achieved in text genre detection are considerably better than those of the authorship attribution tasks. However, in both cases, a limited number of text genres or authors are responsible for the greatest part of the identification er- ror rate.
As seen in Figures 4 and 7, text length plays an important role, especially in the case of author identification. A lower boundary of 1,000 words for each text seems reasonable for assuring improved performance. Nevertheless, when dealing with real-world text, it is not always possible to reach this lower bound. The cor- pora used in all the experiments presented here consist of real-world texts down- loaded from the Internet without any manual text preprocessing or text sampling limitations. The majority of these texts have an average text length shorter than 1,000 words.
Our experiments have shown that our method can be applied to a randomly selected group of stylistically homogeneous categories without any manual adapta- tion restrictions. A training corpus consisting of 10 texts per category is adequate for achieving relatively high classification accuracy. We attempted to take advantage of existing NLP tools by using analysis-level style markers that provide useful stylistic information without any additional cost. In essence, such measures represent the way in which the text has been analyzed by the computational tool. We proved that these measures are more important to the final response than measures related to the actual output of the tool on the syntactic level (see Table 8).
Computational Linguistics Volume 26, Number 4
Acknowledgment
We would like to thank the anonymous CL reviewers for their valuable and insightful comments. Their suggestions have greatly improved an earlier draft of this paper. References
Baayen, Harald, Hans Van Halteren, and Fiona Tweedie. 1996. Outside the cave of shadows: Using syntactic annotation to enhance authorship attribution. Literary and Linguistic Computing, 11(3):121-131. Biber, Douglas. 1990. Methodological issues
regarding corpus-based analyses of linguistic variations. Literary and Linguistic Computing, 5:257-269.
Biber, Douglas. 1993a. Representativeness in corpus design. Literary and Linguistic Computing, 8:1-15.
Biber, Douglas. 1993b. Using
register-diversified corpora for general language studies. Computational Linguistics, 19(2):219-242.
Biber, Douglas. 1995. Dimensions of Register Variation: A Cross-Linguistic Comparison. Cambridge University Press.
Brainerd, Barron. 1974. Weighting Evidence in Language and Literature: A Statistical Approach. University of Toronto Press. Brinegar, Claude S. 1963. Mark Twain and
the Quintus Curtius Snodgrass letters: A statistical test of authorship. Journal of the American Statistical Association, 58:85-96. Brunet, Ettienne. 1978. Vocabulaire de Jean
Giraudoux: Structure et Evolution. Slatkine. Burrows, John F. 1987. Word-patterns and
story-shapes: The statistical analysis of narrative style. Literary and Linguistic Computing, 2(2):61-70.
Burrows, John F. 1992. Not unless you ask nicely: The interpretative nexus between analysis and information. Literary and Linguistic Computing, 7(2):91-109. Edwards, Allen F. 1979. Multiple Regression
and the Analysis of Variance and Covariance. W. H. Freeman, San Francisco, CA. Eisenbeis, Robert A., and Robert B. Avery.
1972. Discriminant Analysis and Classification Procedures: Theory and Applications. D.C. Health and Co., Lexington, MA.
Fakotakis, Nikos, Anastasios Tsopanoglou, and George Kokkinakis. 1993. A text-independent speaker recognition system based on vowel spotting. Speech Communication, 12:57-68.
Holmes, David I. 1992. A stylometric analysis of Mormon scripture and related
texts. Journal of the Royal Statistical Society, Series A, 155(1):91-120.
Holmes, David I. 1994. Authorship attribution. Computers and the Humanities, 28:87-106.
Holmes, David I., and Richard S. Forsyth. 1995. The Federalist revisited: New directions in authorship attribution. Literary and Linguistic Computing, 10(2):111-127.
HonorG Antony. 1979. Some simple measures of richness of vocabulary. Association for Literary and Linguistic Computing Bulletin, 7(2):172-177.
Karlgren, Jussi. 1999. Stylistic experiments in information retrieval. In T.
Strzalkowski, editor, Natural Language Information Retrieval. Kluwer Academic Publishers, pages 147-166.
Karlgren, Jussi and Douglass Cutting. 1994. Recognizing text genres with simple metrics using discriminant analysis. In Proceedings of the 15th International Conference on Computational Linguistics (COLING '94), pages 1,071-1,075. Kessler, Brett, Geoffrey Nunberg, and
Hinrich Schiitze. 1997. Automatic detection of text genre. In Proceedings of 35th Annual Meeting, pages 32-38. Association for Computational Linguistics.
Michos, Stefanos, Efstathios Stamatatos, Nikos Fakotakis, and George Kokkinakis. 1996. An empirical text categorizing computational model based on stylistic aspects. In Proceedings of the 8th Conference on Tools with Artificial Intelligence
(ICTAI'96), pages 71-77.
Morton, Andrew Q. 1965. The authorship of Greek prose. Journal of the Royal Statistical Society, Series A, 128:169-233.
Mosteller, Fredrick and David Wallace. 1984. Applied Bayesian and Classical Inference: The Case of the Federalist Papers.
Addison-Wesley, Reading, MA.
Oakman, Robert L. 1980. Computer Methods for Literary Research. University of South
Carolina Press, Columbia.
Sichel, Herbert S. 1975. On a distribution law for word frequencies. Journal of the American Statistical Association, 70:542-547. Simpson, Edward H. 1949. Measurement of
diversity. Nature, 163:688.
Smith, M. W. A. 1983. Recent experience and new developments of methods for the determination of authorship. Association for Literary and Linguistic Computing Bulletin, 11:73-82.
Stamatatos, Fakotakis, and Kokkinakis Text Categorization
Morton's method to distinguish Elizabethan playwrights. Computers and the Humanities, 19(1):3-21.
Stamatatos, Efstathios, Nikos Fakotakis, and George Kokkinakis. 1999. Automatic extraction of rules for sentence boundary disambiguation. In Proceedings of the Workshop in Machine Learning in Human Language Technology, Advance Course on Arti~'cial Intelligence (ACAI'99), pages 88-92.
Stamatatos, Efstathios, Nikos Fakotakis, and George Kokkinakis. 2000. A practical chunker for unrestricted text. In Proceedings of the 2nd International Conference on Natural Language Processing, pages 139-150.
Strzalkowski, Tomek. 1994. Robust text processing in automated information retrieval. In Proceedings of the 4th Conference On Applied Natural Language Processing (ANLP'94), pages 168-173.
Tabachnick, Barbara G. and Linda S. Fidell. 1996. Using Multivariate Statistics. Third
edition. HarperCollins College Publishers. Tweedie, Fiona and Harald Baayen. 1998.
How variable may a constant be? Measures of lexical richness in
perspective. Computers and the Humanities, 32(5):323-352.
Tweedie, Fiona, Sameer Singh, and David I. Holmes. 1996. Neural network
applications in stylometry: The Federalist Papers. Computers and the Humanities, 30(1):1-10.
Yang, Yiming. 1999. An evaluation of statistical approaches to text categorization. Information Retrieval Journal, 1(1):69-90.
Yang, Yiming and Xin Liu. 1999. A re-examination of text categorization methods. In Proceedings of the ACM SIGIR Conference on Research and Development in Information Retrieval (SIGIR'99),
pages 42--49.