Abstract —While collaborative product development (CPD) is a technology intensive process, the planning of this technology is a highly neglected topic. The implementation of planned information technologies (IT) can be an enabler of the CPD performance, as collaboration requires coordination on the integrated platforms. This paper aims to put forward a planning framework first by identifying the requirements and system features in the IT domain that support CPD andthen to do prioritization of design requirements and system features for increasing the efficiency of IT planning in CPD process with the assistance of Quality Function Deployment (QFD) based methodology. Incomplete preference relations are considered and a new group decision making approach is provided by merging different preferences into a single one with fuzzy set theory in QFD. The proposed methodology is tested in a real life application of a software development project.
Index Terms—Collaborative Product Development, Incomplete Preference Relations, Group Decision Making, Quality Function Deployment.
I. INTRODUCTION
n today’s competitive environment companies increasingly tend to develop new products which have higher quality, able to meet customer needs and advantageous in economical return [1]. To fulfill these objectives, collaborative product development is an important tool to make full use of several independent development systems work together and improve their abilities at the same time [2]. Because of being technology oriented process, CPD performance is dependent to the appropriateness of technological infrastructure and its effective planning. For this reason, information technology planning is assessed to be critical process in the effectiveness of CPD management. This paper aims to propose a Quality Function Deployment based IT planning framework for the prioritization of design requirements and system features of CPD.
QFD is well-known technique enable to translate customer requirements to technical requirements. Moreover, the need of QFD is to incorporate the voice of customer in This study is carried out in the scope of research Project 109M147, with the support of TUBITAK. The authors would like to thank TUBITAK for financial support to perform this work. Gülçin Büyüközkan also acknowledges the financial support of the Galatasaray University Research Fund.
G. Büyüközkan is with Galatasaray University Industrial Engineering Department, Istanbul, 34357, Turkey. (phone: +90 212 227 4480; e-mail: [email protected]).
S. Güleryüz is with Galatasaray University Industrial Engineering Department, Istanbul, 34357, Turkey. (e-mail [email protected]).
to various phases of the product development process of new product, or an updated version of the former one. Practically, QFD includes different components such as preferences, which are subjective and vague. That’s why it is necessary to reach approximate exactness with fuzzy set theory [3]. On the other hand, decision makers (DMs) are confronted with the difficulty of completing their preferences because of missing knowledge or lack of expertise about the analyzed subject. To deal with this problem, incomplete preference relations are integrated with QFD to obtain better analyze of the IT requirements.
The paper is organized as follows. Section 2 gives a literature survey of IT customer requirements and system features for the CPD. Section 3 presents the proposed approach based on QFD with incomplete preference. Section 4 includes the application of the proposed approach in a software development project. Finally, Section 5 gives some concluding remarks.
II. LITERATURE REVIEW
A.IT requirements for the CPD
CPD is a characteristically distributed collaboration of heterogeneous systems. Quite a few independent systems need to be integrated with others to develop products or service in effective means [4]. Therefore the main component of CPD’s technology requirements has a vital importance and there are several studies on this issue.
A wide range of these studies are summarized technical requirements into basic key points. According to Li and Su [5] collaboration and integration over the internet which is related to the web enabled CPD environment’s main characteristics are: scalability, openness, heterogeneity, resources access and inter-operation, legacy codes reusability, and artificial intelligence. Rodriguez and Al-Ashaab [6] highlight CPD and its design process into a system. During the design processes, they present a supportive approach which compasses common access of design information, collaborative visualization and design of the component. Shen et al. [2] state that requirements include; ontology and semantics based integration, interoperability of product models, product-centric design methodology, knowledge management, collaborative intelligent user interfaces, distributed design project management, drag and drop functionality, security/privacy, self-management, and social software for CPD. Furthermore, Palacio et al. [7] mention software development requirements and present a conceptual model in collaborative environment. They generalize the software design requirements in four groups: scale, uncertainty, interdependence, and communication. These requirements
I
QFD
based Information Technology Planning
Approach for Collaborative Product Development
form a starting point for both collaboration and development processes.
Based on a deep literature survey and the opinions of industrials experts, IT requirements of CPD process can be categorized in nine main factors.
Communication involves definition of critical data and
associates with information flows between participants of the project in order to provide information about achievements, problems, solutions, and justifications [7], [8],[9]. Project Management serves to control and
coordinate the virtual team and their tasks [2],[6],[10],[11]. It compasses interaction mechanism for team members, status updates and task progress [7],[12],[13],[14]. The key merit of Knowledge Management is to assure information
flows and synchronize key factors [15]. Besides, processes of managing knowledge in collaborative teams, members allow mutual knowledge flow between sources of internal expertise and create networks of workers within and outside the organization. [2],[6],[12],[13],[16] [17]. Interoperability
requirement emerges as a natural result of collaboration in order to assure diverse systems to work together [2],[5],[11].
Risk Management controls uncertainties and unattended
project failures, help to reduce risks by anticipating, preventing and mitigating problems [9],[18],[19]. Data
Integration and Analysis defines as a mechanism to
integrate data available from different collaborating teams and to analyze the data in the most efficient manner [5], [15],[20],[22] Another important requirement is Product
Model Design Specifications which allow representation,
visualization, and modification of the product mode [2], [14],[22],[24],[25]. Security requirement implicates data
protection as well as system back-up in collaborative environment [2],[14],[22],[24],[25]. Lastly, CPD infrastructure requires Technical Support given that
collaborative infrastructure consisting of technology products may often necessitate maintenance and repair services [14].
B. Collaborative system features
Based on a deep literature survey and opinions of industrials experts, collaborative system features are described in ten groups. Synchronous Communication tools
enable people to have real time communication and collaboration when they are in different places at a same point of time. On the other hand, Asynchronous
Communication tools enable people to communicate and
collaborate over a period of time through a different time and place mode [14],[22],[24]. Hillebrand and Biemans [26] and Fraser et al. [9] mention that product development involves the coordination of internal functional groups therefore it requires the integration of both internal and external networks which is associated as System Integration
Mechanisms as a system feature [2]. Project Management
tools are indispensable in CPD project and its main functions are; to organize, control and manage the development process consisting of resources, personnel, capital, information and data. [6],[14],[27]. Product
Visualization presents a subset of computer-supported
cooperative work applications in which provides the user to visualize, annotate, and control 3D design model interactively [6],[24],[25],[27]. Document Management
tools aim to store electronic documents and images [22].
Content Management tools are another feature that defines
as a system that supports the creation, administration, distribution, publication and collection of information [28].
Data Tracking and Analysis enables the collaborating
teams to comprehend the data they are handling. It provides detailed history of data and its origin [7],[16],[22]. Decision Supporttools are required to analyze all data and present a
comprehensible report to assist decision makers. Archiving
tools are also an important feature, where large data is shared by distributed teams as storing, retrieving, and accessing the data are assured by archiving [22].
III. METHOD AND APPLICATION
A. Incomplete preference relations in QFD
QFD is a well-known technique for translating customer requirements (CRs) into relevant design requirements (DRs). Each translation uses a matrix called the house of quality (HOQ) for identifying CRs and establishing priorities of DRs to satisfy the CRs [29]. To design and acquire a more integrated CPD, QFD can be an effective structure development tool.
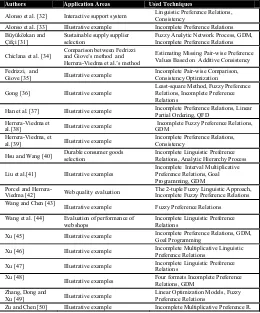
[image:2.595.300.560.467.780.2]In some cases experts do not have detailed knowledge about problems. In such situations, because of the difficulty to compare alternatives or not to have sufficient level of knowledge, experts present incomplete preferences, such as missing preference values [30],[31]. In this cases group decision making (GDM) is important issue in QFD to unify opinions of multiple DMs. Moreover, GDM not only avoid bias but also helps to minimize partiality [29]. Different techniques applied with incomplete preference relations in different areas. These studies are summarized in Table 1.
Table 1. Used Incomplete Preference Techniques with Application Areas Authors Application Areas Used Techniques
Alonso et al. [32] Interactive support system Linguistic Preference Relations, Consistency
Alonso et al. [33] Illustrative example Incomplete Preference Relations
Büyüközkan and
Çifçi [31] Sustainable supply supplier selection Fuzzy Analytic Network Process, GDM, Incomplete Preference Relations
Chiclana et al. [34] Comparison between Fedrizzi and Giove’s method and Herrera-Viedma et al.’s method
Estimating Missing Pair-wise Preference Values Based on Additive Consistency
Fedrizzi, and
Giove [35] Illustrative example Incomplete Pair-wise Comparison, Consistency Optimization
Gong [36] Illustrative example Least-square Method, Fuzzy Preference Relations, Incomplete Preference Relations
Han et al. [37] Illustrative example Incomplete Preference Relations, Linear Partial Ordering, QFD
Herrera-Viedma et
al.[38] Illustrative example Incomplete Fuzzy Preference Relations, GDM
Herrera-Viedma, et
al.[39] Illustrative example Incomplete Preference Relations, Consistency
Hsu and Wang [40] Durable consumer goods selection Incomplete Linguistic Preference Relations, Analytic Hierarchy Process
Liu et al.[41] Illustrative examples
Incomplete Interval Multiplicative Preference Relations, Goal Programming, GDM Porcel and Herrera-
Viedma [42] Web quality evaluation The 2-tuple Fuzzy Linguistic Approach, Incomplete Fuzzy Preference Relations
Wang and Chen [43] Illustrative example Fuzzy Preference Relations
Wang et al. [44] Evaluation of performance of
web shops Incomplete Linguistic Preference Relations
Xu [45] Illustrative example Incomplete Preference Relations, GDM,
Goal Programming
Xu [46] Illustrative example Incomplete Multiplicative Linguistic Preference Relations
Xu [47] Illustrative example Incomplete Linguistic Preference Relations
Xu [48] Illustrative examples Four formats Incomplete Preference
Relations, GDM Zhang, Dong and
Xu [49] Illustrative example Linear Optimization Models, Fuzzy Preference Relations
B. Technique of the proposed evaluation model
In order to apply proposed approach, the following steps are used:
Step 1 - “Whats - Identifying the customer requirements”:
CRs are identified with the help of literature, industrial and scientific background of experts, researchers thesis and articles.
Step 2 - “Prioritizing and evaluation of CRs”: When DMs
are in difficulty of comparing factors, incomplete preference relations technique is used in order to compute the importance degrees.
Step 2.1 - “CRs evaluation”: A comparison scale is required
[image:3.595.87.264.377.446.2]to measure the importance degrees of the CRs. The scale in Table 2 is used to indicate the relative strength of each pair of elements as in Eq. (1).
nn n n n n p p p p p p p p p P ~ ... ~ ~. . . . . . ~ ... ~ ~ ~ ... ~ ~ ~ 2 1 2 22 21 1 12 11 (1)
Where ~pij = (plij, pmij, pu
ij) indicates the importance among
[image:3.595.308.548.379.531.2]the compared criteria (importance of i over j) where i = j = 1,2,…,n.
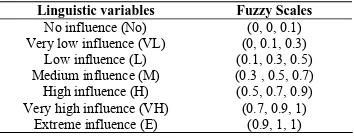
Table 2. Corresponding linguistic terms for evaluation
Step 2.2 - “Completion of missing values”: When DMs
construct and evaluate the fuzzy pair wise comparison matrices of interdependent components, defuzzify those using Eq. (2).
1
0
x x
ij 1/2 inf ~ sup ~
p~
F p p d
ij
ij
(2)
Then, missing values in a DM’s incomplete preference relation can be computed.
5 . 0
iy yj
ij p p
p ,∀ i, j, y
{1, 2, . . . , n} (3) Given a reciprocal preference relation, Eq. (3) is employedto calculate an estimated value of a preference degree using other preference degrees. Indeed, by using an intermediate alternativeay, the preference value of pij (i ≠ j) can be calculated in three ways [38].
1. Frompij piypyj0.5, we obtain the estimate 5
. 0
1
yj iy y
ij p p
cp (4)
2. Frompyj pyi pij 0.5, we obtain the estimate
5 . 0
2
yi yj y
ij p p
cp (5) 3. Frompiy pij pjy 0.5, we obtain the estimate
5 . 0
3
jy iy y
ij p p
cp
(6)
The preference value of one alternative over itself is always assumed to be equal to 0.5.
Step 2.3 -“Checking the consistency level”: The following
sets can be used to estimate its consistency level:
1
ij
H = {y ≠i, j | (i, y), (y, j)
EV} (7) 2ij
H = {y ≠i, j | (y, i), (y, j)
EV} (8) 3ij
H = {y ≠i, j | (i, y), (j, y)
EV} (9) Where EV is the set of pairs of alternatives for which the expert provides preference values, and 1ij
H , 2
ij
H , 3
ij
H are the sets of intermediate alternative ay (y ≠ i, j) that can be used to estimate the preference value pij (i ≠ j) using (7)-(9),
respectively. The consistency level CLij, associated with a
preference value pij(i ≠j)
EV,
2 1
1 ij ij ij i j
ij
CP CP p
CL , aij
[0,1] (10) is defined as a linear combination of the average of the completeness values associated to the two alternatives involved in that preference degree CPi and CPj,) 1 ( 2 # n EV CPi (11) where #EV is the number of preference values known. Its
associated error
pij, can be calculated as in Eq. (12)
1 2 3
3
2 ij ij ij
ij
p p p
p (12) where
; 1,2,3, 0 # , 0 #
1
l otherwise H if H p cp p l ij l ij H j ij kl ij ij l ij (13) and
; , ,
1,2,3 . 0 # 0 # 0 # 0 # 0 # 0 # , 1 , 2 ,3 1 2 3
abc
otherwise H H H if H H H if c ij b ij a ij ij ij ij
(14)
αij isa parameter to control the influence of completeness in
the evaluation of the consistency levels.
2 ) 1 ( 4 # # # 1 n EV EV EVEVi j i j
ij
(15) In order to provepij is consistent, CLij have to be higher
than 0.5. If pij is not consistent andpij 0, then preferences should be revised by DM. If pij is not consistent
andpij 0, then known preferences should be increased [38].
Step 2.4 -“Aggregation of the evaluations”: The evaluators
are categorized into K groups and each group member is denoted as {pkl : k = 1, …, K; l = 1, …, Lk} where Lk is the
size of the group k. Let
kLk
ij k
ij p
p 1,..., be the set of values to be aggregated for any ,i j R and group k DMs. Then, the ordered weighted geometric (OWG) operator is defined as:
k
lk w L l kl ij kL ij k ij k ij
G p p p
p
1 2
1, ,..., (16)
Linguistic variables Fuzzy Scales No influence (No) (0, 0, 0.1) Very low influence (VL) (0, 0.1, 0.3)
Low influence (L) (0.1, 0.3, 0.5) Medium influence (M) (0.3 , 0.5, 0.7) High influence (H) (0.5, 0.7, 0.9) Very high influence (VH) (0.7, 0.9, 1)
where, ( 1,..., ) k L
w w
W is an exponential weighting vector, such that wl 0,1 andwl1, and each
kl ij
p is the lth largest valued element in the set
kLk
ij k ij k
ij p p
p1, 2,..., [31].
The OWG operator reflects the fuzzy majority if we calculate its weighting vector W by means of a fuzzy linguistic quantifier. Proportional quantifiers, such as most,
at least half, may be represented by fuzzy subsets of the unit
interval [0,1]. Then, for any r [0,1], Q(r) indicates the degree to which the proportion r is compatible with the meaning of the quantifier it represents. For a non decreasing relative quantifier, Q, the weights are obtained aswlQ
l/Lk
Q
l1/Lk
, l = 1,…,Lk where Q(y) isdefined as: 0, if y < a; (y - a)/(b - a), if ayb; and 1, if y
b. Note that a, b, y [0,1] and Q(y) indicates the degree to which the proportion y is compatible with the meaning of the quantifier it represents. Some examples for the relative quantifiers are “most” (0.3, 0.8), “at least half” (0, 0.5) and “as many as possible” (0.5, 1). When the fuzzy quantifier Q
is used for calculating the weights of the OWG operatorGW, it is represented byGQ. Therefore, the
collective multiplicative relative importance relation is obtained as follows;
kLk
ij k ij k ij G Q k
ij p p p
p 1, 2,...,
, 1 ijn. (17) (17)
Step 2.5- “Obtaining priorities from the judgment matrix”:
After the group opinion is collected in the matrix Pk using
Eq. (17), it must be exploited to determine the importance weights of the criteria. Note that in Pk, the element ij reflects
the relative importance of criterion i compared to criterion j. Next, calculate the quantifier guided importance degree of each criterion, which quantifies the importance of one criterion compared to others in a fuzzy majority sense. By using the OWG operator, we have
p j n
QGIDik GQ ij: 1,..., (18) for all i=1,...,n. Finally, the obtained QGIDi values should be
normalized, i.e., k
i i k i k
i QGID QGID
QGID / , to have the
importance degrees in percentage for the group k. These steps need to be pursued in all nodes of the evaluation model. The importance degree of each hierarchy leaf node requirement is calculated by multiplying its importance value with the importance values of its up level requirements. Finally, we calculate the weighted sum of CR’s group importance values given group importance weights to obtain the aggregate CR importance.
Step 3 - “Hows - Developing/defining design requirements
(DRs): In this step, DR part is transforming CRs to technical attributes.
Step 4 -“Relation Matrix”: A relationship matrix is
constructed between CRs and DRs. Depending upon the impact of the DRs in meeting CRs for the attribute, values “Empty = no relationship”, “1= possible relationship”, “3 = moderate relationship”, and “9 = strong relationship” are assigned.
Step 5 - “Prioritizing DRs”: The importance of each
technical/design requirement is computed using the relationship matrix and the relative importance of each CR. The resulting value determines the relative weight of each
DRs as compared to CRs. The importance of each DR is calculated as the sum of each CR importance value multiplied by the quantified relationship between the same CR and the current DR.
IV. CASE STUDY
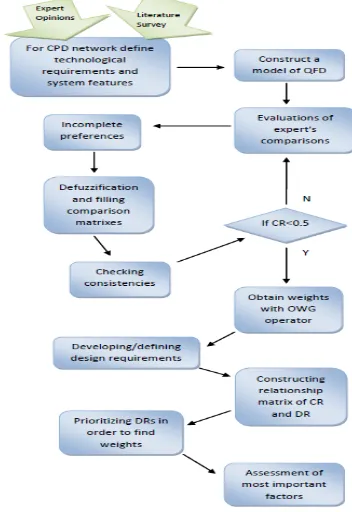
[image:4.595.325.501.187.443.2]This section provides a case study to illustrate the proposed approach for assessing the most important IT requirements for CPD process. Figure 1 shows the application steps of the proposed QFD based IT planning approach.
Figure 1. Application steps of proposed approach
Step 1 - “What’s - Identifying the CRs”: We group in two
main dimensions, namely, management and technological requirements, the factors that are given in Section II.A. Management requirements (CR1) includes Communication
(CR11), Project Management (CR12), Knowledge
Management (CR13), Interoperability (CR14), Risk
Management (CR15) and Technological requirements (CR2)
includes Data Integration and Analysis (CR21), Product
Model/Design Specifications (CR22), Security (CR23) and
Technical Support (CR24).
Step 2 -“Prioritizing and evaluation of CRs”: To determine
the importance degrees of CRs, three DMs, company man-ager, R&D manager and software developer, who are ex-perts in their branch, are identified. The evaluation matrix of company manager is given in Table 3 as an example. Values in the comparison matrix are seen as the linguistic form, besides the missing values are seen with x.
Table 3. Company manager’s evaluation of technological requirements factors
Data Int.&
Analysis
Product Model/ D.S
Security Technical support
Data Int A. - M L L
P.M.D.S x - H H Security x x - x
Step 2.1 - “Completion of missing values”: In this step,
linguistic values are converted to defuzzied numbers (Table 4). Later, comparison scale from Table 2 is required to measure the importance degrees of the CRs.
Table 4. Defuzzified evaluation of pair wise comparison matrix of technological factors
Data Int.&
Analysis
Product Model/ D.S
Security Technical support
Data Int A. - 0.5 0.3 0.3
P.M.D.S x - 0.7 0.7 Security x x - x
Technical s. x x 0.5 -
After these, defuzzified preference values are formed and calculated with equation (2). Later, the missing values are estimated using Eq. (4) to (6) and constituted in Table 4. An example computation procedure to estimate p34 is as follows:
1 34
H = Ø as cp3411=p31p140.5= unknown
2 34
H = {1} and cp1234= 0.5
23 24p
p = 0.50
3 34
H = Ø and cp1334=p33p430.5= unknown
So, cp13= 0.5 and other estimated values and their completed form of are shown in Table 5
.
Table 5. Determining the estimated evaluation of values by DM Data Int.&
Analysis
Product
Model/ D.S Security
Technical support
Data Int A. - 0.5 0.3 0.3
P.M.D.S 0.5 - 0.7 0.7
Security 0.7 0.3 - 0.5
Technical s. 0.7 0.3 0.5 -
Step 2.2 - “Checking consistency level”: There is necessity
to measure consistency level in order to understand that estimated values are consistent or not. The consistency level matrix is created using Eq. (10) to (15) and is shown in Table 6.
Table 6. Consistency level for evaluation of DMs
Data Int.&
Analysis
Product Model/ D.S
Security Technical support
Data Int A. - 0.5 0.3 0.3
P.M.D.S 0.5 - 0.7 0.7 Security 0.7 0.3 - 0.5
Technical s. 0.7 0.3 0.5 -
According to DM’s evaluations, consistency level of preferences is calculated and their computation steps are as follows:
EV1 = {(1,2),(1,3),(1,4)}; EV2 = {(1,2),(2,3),(3,2) }; EV3 = {(1, 2)}; EV4 = {(1,4),(2,4),(4,3)}
CP1 = 3/6, CP2 = 3/6, CP3 = 1/6, CP4 = 3/6
⍺34 = 1-[(2+3-1) / 4(4-1)-2] = 0.7
CL34 = (1- 0). (1 - 0.7) + 0.7 = 0.53
The result of consistency (CL34) is 0.53. It is obvious that 0.53>0.50 and this shows a consistent preference.
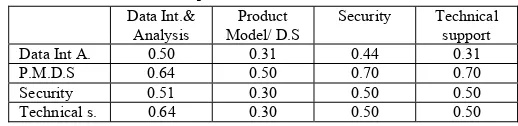
Step 2.3 - “Aggregation of evaluations”: All matrixes
[image:5.595.295.554.65.128.2]evaluated from DM’s opinions have to aggregate to each other using Eq. (16), (17). In this step OWG operator with fuzzy linguistic quantifier ‘at most’ is used to compute the group importance relation matrix as shown in Table 7 with weighting vector (0.066, 0.667, 0.267).
Table 7. Importance relation matrix of DMs
Data Int.&
Analysis
Product Model/ D.S
Security Technical support
Data Int A. 0.50 0.31 0.44 0.31
P.M.D.S 0.64 0.50 0.70 0.70 Security 0.51 0.30 0.50 0.50
Technical s. 0.64 0.30 0.50 0.50
Step 3 - “Obtain priorities and ranking”: Firstly, as
explained in the Section II.B, DRs are defined as: Synchronous Communication tools (DR1), Asynchronous
Communication tools (DR2), System Integration
Mechanisms (DR3), Project Management tools (DR4),
Product Visualization (DR5), Document Management tools
(DR6), Content Management tools (DR7), Data Tracking and
Analysis tools (DR8), Archiving Tools (DR9), Decision
Support tools (DR10).
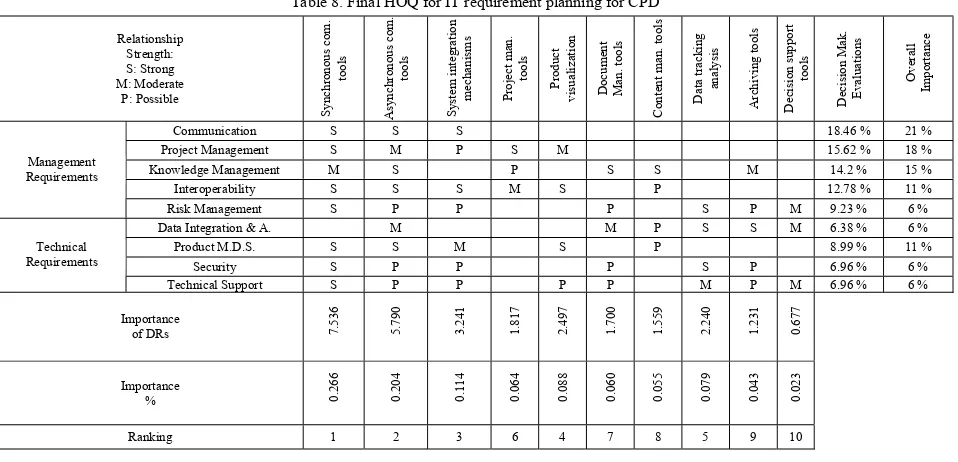
In the following steps group opinion is collected in the matrix priorities and importance values are constructed between CRs and DRs, each of DRs is correlated individually to each of the CRs by considering to what extent a requirement contributes to meeting customer needs for the attribute. After that, the importance of each technical/design requirement is computed using the relationship matrix and the relative importance of each CR. The resulting value determines the relative weight of each DRs as compared to CRs. The importance of each DR is calculated as the sum of each CR importance value multiplied by the quantified relationship between the same CR and the current DR. The importance of each DR is calculated as the sum of each CR importance value multiplied by the quantified relationship between the same CR and the current DR. The summary of obtained results in House of Quality is given in Table 8. According to these results, the most important IT DRs for CPD are Synchro-nous Communication tools, AsynchroSynchro-nous Communication tools and System Integration tools.
V. CONCLUSION
This study presented a QFD based IT planning methodology for effective CPD projects. Given that CPD is a highly technology-centric process, it is important to identify the IT requirements correctly and prioritize these technologies appropriately. The applicability of the methodology is demonstrated through the software development project case study. As a future work, the presented methodology is considered to be adapted to different collaborative projects to verify its performance within other CPD networks.
REFERENCES
[1] K.-H. Tsai, “Collaborative networks and product innovation performance:Toward a contingency perspective,” Research Policy, Vol. 38, 765-778, 2009.
[2] W. Shen, Q. Hao and W. Li, “Computer supported collaborative design: Retrospective and perspective,” Computers in Industry, Vol. 59, 855-862, 2008.
[3] G. Büyüközkan and O. Feyzioğlu, “Group decision making to better respond customer needs in software development,” Computers in Industry, Vol. 48, 427-441, 2005. [4] H. Sun,W.Fan,W.Shen, andT.Xiao,“Ontology-based interoperation model of collaborative
product development,” Journal of Network and Computer Applications, Vol. 35, 1, 132– 144, 2012.
[5] J. Li and D. Su, “Support modules and system structure of web-enabled collaborative environment for design and manufacture,” International Journal of Production Research, Vol. 46, 2397-2412, 2008.
[6] K. Rodriguez and A. Al-Ashaab, “Knowledge web-based system architecture for collabo-rative product development,” Computers in Industry, Vol. 56, 125-140, 2005. [7] R.R. Palacio, A. Vizcaino, A.L. Moran and V.M. Gonzalez, “Tool to facilitate appropriate
[8] S.A. Willaert, R. Graaf, and S. Minderhoud, “Collaborative engineering: A case study of Concurrent Engineering in a wider context,” Journal of Engineering Technology Man-agement, Vol. 15, 87-109, 1998.
[9] P. Fraser, C. Farrukh, and M. Gregory, “Managing product development collaborations-a process maturity approach,” Proceedings of the Institution of Mechanical Engineers, Part B: Journal of Engineering, 217-1499, 2003.
[10] G. Backlund, A.O. Rönnback, “Managing complexity in collaborative development: mod-eling requirements and enhancing communication,” Microprocessors and Microsystems, Vol. 23, 409-416, 1999.
[11] H. Wang, H. Zhang, “A distributed and interactive system to integrated design and simula-tion for collaborative product development,” Robotics and Computer-Integrated Manufac-turing, Vol. 26, 778-779, 2010.
[12] G. Büyüközkan, T. Dereli and A. Baykasoğlu, “A survey on the methods and tools of concurrent new product development and agile manufacturing,” Journal of Intelligent Manufacturing, Vol. 15, 731-751.2004.
[13] E.S. Lee, D.W. McDonald, N. Anderson and Tarczy-Hornoch, “Incorporating collabora-tory concepts into informatics in support of translational interdisciplinary biomedical re-search”, International Journal of Medical Informatics, Vol.78, 10-21, 2009.
[14] L.F. Lai. “A knowledge engineering approach to knowledge management,” Information Sciences, Vol.177, 4072–4094, 2007.
[15] C. Hammers, R. Schmitt, “Governing the process chain of product development with an enhanced Quality Gate approach, CIRP,” Journal of Manufacturing Science and Technol-ogy, Vol. 1, 206-211, 2009.
[16] B. Ramesh and A. Tiwana, “Supporting collaborative process knowledge management in new product development teams,” Decision Support Systems, Vol. 27, 213-235, 1999. [17] V. Krishnan and S. Bhattacharya, “Technology Selection and Commitment in New
Product Development: The Role of Uncertanity and Design Flexibility,” Manufacturing Science, Vol.48, 313-327, 2002.
[18] L.P. Cooper, “A research agenda to reduce risk in new product development through knowledge management: a practitioner perspective”, Journal of Engineering Techonolgy Management, Vol. 20, 117-140, 2003.
[19] M. Mohtashami, T. Marlowe, V. Kirova and F.P. Deek, “Risk Management for collaborative software development”, Information Systems Management,Vol. 35, 3, 10-24, 2007.
[20] J. Arsenyan, G. Büyüközkan, “Modelling collaborative product development using axiomatic design”, In CD proceedings of 15th International Conference on Concurrent Enterprising (ICE 2009), 22-24 June 2009; Leiden, The Netherlands.
[21] K. Rouibah, S.O. Ali, “Dynamic data sharing and security in a collaborative product definition management system,” Robotics and Computer-Integrated Manufacturing, Vol. 23, 217-233, 2007.
[22] J. Arsenyan, “Designing and Implementing Collaboration Structure for Product Development”, Ph.D. Thesis, Galatasaray University, 2011.
[23] J.-X. Wang, M.-X. Tang, L.-N. Song and S.-Q. Jiang, “Design and implementation of an agent-based collaborative product design system,” Computers in Industry, Vol. 60, 520-535, 2009.
[24] W.D. Li, Z.M.Qiu,“State-of-the-art technologies and methodologies for collaborative product development systems”, International Journal of Production Research,Vol. 44(13), 2525-2559, 2006.
[25] C.-H. Chu, C.-Y. Cheng and C.-W. Wu, “Applications of the Web-based collaborative visualization in distributed product development,” Computers in Industry, Vol. 57, 272-282, 2006.
[26] B. Hillebrand, W.G. Biemans, “The relationship between internal and external cooperation: literature review and propositions,” Journal of Business Research,Vol 53, 735- 743, 2003.
[27] X.T. Wang and W. Xiong, “An integrated linguistic based group decision making approach for quality function deployment,” Expert Systems with Applications, Vol. 38, 14428-14438, 2011.
[28] C.S. Pereira, A.L. Soares, “Improving the quality of collaboration requirements for information management through social networks analysis,” International Journal of Information Management, Vol. 27, 86-103, 2007.
[29] G. Buyukozkan, O. Feyzioglu, D. Ruan, “Fuzzy group decision making to multiple preference formats in quality function deployment”, Computers in Industry, Vol.58, 392-402, 2007.
[30] E. Herrera-Viedma, F. Chiclana, F., Herrera and S Alonso, “A consensus model for group decision making with incomplete fuzzy preference relations,” IEEE Transactions On Fuzzy Systems, Vol. 15(5),863-877, 2007.
[31] G. Büyükozkan, G. Cifçi, “A novel fuzzy multi-criteria decision framework for sustainable supplier selection with incomplete information,” Computers in Industry, Vol. 62, 164-174, 2011.
[32] S. Alonso, E. Herrera-Viedma, F. Chiclana, F. Herrera, “A web based consensus support system for group decision making problems and incomplete preferences”, Information Sciences, Vol.180, 4477-4495, 2010.
[33] S. Alonso, F. Chiclana, , F. Herrera, E. Herrera-Viedma, J. Alcala and C. Porcel, “A consistency based procedure to estimate missing pairwise preference values,” International Journal of Intelligent Systems, Vol. 23, 155-175, 2008.
[34] F. Chiclana, E. Herrera-Viedma, and S. Alonso, “A note on two methods for estimating missing pair wise preference values,” IEEE Transactions on Systems, Man and Cybernetics Part B: Cybernetics, Vol. 39, 1628-1633, 2009.
[35] M. Fedrizzi, S. Giove, “Incomplete pair wise comparison and consistency optimization,” European Journal of Operational Research, Vol. 183, 303-313, 2007.
[36] Z.W. Gong, “Least square method to priority of the fuzzy preference relations with incomplete information,” International Journal of Approximate Reasoning, Vol. 47, 258-264, 2008.
[37] C.H. Han, J.K. Kim and S.H. Choi, “Prioritizing engineering characteristics in quality function deployment with incomplete information: A linear partial ordering approach,” International Journal of Production Economics, Vol. 91, 235-249, 2004.
[38] E. Herrera-Viedma, , F. Chiclana, , F. Herrera, S. Alonso, “ Group decision-making model with incomplete fuzzy preference relations based on additive consistency”, IEEE Transactions on Systems, Manufacturing and Cybernetics-Part B: Cybernetics, Vol. 37, 176-189, 2007
[39] E. Herrera-Viedma, F. Chiclana, F., Herrera and S Alonso, “A consensus model for group decision making with incomplete fuzzy preference relations,” IEEE Transactions On Fuzzy Systems, Vol. 15, 863-877, 2007
[40] S.C Hsu, T.C. Wang, “Solving multi-criteria decision making with incomplete linguistic preference relations,” Expert Systems with Applications, Vol. 38, 10882-10888, 2011 [41] F. Liu, W.-G. Zhang, Z.-X. Wang, “A goal programming model for incomplete interval
multiplicative preference relations and its application in group decision-making,” Euro-pean Journal of Operational Research, Vol. 218, 747–754, 2012.
[42] C. Porcel and E. Herrera-Viedma, “Dealing with incomplete information in a fuzzy linguistic recommender system to disseminate information in university digital libraries,” Knowledge Based Systems, Vol. 23, 32-39, 2010.
[43] T.-C.Wang, Y.-H. Chen, “Incomplete fuzzy linguistic preference relations under uncertain environments,” Information Fusion, Vol. 11, 2, 201-207, 2010.
[44] T.-C. Wang, S.C Peng, S.C Hsu and J. Chang, “The Evaluation of the Incomplete Linguistic Preference Relations on the Performance of Web Shops,” Ninth International Conference on Hybrid Intelligent Systems, Vol. 2, 363-368, 2009.
[45] Z. Xu, “Goal programming models for obtaining the priority vector of incomplete fuzzy preference relation,” International Journal of Approximate Reasoning, Vol. 36, 261-270, 2004.
[46] Z. Xu, “Incomplete linguistic preference relations and their fusion,” Information Fusion, Vol. 7, 331-337, 2006.
[47] Z. Xu, “A practical procedure for group decision making under incomplete multiplicative linguistic preference relations,” Group Decision and Negotiation, Vol. 15, 581-591, 2006. [48] Y. Xu, “On group decision making with four formats of incomplete preference relations,”
Computers and Industrial Engineering, Vol. 61, 48-54, 2011.
[49] G. Zhang, Y. Dong, Y. Xu, “Linear optimization modeling of consistency issues in group decision making based on fuzzy preference relations”, Expert Systems with Applications, Vol.39, 3, 2415-2420, 2012.
[image:6.595.60.539.63.294.2][50] Z.S. Xu and J.Chen, “Group decision-making procedure based on incomplete reciprocal relations”, Soft Computing, Vol.12, 515-521, 2008.
Table 8. Final HOQ for IT requirement planning for CPD
Relationship Strength: S: Strong M: Moderate
P: Possible
Synchrono
us com.
tools
Asynchron
ous com
.
tools
System int
egration
mechanism
s
Project man
.
tools Product
visualizatio
n
Document Man. tools
Content ma
n. tools
Data trackin
g
analysis
Archiving t
ools
Decision su
pport
tools
Decision M
ak.
Evaluations
Overall
Importance
Communication S S S 18.46 % 21 %
Project Management S M P S M 15.62 % 18 %
Knowledge Management M S P S S M 14.2 % 15 %
Interoperability S S S M S P 12.78 % 11 %
Management Requirements
Risk Management S P P P S P M 9.23 % 6 %
Data Integration & A. M M P S S M 6.38 % 6 %
Product M.D.S. S S M S P 8.99 % 11 %
Security S P P P S P 6.96 % 6 %
Technical Requirements
Technical Support S P P P P M P M 6.96 % 6 %
Importance
of DRs 7.536 5.790 3.241 1.817 2.497 1.700 1.559 2.240 1.231 0.677
Importance
% 0.266 0.204 0.114 0.064 0.088 0.060 0.055 0.079 0.043 0.023