DCU-Symantec at the WMT 2013 Quality Estimation Shared Task
Raphael Rubino†?, Joachim Wagner†‡, Jennifer Foster†,Johann Roturier?Rasoul Samad Zadeh Kaljahi†?and Fred Hollowood?
†NCLT, School of Computing, Dublin City University, Ireland ‡Center for Next Generation Localisation, Dublin, Ireland
?Symantec Research Labs, Dublin, Ireland
†{rrubino, jwagner, jfoster}@computing.dcu.ie
?{johann roturier, fhollowood}@symantec.com
Abstract
We describe the two systems submit-ted by the DCU-Symantec team to Task 1.1. of the WMT 2013 Shared Task on Quality Estimation for Machine Transla-tion. Task 1.1 involve estimating post-editing effort for English-Spanish trans-lation pairs in the news domain. The two systems use a wide variety of fea-tures, of which the most effective are the word-alignment, n-gram frequency, lan-guage model, POS-tag-based and pseudo-references ones. Both systems perform at a similarly high level in the two tasks of scoring and ranking translations, although there is some evidence that the systems are over-fitting to the training data.
1 Introduction
The WMT 2013 Quality Estimation Shared Task involve both sentence-level and word-level qual-ity estimation (QE). The sentence-level task con-sist of three subtasks: scoring and ranking transla-tions with regard to post-editing effort (Task 1.1), selecting among several translations produced by multiple MT systems for the same source sentence (Task 1.2), and predicting post-editing time (Task 1.3). The DCU-Symantec team enter two systems to Task 1.1. Given a set of source English news sentences and their Spanish translations, the goals are to predict the HTER score of each translation and to produce a ranking based on HTER for the set of translations. A set of 2,254 sentence pairs are provided for training.
On the ranking task, our system DCU-SYMC
alltypesis second placed out of thirteen
sys-tems and our system DCU-SYMC combine is ranked fifth, according to the Delta Average met-ric. According to the Spearman rank correlation, our systems are the joint-highest systems. In the
scoring task, theDCU-SYMC alltypessystem is placed sixth out of seventeen systems accord-ing to Mean Absolute Error (MAE) and third ac-cording to Root Mean Squared Error (RMSE). The
DCU-SYMC combinesystem is placed fifth
ac-cording to MAE and second acac-cording to RMSE. In this system description paper, we describe the features, the learning methods used, the results for the two submitted systems and some other systems we experiment with.
2 Features
Our starting point for the WMT13 QE shared task was the feature set used in the system we submit-ted to the WMT12 QE task (Rubino et al., 2012). This feature set, comprising 308 features in to-tal, extended the17baseline features provided by the task organisers to include 6 additional sur-face features, 6 additional language model fea-tures, 17 additional features derived from the MT system components and the n-best lists, 138 features obtained by part-of-speech tagging and parsing the source sentences and95 obtained by part-of-speech tagging the target sentences, 21 topic model features, 2 features produced by a grammar checker1and6pseudo-source (or back-translation) features.
We made the following modifications to this 2012 feature set:
• The pseudo-source (or back-translation)
fea-tures were removed, as they did not con-tribute useful information to our system last year.
• The language model and n-gram frequency feature sets were extended in order to cover 1to5gram sequences, as well as source and target ratios for these feature values.
• The word-alignment feature set was also extended by considering several thresholds
1http://www.languagetool.org/
when counting the number of target words aligned with source words.
• We extracted 8 additional features from the decoder log file, including the number of dis-carded hypotheses, the total number of trans-lation options and the number of nodes in the decoding graph.
• The set of topic model features was reduced in order to keep only those that were shown to be effective on three quality estimation datasets (the details can be found in (Rubino et al. (to appear), 2013)). These features en-code the difference between source and target topic distributions according to several dis-tance/divergence metrics.
• Following Soricut et al. (2012), we employed
pseudo-reference features. The source sen-tences were translated with three different MT systems: an in-house phrase-based SMT system built using Moses (Koehn et al., 2007) and trained on the parallel data pro-vided by the organisers, the rule-based sys-tem Systran2 and the online, publicly avail-able, Bing Translator3. The obtained trans-lations are compared to the target sentences using sentence-level BLEU (Papineni et al., 2002), TER (Snover et al., 2006) and the Lev-enshtein distance (LevLev-enshtein, 1966).
• Also following Soricut et al. (2012), one-to-one word-alignments, with and without Part-Of-Speech (POS) agreement, were cluded as features. Using the alignment in-formation provided by the decoder, we POS tagged the source and target sentences with TreeTagger (Schmidt, 1994) and the publicly available pre-trained models for English and Spanish. We mapped the tagsets of both lan-guages by simplifying the initial tags and ob-tain a reduced set of8tags. We applied that simplification on the tagged sentences before checking for POS agreement.
3 Machine Learning
In this section, we describe the learning algo-rithms and feature selection used in our experi-ments, leading to the two submitted systems for the shared task.
2Systran Enterprise Server version6 3http://www.bing.com/translator
3.1 Primary Learning Method
To estimate the post-editing effort of translated sentences, we rely on regression models built us-ing the Support Vector Machine (SVM) algorithm for regression -SVR, implemented in the LIB
-SVM toolkit (Chang and Lin, 2011). To build our final regression models, we optimise SVM hyper-parameters (C,γand) using a grid-search
method with 5-fold cross-validation for each pa-rameter triplet. The papa-rameters leading to the best MAE, RMSE and Pearson’s correlation coefficient (r) are kept to build the model.
3.2 Feature Selection on Feature Types
In order to reduce the feature and obtain more compact models, we apply feature selection on each of our15feature types. Examples of feature types arelanguage model featuresortopic model features. For each feature type, we apply a feature subset evaluation method based on the wrapper paradigm and using the best-first search algorithm to explore the feature space. The M5P (Wang and Witten, 1997) regression tree algorithm im-plemented in the Weka toolkit (Hall et al., 2009) is used with default parameters to train and eval-uate a regression model for each feature subset obtained with best-first search. A 10-fold cross-validation is performed for each subset and we keep the features leading to the best RMSE. We use M5P regression trees instead of -SVR
be-cause grid-search with the latter is too computa-tionally expensive to be applied so many times. Using feature selection in this way, we obtain15 reduced feature sets that we combine to form the
DCU-SYMC alltypessystem, containing 102
features detailed in Table 1.
3.3 Feature Binarisation
In order to aid the SVM learner, we also experi-ment with binarising our feature set, i.e. convert-ing our features with various feature value ranges into features whose values are either 1 or 0. Again, we employ regression tree learning. We train regression trees with M5P and M5P-R4 (imple-mented in the Weka toolkit) and create a binary feature for each regression rule found in the trees (ignoring the leaf nodes). For example, a binary feature indicating whether the Bing TER score is less than or equal to 55.685is derived from the
4We experiment with J48 decision trees as well, but this
Backward LM
Source 1-gram perplexity.
Source & target 1-grams perplexity ratio.
Source & target 3-grams and 4-gram perplexity ratio.
Target Syntax
Frequency of tags: ADV, FS, DM, VLinf, VMinf, semicolon, VLger, NC, PDEL, VEfin, CC, CCNEG, PPx, ART, SYM, CODE, PREP, SE and number of ambiguous tags
Frequency of least frequent POS 3-gram observed in a corpus.
Frequency of least frequent POS 4-gram and 6-gram with sentence padding (start and end of sentence tags) observed in a corpus.
Source Syntax
Features from three probabilistic parsers. (Rubino et al., 2012).
Frequency of least frequent POS 2-gram, 4-gram and 9-gram with sentence padding observed in a corpus.
Number of analyses found and number of words, using a Lexical Functional Grammar of English as described in Rubino et al. (2012).
LM
Source unigram perplexity.
Target 3-gram and 4-gram perplexity with sentence padding. Source & target 1-gram and 5-gram perplexity ratio. Source & target unigram log-probability.
Decoder
Component scores during decoding. Number of phrases in the best translation. Number of translation options.
N-gram Frequency
Target 2-gram in second and third frequency quartiles. Target 3-gram and 5-gram in low frequency quartiles. Number of target 1-gram seen in a corpus.
Source & target 1-grams in highest and second highest frequency quartile.
One-to-One Word-Alignment
Count of O2O word alignment, weighted by target sentence length.
Count of O2O word alignment with POS agreement, weighted by count of O2O, by source length, by target length.
Pseudo-Reference
Moses translation TER score.
Bing translation number of words and TER score. Systran sBLEU, number of substitutions and TER score.
Surface
Source number of punctuation marks and average words occurrence in source sentence.
Target number of punctuation marks, uppercased letters and binary value if the last character of the sentence is a punctuation mark.
Ratio of source and target sentence lengths, average word length and number of punctuation marks over sentence lengths.
Topic Model
Cosine distance between source and target topic distributions.
Jensen-Shannon divergence between source and target topic distributions.
Word Alignment
Averaged number of source words aligned per target words withp(s|t)thresholds: 1.0, 0.75, 0.5, 0.25, 0.01 Averaged number of source words aligned per target words withp(s|t) = 0.01weighted by target words frequency Averaged number of target words aligned per source word withp(t|s) = 0.01weighted by source words frequency Ratio of source and target averaged aligned words with thresholds: 1.0 and 0.1, and with threshold: 0.75, 0.5, 0.25 weighted by words frequency
Feature to which thresholdtis applied t(≤) Target 1-gram backward LM log-prob. −35.973 Target 3-gram backward LM perplexity 7144.99 Probabilistic parsing feature 3.756 Probabilistic parsing feature 57.5 Frequency of least frequent POS 6-gram 0.5 Source 3-gram LM log-prob. 65.286 Source 4-gram LM perplexity with padding 306.362 Target 2-gram LM perplexity 176.431 Target 4-gram LM perplexity 426.023 Target 4-gram LM perplexity with padding 341.801 Target 5-gram LM perplexity 112.908 Ratio src&trg 5-gram LM log-prob. 1.186
MT system component score −50
MT system component score −0.801 Source 2-gram frequency in low quartile 0.146 Ratio src&trg 2-gram in high freq. quartile 0.818 Ratio src&trg 3-gram in high freq. quartile 0.482
O2O word alignment 15.5
Pseudo-ref. Moses Levenshtein 19
Pseudo-ref. Moses TER 21.286
Pseudo-ref. Bing TER 16.905
Pseudo-ref. Bing TER 23.431
Pseudo-ref. Bing TER 37.394
Pseudo-ref. Bing TER 55.685
Pseudo-ref. Systran sBLEU 0.334
Pseudo-ref. Systran TER 36.399
[image:4.595.80.283.60.416.2]Source average word length 4.298 Target uppercased/lowercased letters ratio 0.011 Ratio src&trg average word length 1.051 Source word align.,p(s|t)>0.75 11.374 Source word align.,p(s|t)>0.1 485.062 Source word align.,p(s|t)>0.75weighted 0.002 Target word align.,p(t|s)>0.01weighted 0.019 Word align. ratiop >0.25weighted 1.32
Table 2: Features selected with the M5P-RM50 binarisation approach. For each feature, the cor-responding rule indicates the binary feature value. These features are included in the submitted sys-temcombine in addition to the features presented in Table 1.
regression ruleBing TER score≤55.685.
The primary motivation for using regression tree learning in this way was to provide a quick and convenient method for binarising our feature set. However, we can also perform feature selec-tion using this method by experimenting with vari-ous minimum leaf sizes (Weka parameterM). We
plot the performance of the M5P and M5P-R (opti-mising towards correlation) over the parameterM
and select the best three values ofM. To
experi-ment with the effect of smaller and larger feature sets, we further include parameters ofM that (a)
lead to an approximately 50% bigger feature set and (b) to an approximately 50% smaller feature set.
Our DCU-SYMC combine system was built
by combining the DCU-SYMC alltypes fea-ture set, reduced using the best-first M5P
wrap-per approach as described in subsection 3.2, with a binarised set produced using an M5P regres-sion tree with a minimum of 50 nodes per leaf. This latter configuration, containing 34 features detailed in Table 2, was selected according to the evaluation scores obtained during cross-validation on the training set using -SVR, as described in
the next section. Finally, we run a greedy back-ward feature selection algorithm wrapping-SVR
on bothDCU-SYMC alltypesandDCU-SYMC combinein order to optimise our feature sets for the SVR learning algorithm, removing6and2 fea-tures respectively.
4 System Evaluation and Results
In this section, we present the results obtained with
-SVR during5-fold cross-validation on the train-ing set and the final results obtained on the test set. We selected two systems to submit amongst the different configurations based on MAE, RMSE andr. As several systems reach the same
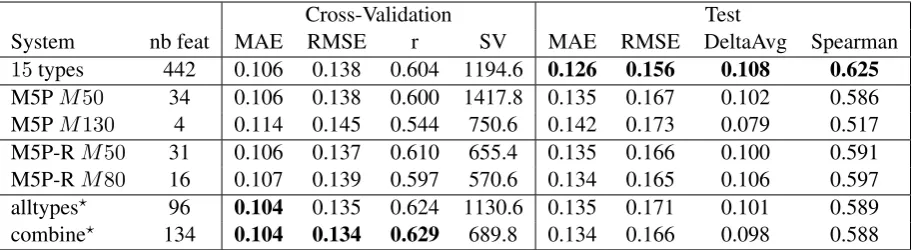
perfor-mance according to these metrics, we use the num-ber of support vectors (notedSV) as an indicator of training data over-fitting. We report the results obtained with some of our systems in Table 3.
The results show that the submitted
sys-tems DCU-SYMC alltypes and DCU-SYMC
combine lead to the best scores on
cross-validation, but they do not outperform the system combining the15feature types without feature se-lection (15 types). This system reaches the best scores on the test set compared to all our systems built on reduced feature sets. This indicates that we over-fit and fail to generalise from the training data.
Amongst the systems built using reduced fea-ture sets, the M5P-R M80 system, based on the tree binarisation approach using M5P-R, yields the best results on the test set on 3out of 4 offi-cial metrics. These results indicate that this sys-tem, trained on 16 features only, tends to estimate HTER scores more accurately on the unseen test data. The results of the two systems based on the M5P-R binarisation method are the best com-pared to all the other systems presented in this Section. This feature binarisation and selection method leads to robust systems with few features:
31and16 forM5P-R M50 andM5P-R M80
Cross-Validation Test
System nb feat MAE RMSE r SV MAE RMSE DeltaAvg Spearman
15types 442 0.106 0.138 0.604 1194.6 0.126 0.156 0.108 0.625 M5PM50 34 0.106 0.138 0.600 1417.8 0.135 0.167 0.102 0.586 M5PM130 4 0.114 0.145 0.544 750.6 0.142 0.173 0.079 0.517 M5P-RM50 31 0.106 0.137 0.610 655.4 0.135 0.166 0.100 0.591 M5P-RM80 16 0.107 0.139 0.597 570.6 0.134 0.165 0.106 0.597 alltypes? 96 0.104 0.135 0.624 1130.6 0.135 0.171 0.101 0.589
[image:5.595.73.531.62.187.2]combine? 134 0.104 0.134 0.629 689.8 0.134 0.166 0.098 0.588
Table 3: Results obtained with different regression models, during cross-validation on the training set and on the test set, depending on the feature selection method. Systems marked with? were submitted
for the shared task.
scoring task and two metrics to evaluate the rank-ing task.
On the systems built using reduced feature sets, we observe a difference of approximately 0.03pt absolute between the MAE and RMSE scores ob-tained during cross-validation and those on the test set. Such a difference can be related to train-ing data over-fitttrain-ing, even though the feature sets obtained with the tree binarisation methods are small. For instance, the system M5P M130 is trained on4 features only, but the difference be-tween cross-validation and test MAE scores is similar to the other systems. We see on the fi-nal results that our feature selection methods is an over-fitting factor: by selecting the features which explain well the training set, the final model tends to generalise less. The selected features are suited for the specificities of the training data, but are less accurate at predicting values on the unseen test set.
5 Discussion
Training data over-fitting is clearly shown by the results presented in Table 3, indicated by the per-formance drop between results obtained during cross-validation and the ones obtained on the test set. While this drop may be related to data over-fitting, it may also be related to the use of differ-ent machine learning methods for feature selec-tion (M5P and M5P-R) and for building the fi-nal regression models (-SVR). In order to
ver-ify this aspect, we build two regression models using M5P, based on the feature setsalltypes
andcombine. Results are presented in Table 4
and show that, for thealltypesfeature set, the RMSE, DeltaAvg and Spearman scores are im-proved using M5P compared to SVM. For the
combine feature set, the scoring results (MAE
and RMSE) are better using SVM, while the rank-ing results are similar for both machine learnrank-ing methods.
The performance drop between the results on the training data (or a development set) and the test data was also observed by the highest ranked participants in the WMT12 QE shared task. To compare our system without feature selection to the winner of the previous shared task, we eval-uate the 15 types system in Table 3 using the WMT12 QE dataset. The results are presented in Table 5. We can see that similar MAEs are ob-tained with our feature set and the WMT12 QE winner, whereas our system gets a higher RMSE (+0.01). For the ranking scores, our system is worse using the DeltaAvg metric while it is bet-ter on Spearman coefficient.
6 Conclusion
We presented in this paper our experiments for the WMT13 Quality Estimation shared task. Our ap-proach is based on the extraction of a large ini-tial feature set, followed by two feature selection methods. The first one is a wrapper approach us-ing M5P and a best-first search algorithm, while the second one is a feature binarisation approach using M5P and M5P-R. The final regression mod-els were built using -SVR and we selected two
systems to submit based on cross-validation re-sults.
System nb feat MAE RMSE DeltaAvg Spearman alltypes 96 0.135 0.165 0.104 0.604 combine 134 0.139 0.169 0.098 0.587
Table 4: Results obtained with the two feature sets contained in our submitted systems using M5P to build the regression models instead of-SVR.
System nb feat MAE RMSE DeltaAvg Spearman
WMT12 winner 15 0.61 0.75 0.63 0.64
15types 442 0.61 0.76 0.60 0.65
Table 5: Results obtained on WMT12 QE dataset with our best system (15 types) compared to WMT12 QE highest ranked team, in the Likert score prediction task.
using the feature binarisation approach M5P-R
80, which contains16 features selected from our initial set of features. The tree-based feature bina-risation is a fast and flexible method which allows us to vary the number of features by optimising the leaf size and leads to acceptable results with a few selected features.
Future work involves a deeper analysis of the over-fitting effect and an investigation of other methods in order to outperform the non-reduced feature set. We are also interested in finding a ro-bust way to optimise the leaf size parameter for our tree-based feature binarisation method, with-out using cross-validation on the training set with an SVM algorithm.
Acknowledgements
The research reported in this paper has been supported by the Research Ireland Enterprise Partnership Scheme (EPSPG/2011/102 and EP-SPD/2011/135) and Science Foundation Ireland (Grant 12/CE/I2267) as part of the Centre for Next Generation Localisation (www.cngl.ie) at Dublin City University.
References
Chih-Chung Chang and Chih-Jen Lin. 2011. LIBSVM: A Library for Support Vector Ma-chines. ACM Transactions on Intelligent
Sys-tems and Technology, 2:27:1–27:27.
Soft-ware available at http://www.csie.ntu. edu.tw/˜cjlin/libsvm.
Mark Hall, Eibe Frank, Geoffrey Holmes, Bernhard Pfahringer, Peter Reutemann, and Ian H Witten. 2009. The WEKA Data Mining Software: an Update. ACM SIGKDD Explorations Newsletter, 11(1):10–18.
Philipp Koehn, Hieu Hoang, Alexandra Birch, Chris Callison-Burch, Marcello Federico, Nicola Bertoldi, Brooke Cowan, Wade Shen, Christine Moran, Richard Zens, et al. 2007. Moses: Open source toolkit for statistical machine translation. In ACL, pages 177–180.
Vladimir I Levenshtein. 1966. Binary codes capable of correcting deletions, insertions and reversals. In
Soviet physics doklady, volume 10, page 707.
Kishore Papineni, Salim Roukos, Todd Ward, and Wei-Jing Zhu. 2002. Bleu: a method for automatic eval-uation of machine translation. InACL, pages 311– 318.
Raphael Rubino, Jennifer Foster, Joachim Wagner, Jo-hann Roturier, Rasul Samad Zadeh Kaljahi, and Fred Hollowood. 2012. DCU-Symantec Submission for the WMT 2012 Quality Estimation Task. In
Pro-ceedings of the Seventh WMT, pages 138–144.
Raphael Rubino et al. (to appear). 2013. Topic Models for Translation Quality Estimation for Gisting Pur-poses. InProceeding of MT Summit XIV.
Helmut Schmidt. 1994. Probabilistic part-of-speech tagging using decision trees. InProceedings of the International Conference on New Methods in Natu-ral Language Processing.
Matthew Snover, Bonnie Dorr, Richard Schwartz, Lin-nea Micciulla, and John Makhoul. 2006. A study of translation edit rate with targeted human annotation. InAMTA, pages 223–231.
Radu Soricut, Nguyen Bach, and Ziyuan Wang. 2012. The SDL Language Weaver Systems in the WMT12 Quality Estimation Shared Task. InProceedings of
the Seventh WMT, pages 145–151.