Proceedings of The 9th International Natural Language Generation conference, pages 237–241,
Effect of Data Annotation, Feature Selection and Model Choice on
Spatial Description Generation in French
Anja Belz
Computing, Engineering and Maths University of Brighton
Lewes Road, Brighton BN2 4GJ, UK [email protected]
Adrian Muscat Brandon Birmingham Communications & Computer Engineering
University of Malta Msida MSD 2080, Malta [email protected]
Jessie Levacher Julie Pain Adam Quinquenel INSA Rouen
Avenue de l’Universit´e
76801 Saint- ´Etienne-du-Rouvray Cedex, France
{firstname.lastname}@insa-rouen.fr
Abstract
In this paper, we look at automatic generation of spatial descriptions in French, more partic-ularly, selecting a spatial preposition for a pair of objects in an image. Our focus is on assess-ing the effect on accuracy of (i) increasassess-ing data set size, (ii) removing synonyms from the set of prepositions used for annotation, (iii) opti-mising feature sets, and (iv) training on best prepositions only vs. training on all accept-able prepositions. We describe a new data set where each object pair in each image is anno-tated with the best and all acceptable preposi-tions that describe the spatial relapreposi-tionship be-tween the two objects. We report results for three new methods for this task, and find that the best, 75% Accuracy, is 25 points higher than our previous best result for this task.
1 Introduction
The research in this paper addresses the area of image description generation with applications in automatic image captioning and assistive technolo-gies. An important aspect, and long-standing re-search topic, is to identify the entities, or objects, in images. However, a good image description will also say something about how entities relate to each other, not just list them. Spatial relations, and prepo-sitions to express them, are particularly important in this context, but until very recently there had been no research directly aimed at this subtask, although
some research came close (Mitchell et al., 2012; Kulkarni et al., 2013; Yang et al., 2011). Elliott & Keller (Elliott and Keller, 2013) did address the sub-task, but with hardwired rules for just eight preposi-tion. The work reported by Ramisa et al. (2015) is closely related to our work and also uses geometric and label features to predict prepositions.
2 Data
The new data set we have created for the experi-ments in this paper is a set of photographs in which objects in 20 classes are annotated with bounding boxes and class labels, and each object pair with prepositions that describe the spatial relationship be-tween the objects. The data was derived from the VOC’08 data (Everingham et al., 2010) by selecting images with 2 or 3 bounding boxes, and adding the preposition annotations. The data has twice as many images as in our previous work (Belz et al., 2015), and a smaller set of prepositions (see below). 2.1 Annotation
For each object pair in each image, and for both or-derings of the object labels,Ls, LoandLo, Ls, three French native speakers selected (i) the best preposi-tion for the given pair (free text entry), and (ii) the possible prepositions for the given pair (from a given list) that accurately described the spatial relationship between the two objects in the pair. As a result, we have a total of 4,140 object pair annotations which fold out into 9,278 training instances.
Figure 1:Screen grab of annotation tool, showing first task (free-text entry of single best preposition).
Figure 1 is a screen grab from our annotation tool showing the first annotation task (free-text entry of single best preposition). In the second task, annota-tors chose from the following set of 17 prepositions:
`a cˆot´e de, a l’´exterieur de, au dessus de, au niveau de, autour de, contre, dans, derri`ere, devant, en face de, en travers de, le long de, loin de, par del`a, pr`es de, sous, sur.
In our previous work with French data (Belz et al., 2015) we additionally had en dessous de, en haut de, parmiand `a l’interieur de. We removedparmi, because it was never used in our previous annotation efforts, and the other three because the preposition set also contains near synonyms for them. Below, we refer to the data annotated with the smaller set as DS-17and that with the largerDS-21.
We previously used only images with exactly 2 object bounding boxes; these images are also in-cluded (newly annotated) in our new data set. In some of our experiments below we report results for just this subset and refer to it as DS-17-2o. The remaining half of the data (containing only images with 3 bounding boxes) is referred to asDS-17-3o.
We replaced the VC’08 object class labels with their French equivalents in the annotations, yielding the following set of words (used for the language features, see Section 3.1 below):
la personne, le chien, la voiture, la chaise, le cheval, le chat, l’oiseau, le v´elo, la moto, l’´ecran, l’avion, la bouteille, le bateau, le canap´e, le train, la plante, le mouton, la vache, la table, le bus.
We used pairwise kappa to assess inter-annotator and intra-annotator agreement for our three annota-tors (who annotated one third of the data each). For
selection of best prepositions this is straightforward; for all prepositions it is less straightforward, because the sets of selected prepositions differ in set size and overlap size. Our approach was to align the prepo-sition sets and to pad out the aligned sets with blank labels if an annotator did not select a preposition se-lected by another annotator. Calculated in this way on a batch of 40 images, forbestprepositions, aver-age inter-annotator agreement was 0.67, and averaver-age intra-annotator agreement was 0.81. Forall prepo-sitions, average inter-annotator agreement was 0.63, and average intra-annotator agreement was 0.77.1
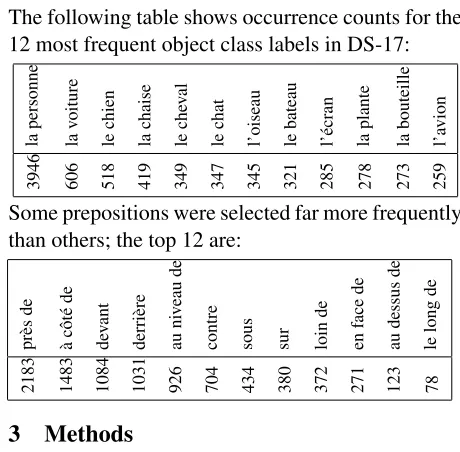
2.2 Object Class Label and Preposition Counts The following table shows occurrence counts for the 12 most frequent object class labels in DS-17:
la
personne
la
voiture
le
chien
la
chaise
le
che
val
le
chat
l’oiseau lebateau l’´ecran laplante labouteille l’avion
3946 606 518 419 349 347 345 321 285 278 273 259 Some prepositions were selected far more frequently than others; the top 12 are:
pr
`es
de
`a
cˆot
´e
de
de
vant
derri
`ere
au
ni
veau
de
contre sous sur loin
de
en
face
de
au
dessus
de
le
long
de
2183 1483 1084 1031 926 704 434 380 372 271 123 78
3 Methods
The training data contains a separate training in-stance (Ls, Lo, p) for each preposition p selected 1These would have been even higher had it not been for one
[image:2.612.309.539.437.663.2]by human annotators for the template ‘Ls estp Lo’ (e.g.le chien est devant la personne), given an im-age in which (just) Objs andObjo are surrounded by bounding boxes labelled with object class labels
Ls andLo. All models are trained and tested with leave-one-out cross-validation.
3.1 Learning Methods
Naive Bayes Model (NB): We use a Naive Bayes model as in our previous work (Belz et al., 2015) which maps our set of language and visual features to prepositions (for details of all features see Sec-tion 3.1). The model uses the language features for defining the prior model and the visual features for defining the likelihood model.
SVM Model: Using the same features, we trained a multi-class SVM model employing one-versus-one classification.2 This involves trainingk(k−1)/2
pairs of binary preposition classifiers for a multi-class prediction task involving kprepositions. The SVM model was trained with an RBF kernel, char-acterised by a coefficient of1/(|features|). Decision-Tree Model (DT): Again using the same features, we created a multi-class probabilis-tic decision-tree model2with a maximum tree depth
of4for the DS-17 data set, and5for the DS-21 data set (from training and validation error plots). Logistic Regression Model (LR): Using the same features, we trained a multi-class logistic regression model employing one-versus-rest classification1.
The model makes use of L1-norm regularisation with an inverse regularisation strength of 0.9.
3.2 Evaluation methods
To compare results in this paper, we use variants of Accuracy from our previous work (Belz et al., 2015). The dimension along which the variants we use here differ is output rank. Different variants, de-noted Acc(n), where n = 1...4, return Accuracy rates for the top n outputs produced by systems, such that a system output is considered correct if a target (human-selected) output is among the top n
outputs produced by the system (so fors = 1the measure is just standard Accuracy).
2Implemented using scikit-learn (http://scikit-learn.org).
DS-21 DS-17-2o
Acc(1) Acc(1)
NB 50.2 67.0
DT 50.4 66.2
SVM 46.1 59.4
[image:3.612.367.486.70.146.2]LR 53.4 72.7
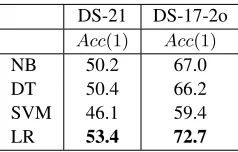
Table 1:Acc(1)results for the data with the larger (DS-21) and smaller (DS-17-2o) preposition sets, for all 4 models.
3.3 Features
The four methods described in the following section all use the following feature set (described in more detail in Belz et al., 2015):
F0: Object labelLs.
F1: Object labelLo.
F2: Area of bounding box ofObjsnormalised by im-age size.
F3: Area of bounding box ofObjonormalised by im-age size.
F4: Ratio ofObjsbounding box area to that ofObjo.
F5: Distance between bounding box centroids.
F6: Area of overlap of bounding boxes normalised by the smaller bounding box.
F7: Distance between centroids divided by approxi-mated average width of bounding boxes.
F8: Position ofObjsrelative toObjo(N, E, S, W).
Note that to make the categorial features (F0, F1, F8) work for the logistic regression model we map them to 1-hot encodings (nbits fornfeature values).
4 Experiments and Results
4.1 Preposition Set
DS-17-2o DS-17
Acc(1) Acc(2) Acc(1) Acc(2)
NB 67.0 82.0 64.7 80.9
DT 66.2 80.5 67.7 81.4
SVM 59.4 78.5 -
[image:4.612.93.280.69.146.2]-LR 72.7 86.8 74.9 89.2
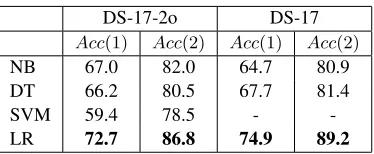
Table 2:Acc(1)andAcc(2)results for the smaller (DS-17-2o) and larger (DS-17) data sets with 17 prepositions.
4.2 Data Set Size
Here we look at the effect of adding more data to the training set, comparing results for DS-17-2o (1,020 images; 4,426 training instances) with results for the whole of DS-17 (2,070 images; 9,278 training in-stances). Table 2 shows the results: there are some improvements from the size increase for all methods except NB, but the only sizeable one is for LR. 4.3 Different Models
Tables 1 and 2 provide an overview of results for the four models above on 21, 17-2o and DS-17. Of the new methods (SVM, DT, LR), SVM does much worse than the others (we therefore leave it out of the remaining experiments below). The LR model achieves the best results across all data sets.
Looking at Acc(1) vs. Acc(2) results (Table 2), differences are very similar (around 14-15 points) for all methods except for SVM for which it is much bigger, implying that SVM more often has a target preposition in second place.
4.4 Feature Optimisation
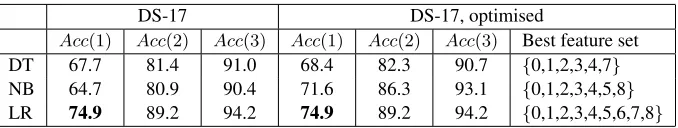
We start with the results on DS-17 for the three best models as a baseline and try to improve over them using greedy lasso as a simple feature optimi-sation method which starts by selecting the single best feature and then keeps adding the next feature that achieves the best result in combination with pre-viously selected feature(s). Table 3 shows Acc(1),
Acc(2)andAcc(3)results for DS-17, before and af-ter feature optimisation. Feature optimisation does not make a difference to LR, but improves the results for DT slightly, and for NB substantially, by leaving out features 5, 6 and 8, and 6 and 7, respectively. 4.5 Best vs. All Annotations
Unlike in our previous work, our new data con-tains information about which preposition
annota-tors thought was best out of the ones they consid-ered possible (see Section 2), so we can now com-pare results for training on best prepositions only vs. all possible prepositions for object pairs.
There are more than twice the number of training instances for all possible prepositions (9,278) than for best prepositions only (4,140), so it is not a like-for-like comparison. We therefore also report (under the heading ‘all-sub’ in Table 4) results for a ran-domly selected subset of the all-prepositions data of the same size as the best-prepositions-only data (av-eraged over 4 different runs).
The results in Table 4 show very clearly the bene-fit of training on all possible prepositions compared to best only, although the benefit is less marked for the NB method. While results for ‘all-sub’ are lower than for ‘all’, and some of the improvement in the ‘all’ results is likely due to larger data set size, the ‘all-sub’ results nevertheless show clearly that the largest part of the improvement is due to training on all possible prepositions (that being the only differ-ence between the ‘best’ and ‘all-sub’ data).
5 Discussion
It is worth recalling that the task we are trying to solve is to guess the actual 3D spatial relationship between two objects in a photograph, from just the object types and various geometric properties of the objects’ bounding boxes which give just a rough idea even of the object’s size and 2D dimensions in the image. Nevertheless this rudimentary infor-mation is enough to predict a correct 3D preposi-tion 75% of the time in the case of our best method, LR, moreover across a variety of large and small, animate and inanimate objects, in indoors and out-doors scenes. The most closely related existing work (Ramisa et al., 2015) reported slightly higher accu-racy rates, but for different data sets. Our own pre-vious results (Belz et al., 2015) were considerably worse at around 50%.
DS-17 DS-17, optimised
Acc(1) Acc(2) Acc(3) Acc(1) Acc(2) Acc(3) Best feature set DT 67.7 81.4 91.0 68.4 82.3 90.7 {0,1,2,3,4,7}
NB 64.7 80.9 90.4 71.6 86.3 93.1 {0,1,2,3,4,5,8}
[image:5.612.138.477.70.134.2]LR 74.9 89.2 94.2 74.9 89.2 94.2 {0,1,2,3,4,5,6,7,8}
Table 3:Acc(1),Acc(2)andAcc(3)results for DS-17, before and after feature optimisation, for the three best models.
DS-17
best all all-sub
Acc(1) Acc(2) Acc(3) Acc(1) Acc(2) Acc(3) Acc(1) Acc(2) Acc(3)
DT 51.6 71.8 83.1 67.7 81.4 91.0 64.7 80.9 88.8
NB 57.6 74.8 84.0 64.7 80.9 90.4 61.2 78.8 88.3
LR 59.3 78.8 88.8 74.9 89.2 94.2 73.6 88.4 93.9
Table 4: Acc(1)andAcc(2)results for DS-17, using only best prepositions (‘best’), using all prepositions (‘all’), and using all prepositions but only a randomly selected subset (‘all-sub’) of instances from ‘all’ of size equal to that of the best preposition data.
the acceptability by human evaluators of the topn
results. If it turns out, as seems likely, that the top two prepositions are acceptable to human evaluators, then the real accuracy would be closer to 90%.
6 Conclusion
In this paper, we have reported new results for au-tomatic generation of spatial descriptions in French. We described a new data set where object pairs in images are annotated with the best preposition, as well as all possible prepositions, that describe the spatial relationship between the objects. We re-ported results for three new methods for this task, and found that (i) increasing the size of the data set on its own only has a small beneficial effect on re-sults; (ii) removing synonyms from the annotations results in dramatically improved results for all meth-ods tested, and (iii) training on all possible prepo-sitions for an object pair instead of training on the single best preposition only is of substantial benefit for all methods tested. The best result for our task was achieved with the LR classifier, on the preposi-tion set without synonyms, using all possible prepo-sitions for object pairs. That result, 75% Accuracy, is an entire 25 points higher than our previous best result for this task.
Acknowledgments
This work originated during a Short-term Scientific Mission under European COST Action IC1307 (Eu-ropean Network on Integrating Vision & Language).
We are indebted to the INLG’06 reviewers for comprehensive and helpful comments; we have im-plemented as many as we could in the available time.
References
A. Belz, A. Muscat, M. Aberton, and S. Benjelloun. 2015. Describing spatial relationships between objects in images in English and French. InProceedings of VL’15.
D. Elliott and F. Keller. 2013. Image description using visual dependency representations. InProceedings of EMNLP’13, pages 1292–1302.
M. Everingham, L. Van Gool, C. Williams, J. Winn, and A. Zisserman. 2010. The PASCAL Visual Object Classes (VOC) Challenge. International Journal of Computer Vision, 88(2):303–338.
G. Kulkarni, V. Premraj, V. Ordonez, S. Dhar, S. Li, Y. Choi, A. Berg, and T. Berg. 2013. Babytalk: Understanding and generating simple image descrip-tions. Pattern Analysis and Machine Intelligence, IEEE Transactions on, 35(12):2891–2903.
M. Mitchell, X. Han, J. Dodge, A. Mensch, A. Goyal, A. Berg, K. Yamaguchi, T. Berg, K. Stratos, and H. Daum´e III. 2012. Midge: Generating image de-scriptions from computer vision detections. In Pro-ceedings of EACL’12.
A. Ramisa, J. Wang, Y. Lu, E. Dellandrea, F. Moreno-Noguer, and R. Gaizauskas. 2015. Combining ge-ometric, textual and visual features for predicting prepositions in image descriptions. InProceedings of EMNLP’15, pages 214–220.