Veracity Computing from Lexical Cues and Perceived Certainty Trends
Uwe D. Reichel∗
Research Institute for Linguistics Hungarian Academy of Sciences
Budapest, Hungary
Piroska Lendvai†
Computational Linguistics Saarland University Saarbr¨ucken, Germany [email protected]
Abstract
We present a data-driven method for determining the veracity of a set of rumorous claims on social media data. Tweets from different sources pertaining to a rumor are processed on three levels: first, factuality values are assigned to each tweet based on four textual cue categories relevant for our journalism use case; these amalgamate speaker support in terms of polarity and commitment in terms of certainty and speculation. Next, the proportions of these lexical cues are utilized as predictors for tweet certainty in a generalized linear regression model. Subse-quently, lexical cue proportions, predicted certainty, as well as their time course characteristics are used to compute veracity for each rumor in terms of the identity of the rumor-resolving tweet and its binary resolution value judgment. The system operates without access to extralinguis-tic resources. Evaluated on the data portion for which hand-labeled examples were available, it achieves .74 F1-score on identifying rumor resolving tweets and .76 F1-score on predicting if a rumor is resolved as true or false.
1 Background and Task Definition
A growing amount of studies investigate how rumors and memes spread and change on social media platforms (Leskovec et al., 2009; Qazvinian et al., 2011; Procter et al., 2013); given the amount of user-generated content, the need for automatic fact checking and claim verification procedures is obvious. To compute veracity, systems have been created recently for assessing the credibility of sources and claims (Berti- ´Equille and Borge-Holthoefer, 2015). Upcoming initiatives endorsed veracity detection in social media content as a shared task, calling for targeted applications and releasing benchmark data1.
To tackle this challenge, we implemented a system that seeks to achieve three goals: (i) to compute a judgment indicating how factual a claim is, based on textual cues and predicted speaker certainty, (ii) to identify which tweet is resolving a rumor, in a set of tweets that discuss this rumor, and (iii) to predict the resolution value for the rumor, i.e., whether the rumor is verified as true or false. Veracity computation is based on information from three information layers related to rumorousness: (1) lexical-level factuality cues, (2) temporal patterns, and (3) speaker certainty. The system is purely data-driven and operates without building claim source profiles for the analyzed content. Below we introduce our motivation in the context of previous and related work.
The means by which factuality is conveyed are largely but not exclusively encoded on linguistic lev-els and are tightly related to the notion of certainty. Certainty and other extra-propositional aspects of meaning have prominently been investigated in terms of modality, negation and speculative language phenomena (Morante and Blanco, 2012; Morante and Sporleder, 2012). Benchmark corpora with anno-tations emerged (Saur´ı and Pustejovsky, 2009; Farkas et al., 2010), and systems have been built (Saur´ı and Pustejovsky, 2012; de Marneffe et al., 2012; Velldal and Read, 2012) to process texts from the genres of literature, newswire, biomedicine and online encyclopedia, typically drawing on lexical and syntactic cues. (Szarvas et al., 2012) propose a method for porting uncertainty detection across gen-res and domains. (Kilicoglu et al., 2015) pgen-resent a full-fledged, compositional approach to factuality
∗∗UDR is supported by an Alexander von Humboldt Society grant. ††PL is supported by the PHEME FP7 project (Grant No. 611233).
1http://alt.qcri.org/semeval2017/task8/
modeling and detection on texts from the domain of biomedicine based on fine-grained typology and dictionary-based classification of extra-propositional phenomena. Several components of the model are motivated by the nature of scientific communication that serves to track hypothesis building processes with tentative results, analogously to journalistic reports about breaking news. (Soni et al., 2014) focus on factuality framing in social media data in quoted claims with a small set of cues, whereas (Finn et al., 2014) implement keyword-based negation detection without providing quantitative evaluation.
Next to linguistically expressed uncertainty, extralinguistic information such as the temporal distri-bution of claims is shown to be an important aspect of veracity computation. Previous studies that investigated temporal patterns of linguistic cues tied to claims emerging in real-world events focus on keywords related to sentiment, named entities and domain terms (Temnikova et al., 2014), but not factuality-conveying cues. (Wei et al., 2013) report on the first uncertainty corpus based on tweets, as well as on classification results for uncertain tweets. Next to platform-specific metadata, they utilized cue phrases in annotated uncertain tweets and an algorithm to detect peaks in the data. (Kwon and Cha, 2014) and (Ma et al., 2015) show for rumor detection that accuracy can be improved by not only look-ing at message-related properties but also at how these properties change over time. (Ma et al., 2015) propose a time series structure for features and their deltas as the input for classification.
On the full PHEME dataset, (Lukasik et al., 2016) report on stance detection in the context of temporal dynamics. They utilize textual information via language modeling but do not evaluate the contribution of textual as opposed to other features. On the same dataset, (Zubiaga et al., 2016) analyzed labeled cer-tainty values in dependence of claim resolution, and found that tweeters post messages with statistically similar certainty before and after a claim is resolved, moreover, irrespective of the resolution value.
In (Lendvai et al., 2016) we analyzed and validated a subset of the PHEME data on English and German data that temporal distribution and polarity of lexical markers can be used to represent and quantify changes in factuality framing in a rumor’s lifecycle. Our current study furthers this research by incorporating, evaluating, and visualizing temporally anchored features for claim resolution point as well as claim resolution value prediction in English language rumors discussed in potentially noisy, user-generated content.
The paper is structured as follows. In Section 2 we introduce the underlying data and certainty annota-tions, and describe the automatic extension of lexical cues assigned to four levels of factuality. In Section 3 the relation between certainty and each of the factuality levels is assessed, and regression analysis is used for predicting certainty values by cue-type ratios. In Section 4 we quantify trend discontinuities in time series data of lexical cue ratios and predicted certainty scores to describe rumor resolution points. Cue ratios, certainty, as well as their time course characteristics are exploited in Section 5, where we train classifiers to identify claim-resolving tweets within series of tweets spanning a claim’s lifetime, and additionally predict the claim’s resolution value. The findings are discussed in Section 6.
2 Data
2.1 Corpus
We worked on a subset of a freely available, annotated social media corpus2 collected from the Twitter
platform3, containing tweets in English related to three crisis events: the Ottawa shooting4, the Sydney
Siege5, and the Germanwings crash6. Each event is annotated in terms of several rumorous claims7 –
plausible but at the time of emergence unconfirmed statements, e.g. in the Sydney Siege collection two example claims are ”There is a hostage situation at a cafe in Sydney” and ”Police (authorities) have been in contact with the hostage-taker”. For each claim, there are a set of tweets that discuss or mention that claim,
and a single one of these tweet has been manually identified and judged to be authoritatively resolving the claim either as true or false. A resolving tweet for the claim ”The Germanwings plane experienced
2https://figshare.com/articles/PHEME rumour scheme dataset journalism use case/2068650 3twitter.com
4https://en.wikipedia.org/wiki/2014 shootings at Parliament Hill, Ottawa 5https://en.wikipedia.org/wiki/2014 Sydney hostage crisis
6https://en.wikipedia.org/wiki/Germanwings Flight 9525
a rapid descent before crashing” is: #4U9525 took eight minutes to descend from 38,000 feet to impact, says Germanwings CEO Winkelmann; this rumor is annotated by a journalist as resolved True. The verification value is inherited by all the tweets that relate to this claim, also in retrospect. To ensure that there is always exactly a single resolving tweet per claim we discarded the unresolved claims in the given corpus so that the data underlying this study amounts 45 claims containing in sum 11,420 tweets. Tweets are organized into threaded conversations and are marked up with respect to seven categories of evidence, among others stance and certainty; for full details on the corpus we refer to (Zubiaga et al., 2015).
2.2 Certainty annotations
Certainty annotations were pre-assigned in the corpus in relation to stance value annotations by (Zubiaga et al., 2015). Stance represents speaker attitude toward a target: in this corpus, the target is a rumorous claim, and each tweet was manually marked as either supporting, denying, questioning, or commenting a claim. Tweets that received either of the stance labelssupportingordenyingwere additionally assigned a certainty value. This value served to express tweeter confidence with respect to their stance, as perceived by independent, crowdsourced annotators. Each tweet was annotated by 5-7 crowdsourced annotators, in terms of the four labelsuncertain, somewhat certain, certain, andunderspecified.
We further processed these annotations as follows. To cope with frequent annotation mismatches, we did not simply pick the majority-voted certainty label for our subsequent analyses, but aggregated the annotated values for each tweet as follows. The original certainty labels were mapped to the numerical values 0, 1, 2, andNaN, respectively. We then calculated the mean of all non-NaNvalues and normalized this to the interval between 0 and 1 by dividing it by the maximum score 2. For example, the tweet
”Now hearing 148 passengers + crew on board the #A320 that has crashed in southern French Alps. #GermanWings flight. @BBCWorld”was labeled as ’certain’ by 4 annotators and labeled as ’somewhat-certain’ by 1 annotator, so this tweet was assigned by us the certainty score of 0.9.
The intersection of tweets that relate to claims that were not only annotated as relating to a resolved claim, but also annotated with the three utilizable certainty labelsuncertain, somewhat certain, certain
left us with a relatively small amount of tweets (266), while we also had at our disposal a larger set of tweets (946) with claim resolution annotation but no certainty values assigned. We made use of both collections as described below.
2.3 Factuality cues: from seeds to extended lists
The material underlying our study is user-generated content. The data collection method, cf. (Zubiaga et al., 2015) retained only microposts that passed a retweet count threshold, often by media outlets using well-formed language. Since replying tweets are also included in the corpus, a large portion of the data involves noisy texts. Based on the factuality literature, most prominently (Saur´ı and Pustejovsky, 2009) and (Soni et al., 2014), we devised four factuality groups, each holding up to 40 single-token lexical cues. There is no restriction on which part of speech category a cue may belong to.
• Knowledgecues, e.g. clarify, confirm, definitely, discover, evidence, explain, official . . .
• Reportcues, e.g. according, capture, claim, footage, observe, report, say, show, source . . .
• Beliefcues, e.g. apparent, assume, believe, consider, perhaps, potential, presume, suspect . . .
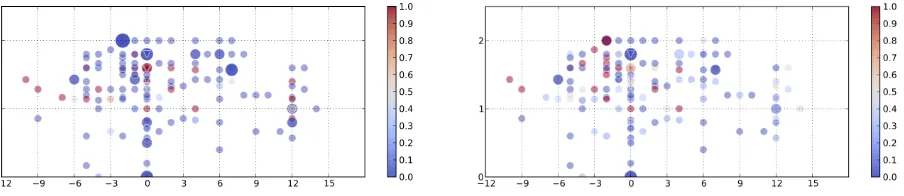
Figure 1: Color-coded factuality cue ratio (FCR) derived from matched cues in the two affirmative-polarity and high-commitment featuring factuality cue groups (’knowledge cue ratio’ + ’report cue ra-tio’), using seed cues (left) vs extended cues (right). Factuality ratios are plotted on perceived certainty patterns (cf. Section 2.2) in 163 argumentative Twitter microposts related to 5 rumorous claims resolved asTrueduring Sydney Siege. x axis: 10-minute intervals normalized toclaim resolution point at 0 (re-solving tweets marked by triangles), y axis:certainty scoreaveraged over perceived certainty judgments. Partial time window, size-coded amount of evidence.
require extracting higher-level linguistic information such as dependency parses, which are difficult to obtain from noisy data, and are reserved for the extended version of our system.
Starting from the seed cues, each of the four lists were automatically further populated from available semantic resources: via extracting the top-3 most similar items from the pretrained Google News word embeddings vector8, as well as lemmas from the top-3 synsets from the English WordNet (Fellbaum,
1998) via NLTK9 (Bird et al., 2009). Only single-token items were harvested; each cue token was
subsequently extended by its derivationally related forms via the corresponding NLTK function. Using the extended trigger lists, we obtained counts for each tweet via matching each cue list to a tweet’s content, applying the NLTK Snowball Stemmer10 prior to lookup. We have also experimented with
syntax-based cue disambiguation, but opted to abandon it for no proven impact on our current task setup. To exemplify cue matching, in the tweet ”#BREAKING: @nswpolice say a photo circulating of arrest of man near #MartinPlace is NOT related to the police operation #sydneysiege” our lookup matches two ’report’ cues (sayandphoto) and one ’doubt’ cue (not). The cue extension procedure boosted the seed lists with a few hundred new tokens per cue group, leading to more cue matches in tweets.
Arguably, there are cues that might belong to more than one factuality group, most prominently nega-tion words that, depending on their scope, may express certainty as well. We hypothesized however that utilizing the contextual distribution of a cue will represent its certainty-encoding function in rumor resolution timelines in a robust way. We exemplify such a timeline in Figure 1, differentiated by cer-tainty values plotted to the y axis. The increase in cue recall based on extended lists aimed to benefit the certainty and rumor resolution modeling steps that we introduce in the next sections.
Features derived from matched cues Based on the extended cue matching counts, for each tweet we calculated the proportion of cues for each factuality group over all cues: each proportion ranges from 0 (no cue of the respective type) to 1 (cues exclusively of the respective type). Each tweet is thus represented by the four ratiosKCR(’knowledge’ cue ratio),RCR(’report’ cue ratio),BCR(’belief’ cue ratio),DCR(’doubt’ cue ratio). TheRCRfor the above example tweet is 2/3, theDCR1/3, whileKCR
andBCRare 0.
3 Certainty prediction
Next, we examined the relation of cue ratios to certainty values assigned to tweets via regression analysis.
8http://code.google.com/p/word2vec/
Method To predict the degree of certainty for each tweet, we fitted generalized linear models (GLM) to the tweets manually annotated for perceived certainty. The four lexical cue ratios were defined as predictors and the certainty score (see Section 2.2) as target. To restrict the output to interval[0 1], the distribution of the response was set to binomial, and a logit link function was chosen. A zero inflation problem is given due to the frequent absence of cue words, which we addressed by adding observation weights to the data points as follows: for each of a predictor’s values the variance of the associated target values was measured, normalized by the variance sum, and its inverse taken. Zero values of a predictor co-occurring with a high variance of certainty values thus received a low weight when fed into the regression. The weight of each feature vector was then derived by taking the mean of the predictor-related weights.
Results Spearman’s Rho correlations between the single lexical cue ratios and the normalized certainty score are small. Only forKCR(.14) andDCR(−.39) the correlations are significant (Wilcoxon two sided signed rank tests for paired samples,p <0.05). These two correlations point in the expected direction. The 10-fold cross validation of the GLMs on held out data yielded an average root mean square error of 0.22 (maximum: 0.28), which is significantly lower than the error of the baseline model always predicting the observed mean certainty value (two-sided Wilcoxon signed rank test for paired samples,p < 0.01). Finally, we fitted a GLM to all available training data for certainty prediction of all tweets used for the subsequent claim resolution prediction and resolving tweet localization tasks.
4 Certainty trend quantification
Method In our approach we address time course characteristics more explicitly than previous studies (Kwon and Cha, 2014; Ma et al., 2015). That is, instead of bundling feature vectors at different time stamps to a joint vector, we capture time course characteristics by parameters of regression lines fitted through the feature values over time. These regression lines will be used for trend discontinuity analyses as described in detail below. By means of this analysis we augmented the set of variables the following way: for all four cue ratios and the derived certainty score we calculated four discontinuity features yielding five features for each cue ratio and certainty. These variables will be introduced in the following paragraphs and represent:
• tweet-intrinsic properties (lexical cue ratiosKCR,RCR,BCR,DCR, predicted certaintyCRT)
• local discontinuities across pairs of subsequent tweets (* Delta)
• global discontinuities in linear cue and certainty trends (* Reset, * RMSD p, * RMSD f), where the asterisk stands for the tweet-intrinsic variables, i.e. the cue ratios and certainty.
For measuring discontinuities, tweets were indexed in the order of their time stamps. Local discon-tinuities are measured in terms of the delta deviations of each tweetifrom the preceding tweet, i.e. by subtracting each intrinsic variable’s value of tweeti−1from the corresponding value of tweeti(* Delta). To quantify the amount of discontinuity a tweet induces in the overall trend of a variable, we fitted three regression lines: linelp through the intrinsic values of the preceding tweet sequence1. . . i−1, linelf
through the values of the following tweet sequencei+ 1. . . n(nbe the number of tweets in a claim), and linelathrough the entire tweet sequence1. . . n. The method is illustrated in Figure 2.
In order to measure the amount of discontinuity for each intrinsic variable at each tweet, we calculated the reset, i.e. the difference between the offset of lp and the onset of lf (Reset), and the deviation of
each of these lineslp andlf fromla in terms of root mean squared deviation (RMSD p, andRMSD f,
respectively). The method was adopted from intonation research (Reichel and M´ady, 2014), where it is used to quantify pitch discontinuities for prosodic boundary strength prediction.
Applying the reasoning of (Reichel and M´ady, 2014),Resetquantifies the disruption at each tweet, and
Figure 2: KCR trend analysis. For each tweet (green vertical line) three regression lines are fitted to theKCRsequence (black): to the preceding and the following sequence (lp,lf; blue), and to the entire
rumor (la; red), the latter representing the general trend. For resolving tweets (right)lp andlf deviate
more from a common trend, which is expressed by a larger reset as well as by larger root mean squared deviation values from the overall trend linela.
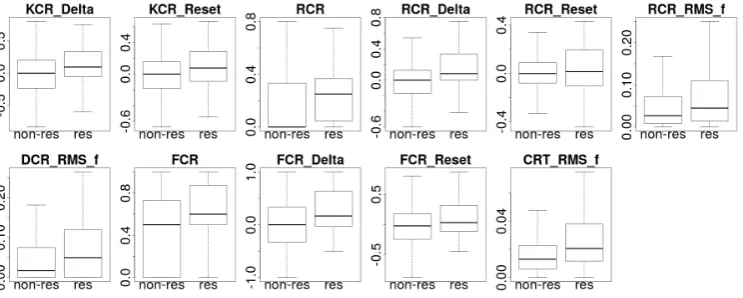
Results For all five tweet-intrinsic measures as well for the related sets of four derived local and global discontinuity measures we tested the difference between resolving and non-resolving tweets by linear mixed-effect models with each of the measures as dependent variable,+/−resolving tweet(RES) and
Rumor is Resolved as True vs False(VAL) as the fixed effects, andeventas random effect. Due to the large number of tests p-values were corrected for false discovery rate (Benjamini and Yekutieli, 2001). All significant feature differences (after p-value correction,p <0.05) forRESare shown in Figure 3.
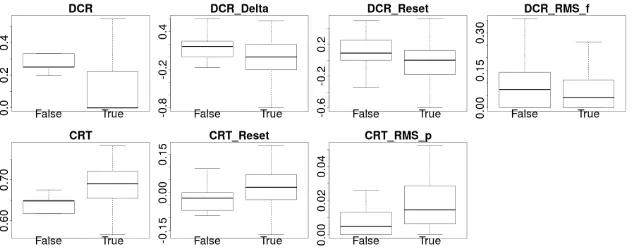
The claim resolution value VAL turned out to affect the variables related to doubt cue ratio and to predicted certainty which is shown in Figure 4 (p < 0.01). Significant interactions betweenRES and
VAL solely affect the doubt cue and certainty variables and are presented in Figure 5. All reported findings are discussed in Section 6.
5 Predicting the resolving tweet and its resolution value
As illustrated in Section 4 the distinction of tweets in rumor resolving and non-resolving as well as their resolution values have an impact on several of the examined cue ratio, certainty and discontinuity variables. Our next step thus was to use these variables to predict:
• for each tweet whether it resolves a rumor or not (RES),
• for each resolving tweet, whether its resolution value is True or False (VAL).
[image:6.595.114.486.554.703.2]Figure 4: Significant differences for resolving tweets in claims validated asTrue vsFalse. Inverified
claims, resolving tweets show higher certainty cue (CRT) related values than non-resolving tweets. In
falsifiedclaims, resolving tweets show higher doubt cue (DCR) related values than non-resolving tweets.
Method For both binary classification tasks we enlarged the feature vector for each tweet by tweet density, i.e. the mean number of tweets per minute in a 10 minutes time window centered on the respec-tive tweet. As for the features introduced above, also together with tweet density its four discontinuity measures (cf. Section 4) were added. We then subdivided the features into two sets:
• CueSet: consisting of all lexical knowledge, report, belief, and doubt cue ratios, their derived dis-continuities, as well as tweet density and its discontinuities.
• CertSet:consisting of the predicted certainty values (cf. section 3) and their discontinuities instead of the raw cue ratios, and of the tweet density features.
This division serves to test whether raw cue ratio or derived certainty features are better suited for the two classification tasks. TaskRESis carried out on all tweets in our data, whereas taskVALonly applies to resolving tweets. Both tasks were carried out and evaluated in isolation to independently assess the respective performance. That is, the training and testing items forVAL were not taken over from the precedingRESclassification output but from the original data set.
Since in both data sets the target value distributions are highly skewed, we applied resampling without replacement to avoid overlaps of training and test items in subsequent 10-fold cross-validation. The maximum sample size was determined as a weighted mean of the given sample sizes to ensure that for
VALand forRESthe more frequent class occurs maximally twice as often as the less frequent one. By this resampling the amounts of claims and tweets (cf. section 2.1) were reduced to 39 (13 falsified, 26 verified claims) and 138 (46 resolving, 92 non-resolving tweets), respectively.
We then applied AdaBoostM1 classifiers (Freund and Schapire, 1999) (Matlab function fitensemble, 40 weak learners, minimum 2 items per leaf and 3 items per non-final node) to both data sets and com-paratively evaluated the results in a ten-fold cross validation.
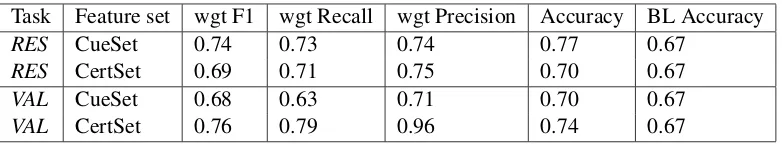
Results Table 1 summarizes the mean performance values on the held-out data after cross-validation.
[image:7.595.115.475.643.721.2]BL Accuracyrepresents the baseline performance which is defined as predicting only the most frequent class and is quite high due to the not entirely resolved skewedness. The results are discussed in the next section.
Task Feature set wgt F1 wgt Recall wgt Precision Accuracy BL Accuracy
RES CueSet 0.74 0.73 0.74 0.77 0.67
RES CertSet 0.69 0.71 0.75 0.70 0.67
VAL CueSet 0.68 0.63 0.71 0.70 0.67
[image:8.595.105.496.61.133.2]VAL CertSet 0.76 0.79 0.96 0.74 0.67
Table 1: Average results after 10-fold cross validation on held-out data for the two tasks: tweet resolution (RES) and resolution value (VAL) prediction and the two feature sets CueSet (lexical cue ratios) and
CertSet(predicted certainty values).
6 Discussion and conclusion
Relation between lexical cues and certainty As described in Section 3, we established a link between lexical cue ratios of different certainty levels and the certainty associated to tweets by means of regression analysis. The zero-inflation problem as well as the reported low correlations between each cue ratio and the certainty values indicate that factuality values cannot fully be expressed by cue-type ratios in isolation but require a more complex model. Applying GLMs to bundle and therefore strengthen these weak relations was a first step in this direction. Certainty is a discourse-level phenomenon that lexical means can represent to some extent but not entirely. In future work we are going to address the representation of certainty phenomena related to higher linguistic levels.
Impact of rumor resolution on cue ratios and certainty As pointed out in Section 4, for several examined cue ratio and certainty variables significant differences were observed with respect to claim resolution and resolution value. Resolving tweets show higher knowledge (KCR) and report cue ratios (RCR) as well as related discontinuities. Positive resets mark an abrupt increase in knowledge and report cues at the time point of resolution. This is even more pronounced when combining both cue ratio related features to a common one, the factuality cue ratio (FCR=KCR+RCR). Claim resolution has a major impact on the distribution of lexical cues associated with a high certainty level, as after resolution their amount increases. Belief cue ratios, on the contrary, have not proven to be of relevance for distinguishing between resolving and non-resolving tweets. Doubt cue and certainty variables are additionally highly dependent on the claim resolution value. Doubt cues occur more often in falsified claims and show a higher increase after claim resolution when compared to verified claims (DCR Delta, DCR Reset, DCR RMS f). Certainty cues behave exactly the opposite way: they are generally more frequent in verified claims (CRT) and at the resolution point they show an upward shift in verified but a downward shift in falsified claims (CRT Reset). These interpretations are further supported by the
RES-VAL interactions for the doubt cue and certainty variables, i.e. the amount and the direction of discontinuity at the resolution point of doubt cues and certainty values depends on whether the claim is verified or falsified.
Prediction of resolution and its value Table 1 shows that the prediction tasks benefit from the feature sets in different ways. For taskRES, the lexical cue setCueSetturned out to be more appropriate, while forVALthe certainty valuesCertSet. The reason might be that forVALonly resolving tweets and thus a lower amount of data is available suggesting the utility of shorter vectors containing derived instead of raw features. Importantly for sparse data scenarios, the generation of such an intermediate level of cue-integrating features, in our case the predicted certainty, turns out to be beneficial.
References
Yoav Benjamini and Daniel Yekutieli. 2001. The control of the false discovery rate in multiple testing under
dependency. Annals of Statistics, 29:1165–1188.
Laure Berti- ´Equille and Javier Borge-Holthoefer. 2015. Veracity of data: From truth discovery computation
Steven Bird, Ewan Klein, and Edward Loper. 2009. Natural Language Processing with Python. O’Reilly Media. Marie-Catherine de Marneffe, Christopher D Manning, and Christopher Potts. 2012. Did it happen? the pragmatic
complexity of veridicality assessment.Computational Linguistics, 38(2):301–333.
Rich´ard Farkas, Veronika Vincze, Gy¨orgy M´ora, J´anos Csirik, and Gy¨orgy Szarvas. 2010. The CoNLL-2010
Shared Task: Learning to detect hedges and their scope in natural language text. InProceedings of the 14th
Conference on Natural Language Learning.
Christiane Fellbaum, editor. 1998.WordNet: An Electronic Lexical Database. MIT press, Cambridge, MA.
Samantha Finn, Panagiotis Takis Metaxas, and Eni Mustafaraj. 2014. Investigating rumor propagation with
TwitterTrails. arXiv preprint arXiv:1411.3550.
Yoav Freund and Robert E. Schapire. 1999. A short introduction to boosting. J. Japanese Society for Artificial
Intelligence, 14(5):771–780.
Halil Kilicoglu, Graciela Rosemblat, Michael J Cairelli, and Thomas C Rindflesch. 2015. A compositional
interpretation of biomedical event factuality. ExProM 2015, page 22.
Sejeong Kwon and Meeyoung Cha. 2014. Modeling bursty temporal pattern of rumors. InProc. ICWSM, pages
650–651.
Piroska Lendvai, Uwe D Reichel, and Thierry Declerck. 2016. Factuality drift assessment by lexical markers in
resolved rumors. InJoint Proceedings of the Posters and Demos Track of the 12th International Conference
on Semantic Systems (SEMANTiCS 2016) and the 1st International Workshop on Semantic Change & Evolving Semantics, Leipzig.
Jure Leskovec, Lars Backstrom, and Jon Kleinberg. 2009. Meme-tracking and the dynamics of the news cycle. In
Proc. of KDD-09.
Michal Lukasik, P.K. Srijith, Duy Vu, Kalina Bontcheva, Arkaitz Zubiaga, and Trevor Cohn. 2016. Hawkes Processes for Continuous Time Sequence Classification: An Application to Rumour Stance Classification in
Twitter. InProceedings of ACL-16.
Jing Ma, Wei Gao, Zhongyu Wei, Yueming Lu, and Kam-Fai Wong. 2015. Detect rumors using time series
of social context information on microblogging websites. InProceedings of the 24th ACM International on
Conference on Information and Knowledge Management, pages 1751–1754. ACM.
Roser Morante and Eduardo Blanco. 2012. *SEM 2012 shared task: Resolving the scope and focus of negation. InProceedings of the First Joint Conference on Lexical and Computational Semantics.
Roser Morante and Caroline Sporleder, editors. 2012. ExProm ’12: Proceedings of the ACL-2012 Workshop on
Extra-Propositional Aspects of Meaning in Computational Linguistics. Association for Computational Linguis-tics.
Rob Procter, Farida Vis, and Alex Voss. 2013. Reading the riots on Twitter: methodological innovation for the
analysis of big data.International Journal of Social Research Methodology, 16(3):197–214.
Vahed Qazvinian, Emily Rosengren, Dragomir R. Radev, and Qiaozhu Mei. 2011. Rumor has it: Identifying
misinformation in microblogs. InProceedings of the Conference on Empirical Methods in Natural Language
Processing, EMNLP ’11, pages 1589–1599.
Uwe D. Reichel and Katalin M´ady. 2014. Comparing parameterizations of pitch register and its discontinuities at
prosodic boundaries for Hungarian. InProc. Interspeech 2014, pages 111–115.
Roser Saur´ı and James Pustejovsky. 2009. Factbank: A corpus annotated with event factuality. Language
Re-sources and Evaluation, 43(3).
Roser Saur´ı and James Pustejovsky. 2012. Are you sure that this happened? Assessing the factuality degree of
events in text.Computational Linguistics, 38(2):261–299.
Sandeep Soni, Tanushree Mitra, Eric Gilbert, and Jacob Eisenstein. 2014. Modeling factuality judgments in social
media text. InIn Proc. of ACL.
Gy¨orgy Szarvas, Veronika Vincze, Rich´ard Farkas, Gy¨orgy M´ora, and Iryna Gurevych. 2012. Cross-genre and
Irina P Temnikova, Andrea Varga, and Dogan Biyikli. 2014. Building a crisis management term resource for
social media: The case of floods and protests. InLREC, pages 740–747.
Erik Velldal and Jonathon Read. 2012. Factuality detection on the cheap: Inferring factuality for increased
preci-sion in detecting negated events. InProceedings of the ACL-2012 Workshop on Extra-Propositional Aspects of
Meaning in Computational Linguistics.
Zhongyu Wei, Junwen Chen, Wei Gao, Binyang Li, Lanjun Zhou, Yulan He, and Kam-fai Wong. 2013. An
Empirical Study on Uncertainty Identification in Social Media Context. InProceedings of ACL.
Arkaitz Zubiaga, Maria Liakata, Rob Procter, Kalina Bontcheva, and Peter Tolmie. 2015. Towards Detecting
Rumours in Social Media. CoRR, abs/1504.04712.
Arkaitz Zubiaga, Maria Liakata, Rob Procter, Geraldine Wong Sak Hoi, and Peter Tolmie. 2016. Analysing how