Twitter Geolocation Prediction Shared Task of the 2016 Workshop on
Noisy User-generated Text
Bo Han
Hugo AI Sydney, Australia [email protected]
Afshin Rahimi
The University of Melbourne Melbourne, Australia
Leon Derczynski
The University of Sheffield Sheffield, UK [email protected]
Timothy Baldwin
The University of Melbourne Melbourne, Australia
Abstract
This paper describes the shared task for the English Twitter geolocation prediction associated with WNUT 2016. We discuss details of the task settings, data preparation and participant sys-tems. The derived dataset and performance figures from each system provide baselines for future research in this realm.
1 Introduction
With ever-increasing numbers of people interacting with social media, social data has become a gold mine of insights into the people, opinions and events of the world. Perhaps the greatest insights come when that data is partitioned into meaningful sub-populations, with one of the most obvious such parti-tioning dimensions being geographical. In many social platforms, however, geographical information is either missing, incomplete or not accessible. This greatly restricts the utility of social data for location-related applications such as regional sentiment analysis, local event detection, and geographically-bounded marketing and healthcare. This shared task focuses on predicting geographical location (i.e., geotagging) using English Twitter text data. The task provides a benchmark dataset for comparing differ-ent geotagging methods, and more generally sheds light on how to expand geotagging from social media to a more general domain.
In this shared task paper, we present the task scope and evaluation metrics; how training, development and test data were collected and filtered; and we also summarise and compare the key innovations of each participant system. Overall, we had five teams submit 21 results. Three of the five teams described their approach in peer-reviewed papers. We found that the system from FUJIXEROX achieved the best
median distance error, using a neural net, and that the system from CSIRO using an ensemble had the highest accuracy and a competitive median distance error.
2 Geotagging Shared Task
In machine learning terms, the geotagging shared task can be expressed as two different problems. By assigning a latitude/longitude pair to a given input tweet and measuring the distance between the pre-dicted point and the true GPS labelled point, it can be cast as a (multi-target) regression problem. If the aim is to predict one from a set of pre-defined mutually exclusive classes (e.g. metropolitan city centres), then geotagging becomes a multiclass classification problem. In this shared task, we adopt the later classification setting. Participants were given training and development data based on metropolitan
This work is licensed under a Creative Commons Attribution 4.0 International Licence. Licence details: http:// creativecommons.org/licenses/by/4.0/
city representations derived fromGeoNames.1 The goal is to predict the class label (i.e. city) for each
item in the test dataset.
The shared task was carried out on two levels: tweet-level and user-level. The tweet-level is more practical in real world applications, as a tweet is a basic text unit created by a Twitter user and often is associated with a unique location. However, because a single tweet text can be terse and will often not contain explicitly geolocating information, the more popular setting for geolocation research has been user-level prediction, aggregating a user’s tweets. This assumes that each user has a primary location, and that the primary location can be inferred from the aggregated tweet data.
To comply with Twitter’s terms of service, participants were given tweet IDs and a downloading script to obtain data and annotations. Participants then built geotagging systems using the released training and development data. When the test data was released, participants had three days to run their experiments and submit results.
The shared task has the following goals:
1. Provide a large-scale carefully-sampled dataset for the Twitter geotagging task, and as an enabler for future research on the topic;
2. Evaluate the effectiveness of different methods within a consolidated experimental setting, to better benchmark geotagging methods;
3 Datasets and Evaluation
As a compromise between the competing desires to provide a comprehensive, large-scale dataset, and to provide a manageably-sized dataset, we selected 1 million users for training, and 10K users for develop-ment and test, respectively. Each user has a unique class label to denote their primary location. The class labels are derived from metropolitan city centres inGeoNames, following Han et al. (2012). In total, the class set is made up of 3362 cities. The training data for the tweet-level task is based on a unique tweet from each of the same 1 million users. The development and test data sizes are both 10K messages in size, different from the user-level development and test data. We deliberately chose to keep strict separation between the data for the user- and tweet-level tasks to prevent the use of user-level predictions for the tweet-level task. A team could have up to 5 members, and submit up to 3 three runs for each of the two tasks.
We filter geotagged tweets from 2013 to 2016 via archived data from the 10% Twitter Streaming API. All the training and development data is from 2013 to 2015. For the test data, 50% is from 2013 to 2015, and the other half is from 2016. This is reserved for analysis of the impact of temporal differentiation on model generalisation (Han et al., 2014; Dredze et al., 2016). All tweets are filtered by Twitter’s language ID code, retaining only those which are labelled as English. We run the filter in two passes: in the first round, we take all users with geotagged tweets; and in the second pass, we only keep users with at least 10 geotagged tweets. The requirement of 10 geotagged tweets was determined empirically, to get a reliable estimation of a user’s primary location, while avoiding incorporating bot-generated messages. To be eligible as a data record in the geotagging dataset, a user must have 50% of their tweets coming from the same metropolitan area.2 The number of unfiltered geotagged tweets was initially 419M, from
which 172M English tweets were extracted. After filtering out users with less than 10 geotagged tweets and those who didn’t have at least 50% of tweets from a single city, we randomly chose 1M users for training and 10k each for the development and test sets. The training set consists of 12.8M tweets, the user-level development and test sets consist of 128k and 99k tweets, respectively, and the tweet-level development and test sets each contain 10k tweets.
Candidate geotagging systems were evaluated using three metrics. “Accuracy” indicates how well a given system performs in a “hard” classification task setting, in terms of whether they correctly predict the city or not. In comparison, distance-based metrics (relative to the centre of the city the user is assigned to) provide a “soft” evaluation, in the sense that they reward near-miss predictions, and penalise
1http://www.geonames.org/
SUBMISSION ACCURACY MEDIAN MEAN FUJIXEROX.2 0.409 69.5 1792.5
CSIRO.1 0.436 74.7 2538.2 FUJIXEROX.1 0.381 92.0 1895.4
CSIRO.2 0.422 183.7 2976.7 CSIRO.3 0.420 226.3 3051.3
DREXEL.3 0.298 445.8 3428.2
AIST.1 0.078 3092.7 4702.4 IBM.1 0.146 3424.6 5338.9
DREXEL.2 0.082 4911.2 6144.3
[image:3.595.172.426.267.440.2]DREXEL.1 0.085 5848.3 6175.3
Table 1: Tweet-level results ranked by median error distance
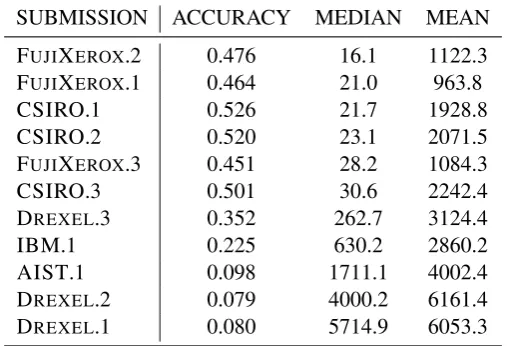
SUBMISSION ACCURACY MEDIAN MEAN FUJIXEROX.2 0.476 16.1 1122.3
FUJIXEROX.1 0.464 21.0 963.8
CSIRO.1 0.526 21.7 1928.8 CSIRO.2 0.520 23.1 2071.5 FUJIXEROX.3 0.451 28.2 1084.3
CSIRO.3 0.501 30.6 2242.4
DREXEL.3 0.352 262.7 3124.4
IBM.1 0.225 630.2 2860.2 AIST.1 0.098 1711.1 4002.4
DREXEL.2 0.079 4000.2 6161.4
DREXEL.1 0.080 5714.9 6053.3
Table 2: User-level results ranked by median error distance
wildly-wrong predictions. Specifically, as our distance-based metrics, we measure (in kilometres): (a) the median error distance; and (b) the mean error distance. Although distance-based metrics are more intuitive, class-based predictions such as city labels are often easier to use in downstream applications.
4 Systems and Results
In total, 5 teams uploaded 21 runs, among which 3 teams submitted system description papers.
Miura et al. (2016) (“FUJIXEROX”) applied vectorised inputs in linear models for both tweet-level
and user-level geotagging tasks. They used tweet text, user self-declared locations, timezone values, and user self-descriptions as input sources. Each source of input is transformed from a one-hot bag-of-word representation into a vector. Vectors from the same source are averaged, and vectors from different sources then are concatenated and used as the input to linear models. A softmax function is used to select the most probable class.
SUBMISSION ACCURACY MEDIAN MEAN ACCURACY MEDIAN MEAN FUJIXEROX.2 0.377 77.7 1205.4 0.441 60.9 2379.6
CSIRO.1 0.344 230.4 2242.7 0.529 10.1 2833.7 FUJIXEROX.1 0.345 105.9 1594.1 0.417 79.7 2196.7
CSIRO.2 0.319 649.3 2811.6 0.525 10.1 3141.8 CSIRO.3 0.315 689.8 2773.6 0.524 10.2 3329.0
DREXEL.3 0.270 605.8 3531.5 0.327 340.7 3324.8
AIST.1 0.063 2259.1 3886.4 0.093 4164.1 5518.5 IBM.1 0.121 3105.8 4867.5 0.170 3852.7 5810.3
DREXEL.2 0.074 3800.3 5461.5 0.089 6897.3 6827.1
[image:4.595.93.510.64.223.2]DREXEL.1 0.078 5498.6 5616.0 0.091 6986.7 6734.5
Table 3: Tweet-level results comparison for pre 2016 (left) and 2016 (right) test sets
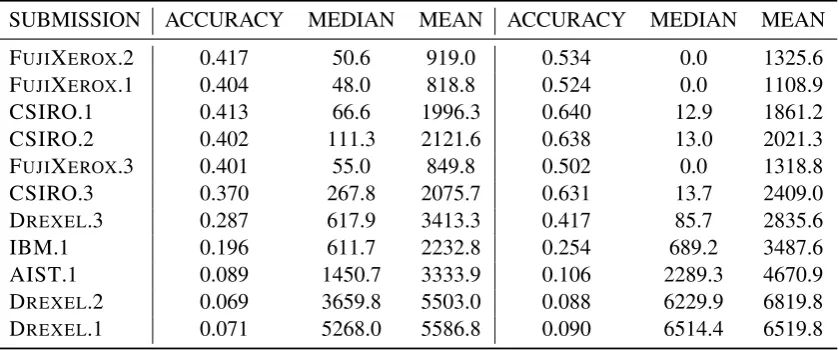
SUBMISSION ACCURACY MEDIAN MEAN ACCURACY MEDIAN MEAN FUJIXEROX.2 0.417 50.6 919.0 0.534 0.0 1325.6
FUJIXEROX.1 0.404 48.0 818.8 0.524 0.0 1108.9
CSIRO.1 0.413 66.6 1996.3 0.640 12.9 1861.2 CSIRO.2 0.402 111.3 2121.6 0.638 13.0 2021.3 FUJIXEROX.3 0.401 55.0 849.8 0.502 0.0 1318.8
CSIRO.3 0.370 267.8 2075.7 0.631 13.7 2409.0
DREXEL.3 0.287 617.9 3413.3 0.417 85.7 2835.6
IBM.1 0.196 611.7 2232.8 0.254 689.2 3487.6 AIST.1 0.089 1450.7 3333.9 0.106 2289.3 4670.9
DREXEL.2 0.069 3659.8 5503.0 0.088 6229.9 6819.8
DREXEL.1 0.071 5268.0 5586.8 0.090 6514.4 6519.8
Table 4: User-level results comparison for pre 2016 (left) and 2016 (right) test sets
method in the validation stage, and if no results are found, backing off to the next classifier. As highly accurate methods rely on location-based services or reliable social network information, this ensemble approach is primarily precision-oriented.
Chi et al. (2016) (“IBM”) applied multinomial naive Bayes methods over different sets of features. Unlike other teams, they only used tweet text data in their system. The system used an existing set of location-indicative words, gazetted location names fromGeoNames, hashtags, users mentions, and a combination of all of these features. In addition, a frequency-based method was used to filter the combined feature set. Experimental results show feature selection over the methods combined achieved the best results across all metrics.
Tweet-level and user-level results are shown in Table 1 and Table 2, respectively. FUJIXEROXachieved
the best median error distance. The best accuracy was achieved by CSIRO; this system also achieved very competitive median error distance. Both teams systematically used metadata embedded in tweets, which supports the hypothesis that metadata contains abundant high-quality location information (Han et al., 2014). Nonetheless, the system from IBM provides insights into how well pure text-based methods can perform. Unfortunately the other two teams did not submit description papers, and we do not have insights into the methods they experimented with.
[image:4.595.90.510.268.443.2]representation, but provides further evidence that metadata plays a major role in geotagging.
Our test data consists of 5K 2016 data and 5K 2013-2015 data. We also show results for those two subsets in Figure 3 and Figure 4 to analyse the temporal impact. Interestingly, we found that 2016 test cases are more likely to predict compared with pre 2016 data in terms of accuracy and median distance error. As the 2016 test data is from new users created in 2016, this suggests people are more open to sharing their location information either in their profiles or in the tweet text data.
5 Conclusion and Future work
This paper presents an overview of the English Twitter geolocation prediction shared task. It detailed the two tasks, data preparation process, and evaluation metrics used in the shared task. It also outlined the approaches adopted by the participant systems, and reported results across multiple metrics. We found that tweet metadata offers abundant high-quality location information, which contributes to the geotagging tasks at both the tweet- and user-level. In the future, we plan to make the data replication procedure easier, allowing a wider audience to evaluate systems and compare with others.
Acknowledgements
Leon Derczynski acknowledges partial support from the EC under the 7th Framework Programme in the form of grant No. 611223, PHEME.
References
Lianhua Chi, Kwan Hui Lim, Nebula Alam, and Christopher J. Butler. 2016. Geolocation prediction in Twitter using location indicative words and textual features. In Proceedings of the 2nd Workshop on Noisy
User-generated Text (WNUT), Osaka, Japan.
Mark Dredze, Miles Osborne, and Prabhanjan Kambadur. 2016. Geolocation for twitter: Timing matters. In
Proceedings of the 2016 Conference of the North American Chapter of the Association for Computational
Linguistics: Human Language Technologies, pages 1064–1069.
Bo Han, Paul Cook, and Timothy Baldwin. 2012. Geolocation prediction in social media data by finding location indicative words. InProceedings of the 24th International Conference on Computational Linguistics (COLING
2012), pages 1045–1062, Mumbai, India.
Bo Han, Paul Cook, and Timothy Baldwin. 2014. Text-based Twitter user geolocation prediction. Journal Artificial Intelligence Research (JAIR), 49:451–500.
Gaya Jayasinghe, Brian Jin, James Mchugh, Bella Robinson, and Stephen Wan. 2016. CSIRO Data61 at the WNUT geo shared task. InProceedings of the 2nd Workshop on Noisy User-generated Text (WNUT), Osaka, Japan.
Yasuhide Miura, Motoki Taniguchi, Tomoki Taniguchi, and Tomoko Ohkuma. 2016. A simple scalable neural networks based model for geolocation prediction in Twitter. In Proceedings of the 2nd Workshop on Noisy