Raffaele Pinardi1, Fabio Garzia1,2, Roberto Cusani1
1Department of Information, Electronics and Telecommunications Engineering Sapienza University of Rome, Rome, Italy 2Wessex Institute of Technology, Southampton, UK
Email: [email protected]
Received September 4, 2012; revised October 12, 2012; accepted October 22, 2012
ABSTRACT
The aim of this work is the development of a steganographic technique for the MP3 audio format, which is based on the Peak Shaped Model algorithm used for JPEG images. The proposed method relies on the statistical properties of MP3 samples, which are compressed by a Modified Discrete Cosine Transform (MDCT). After the conversion of MP3, it’s possible to hide some secret information by replacing the least significant bit of the MDCT coefficients. Those coeffi-cients are chosen according to the statistical relevance of each coefficient within the distribution. The performance analysis has been made by calculating three steganographic parameters: the Embedding Capacity, the Embedding Effi-ciency and the PSNR. It has been also simulated an attack with the Chi-Square test and the results have been used to plot the ROC curve, in order to calculate the error probability. Performances have been compared with performances of other existing techniques, showing interesting results.
Keywords: Peak-Shaped Steganography; MP3 Steganography
1. Introduction
Steganography techniques are used to hide secret infor- mation in the most common audio/video formats. There are three main different kinds of audio/video stegano- graphy [1]:
1) insertion steganography, where the secret message is inserted in the cover object;
2) substitution steganography, where some bits of the cover object are substituted with the bits of the secret message;
3) constructing steganography, where an ad hoc cover object is generated to contain the secret message.
The developed technique is based on LSB steganogra- phy, a substitution steganography, that replaces the least significant bit of the audio/video file with the secret message bit. This method is very simple to implement and does not allow the human eye/hear to perceive sig- nificant changes in the stego object. In Figure 1 an ex- ample is shown: the letter “A” is embedded in the audio samples replacing the least significative bit.
However, this technique has lower resistance to the statistical attacks since with a proper steganalysis it is possible to detect the secret information. To solve this problem, Model Based Steganography can be used [2]. The cover object is divided into two parts, a
relevant, and it will not be modified. The second one is less relevant with respect the other and it will contain the secret message. The division is based on the statistical model of the cover object.
After the embedding process, x contains the secret
information, called x. The union between this part and
a
x is the stego object.
The purpose of this paper is to present a new steg- anographic algorithm for the MP3 [3-5] format based on the change, in the Peak Shaped Based for the JPEG [6], of the discrepancy equation, adapting it to vectors and studying the statistical distribution of the MDCT [3-5] coefficients. In the following the analysis of the per- formance of the proposed algorithm is shown and it is demonstrated that this method does not introduce audible distortion when the signal audio is reproduced. Further, it is demonstrated that this method does not create relevant statistical differences in the samples distribution, show- ing its suitability for steganographic applications and its robustness to steganographic attacks.
2. The MP3 Format and Compression
The MP3 format was born to have good audio quality and low file size [3,4]. An audio file is first converted into a digital format, with a sampling, and then it is processed with the human psychoacoustic model [3-5]. x and x,
Figure 1. LSB example: the letter “A” is inserted into an audio file by replacing the least significant bit.
With this model it is possible to delete the frequency that the human ear can’t hear; an algorithm characterized by this properties is called “lossy” because it deletes some information. This happens with a compression, that uses the MDCT [3,5], the Modified Discrete Cosine Trans- form, described in the following equation:
2 1
k 0 k
n M
X x n h n
(1)that is another version of the DCT-II used in the JPEG format, where:
2 cos
2 1
4
k
n M h n w n
M M
2k 1 π
w n
(2)
and is a window (it is possible to choose dif- ferent kinds of windows).
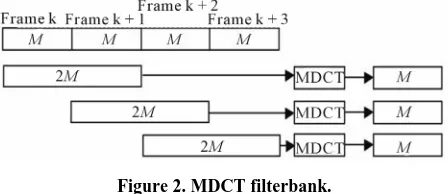
The audio samples are processed in a MDCT filter- bank. The audio sequence is divided in “frame”, each fra- me contains M samples and is processed as in Figure 2.
3. Peak Shaped Based Steganography
and MP3
3.1. Peak Shaped Based Steganography
The Peak Shaped Based (PSB) [6] steganography has been used for the JPEG format. This is a method based on:
LSB steganography; Least significant bit;
Model Based steganography [2].
The JPEG coefficient are, for first, divided by group, indicated with g(b) [6]:
sign2 b b
g b (3)
and by offset, indicated with O(b) [6]:
2g b 1O b b (4)
[image:2.595.311.535.87.184.2]where b is the JPEG coefficient and b 1.
Figure 2. MDCT filterbank.
The PSB algorithm is based on an assumption, from the properties of the JPEG coefficients statistical distri- bution processed by the algorithm F5, which is [6]:
1
h b h b (5)
1
1
2
h b h b h b h b (6)
where h(b) indicates the histogram of the coefficient b.
With this assumption is possible to calculate a probabi- lity, called “offset probability”.
Subsequently the coefficients are processed with the “discrepancy”, an operator that allows to calculate the statistical dependence between two closer coefficients. This is defined as follows:
4 64 0 1 1 0
ˆ ˆ
4
i j j
i
j i
q b b
S
, ˆ
2 ,
j j i i j
i j j i i
b b x b
(7)
where [6]:
g b b x
(8)
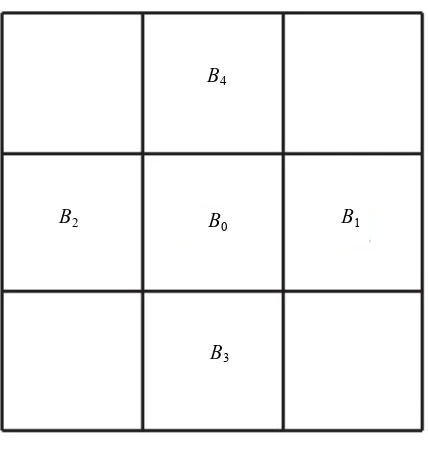
where, as shown in Figure 3, the blocks from 1 to 4 are the neighbors of the 0th. Each block contains 64 DCT-II
coefficient, 8*8, and their sequences composing the JPEG image.
3.2. Differences between JPEG and MP3
To apply the PSB algorithm to the MP3 format it is nece- ssary to study the differences between this format and the JPEG standard, in order to identify possible changes. These differences are:
the JPEG uses the DCT-II while the MP3 uses the MDCT;
the JPEG works on blocks; each blocks, or matrix, size is 8*8. Instead, the MP3 works on frame; each frame has dimension equal to 1*1152, that are vec- tors;
the PSB is based on an assumption from the F5 algo-rithm, that is used for the JPEG format.
B0
B3
B2 B1
[image:3.595.69.283.82.308.2]k
Figure 3. Adjacent blocks to the block B0.
Concerning the second point, it is necessary to detect the operations that in the PSB works on matrix and, to apply it on the MP3 format, transforming them in opera- tions that works on vectors.
Concerning the third point, it should be studied the statistical distribution of the MP3 coefficients after the F5-algorithm in order to identify if this distribution has the same properties than the JPEG distribution processed by F5.
3.2.1. MP3 Discrepancy
The JPEG discrepancy works on matrix, as described in paragraph 3.1. It is necessary to modify this operation to enable it to operate on vectors. Considering the MP3 format, and the MP3 frames, it is possible to call one of them as 0. The discrepancy works on the previous
[image:3.595.311.534.87.178.2]frame and the subsequent. The frames are showed in Figure 4. The mean is done only for 2 frames because 2 frames are taken and each frame contains 576 coeffi- cients.
2
0
S
576 0 1 1ˆ ˆ
2
i j j
i
j i
q b b
ˆ
(9)
where j i
b is the same as in the JPEG discrepancy.
3.2.2. Statistical Distribution of the MP3 Coefficients The statistical distribution of the MP3 coefficients, after the compression, is Peak Shaped [7]. This trend can be modeled by the Generalized Gaussian (GG). The GG varies with a parameter, called r, and it is possible to choose different values of r, i.e. r = 2 is a Gaussian, r = 1
is a Laplacian etc. A good approximation for the distri- bution of the MP3 coefficient has the value r set to 0 or 1,
Figure 4. The frames on which works the MP3 discrepancy. as shown in Figure 5.
With the parameter r set to 0.5, it is possible to have
the best approximation of the statistical distribution. It is possible to choose the value r = 1, the Laplacian distri-
bution, to have a good approximation with low comple- xity.
The Laplacian distribution is used to approximate the statistical distribution of the JPEG coefficients, as well [8-10].
3.3. The PSB over MP3
Using the previous considerations, it is possible to apply the Peak Shaped Based steganography to the MP3 format. In fact it is possible to utilize the assumption used by this algorithm from the F5 [11] steganography because the MP3 coefficients and the JPEG coefficients have the same statistical distribution. F5 modifies the coefficients, without considering their source.
Having both formats, namely both transformed, the same statistical distribution of the coefficients, the use of different transformed becomes irrelevant to the develop- ment of the algorithm.
3.4. The Embedding Process
In the following, the list of steps of the embedding pro- cess is reported:
the first step is represented by the analysis of the MP3 statistical distribution;
successively the value of Hg vector that contains the histograms of the MP3 is calculated;
with the Hg values it is possible to exclude the sam-ples that are statistical most significant;
the Hg values allow the calculus, with the algorithm shown in Figure 6, of the offset probability vector, called P;
each frame of the MP3 file, that contains 576 coe- fficients, is taken and analyzed;
the coefficients b are divided by group, with the g(b)
(4), and by offset, with the O(b) (5);
the discrepancy is calculated by means of Equation (9);
with the discrepancy, the vector P and a PRNG, ac-
0.6
0.5
0.4
0.3
0.2
0.1
0
r = 0.5 r = 1.0 r = 1.5 r = 2.0 0
Co
ef
fi
ci
en
t V
al
ues
[image:4.595.61.282.88.240.2]Statistical distribution of MDCT coefficients
Figure 5. Statistical distribution of the MP3 coefficients approximated with the GG [7].
Figure 6. Block diagram of the calculus of the offset pro- bability vector P.
nate the coefficients that contain the stego message; the offset of each coefficient that is possible to mo-
dify is changed according to the value of the bit of the secret message, as showed in Table 1.
To extract the secret message the embedding process must be repeated to determinate the coefficients that were modified. The analysis of each offsetallows the re- construction of the secret message.
4. Results
4.1. Performance Parameters
Table 1. Offset of each coefficient that is changed.
Even Odd
0 No change Decrease
1 Increase No change
ue three parameters are used:
ing efficiency.
4.1.1. Embedding Capacity
[7,10] indicates the maxi- q
Embedding capacity; PSNR;
Embedd
The embedding capacity (EC)
mum data size that it is possible to hide in the cover ob- ject. It is defined as follows:
secret message size EC
cover object size
(10)
4.1.2. PSNR
ise Ratio [10] provides the similarity be- The Peak to No
tween the cover object, the original file, and the stego object, the file where the secret message has been hidden. It is defined through the Mean Square Error (MSE):
To analyze the performance of a steganographic techni-
0 0
MSE , i ,
i j
2 1 1
2
1 M N
I i j I i j M N
(11)
2 10
255 PSNR 10 log
MSE
(12)
4.1.3. Embedding Efficiency
ency (EE) [2,12] it is indi- Through the Embedding Effici
cated the average number of bits inserted for each change. It is defined as follows:
secret message size EE
number of changes
(13)
4.2. Peak Shaped Based for MP3 Performance
ry
4.2.1. JPEG Performance
d efficiency for the Model
NR is evaluated for the PSB algorithm for the JP
To evaluate the PSB for MP3 performance it is necessa to compare the Efficiency, the Capacity and the PSNR with different kinds of steganographyc algorithms and with the original PSB, that it was implemented for the JPEG format.
The embedding capacity an
Based Steganography for the JPEG format are shown in Table 2.
The PS
[image:4.595.308.536.101.155.2] [image:4.595.60.288.280.544.2]Boat 41,192 5185 12.59% 2.94
Bridge
Mandrill 78,316
55,689 7022 12.61% 2.07
Goldhill 48,169 6607 13.72% 2.11
Lena 37,678 4707 12.49% 2.16
10,902 13.92% 2.07
Table 3. PSNR for the JPEG-PSB algorithm [6].
PSNR Min Mean Max
MB1 34.2 dB 40 dB 43.6 dB
MB2 35.2 dB 39.9 dB 44.3 dB
PSB 34.2 dB 40.4 dB 46.6 dB
haped Steganography used for the JPEG format.
4.2.2. PSB for MP3
ng Capacity for the MP3-PSB S
To calculate the Embeddi
steganography it is necessary to calculate the file size as follows:
bitr sampli
L ate
ng frequency
M
(14)
A new variable is defined an s called Ls that is the
se
d it i cret message length. Then the Capacity is:
100
L
C s
L
(15)
and the results are shown in Table 4.
d in Equation (11) an
yzing the number of
4.2.3. MP3 Steganography Comparison
acity are illu-
4.3. Steganalysys
s [9] it is possible to have a better The PSNR is evaluated as describe
d the results are showed in Table 5. The Efficiency is calculated by anal
changes to insert the secret message in the cover ob- ject. It is possible to see the performance in Table 6.
In Tables 7 and 8 the PSNR and the Cap
strated for different kinds of steganographyc algorithms for MP3 format.
With the steganalysi
analysis of the PSB-MP3 performance. This method calculated two probabilities, the False Alarm probability, when a cover object is classified as stego, and the Missed Detection probability, when a stego object is classified as cover. The first one is indicated with the symbol Pfa
Table 5. PSNR for PSB-MP3.
PSNR Min Mean Max
PSB-MP3 55.67 dB 58.21 dB 62.90B
Table 6. Efficiency for the PSB-MP3.
Efficiency Min Mean Max
PSB-MP3 1.9969 1.9995 .00122
Table 7. Capacity for different algorithm.
Steganographyc Technique Embedding Capacity
Peak Shaped for MP3 12.75%
Generic LSB 34%
Tone Insertion 0.
S
006%
Phase Coding 0.02%
pread Spectrum 0.003%
Echo Data Hiding 0.012%
SVD 0.08%
VAS 10%
Table 8. PSNR for different algorithms. Steganographyc Technique PSNR
Peak shaped for MP3 58.21 dB
Phase Coding 69.5 dB
Spread Spectrum 44 dB
SVD 41 dB
nd the second one with the symbol Pmd. The values of old
a
these probabilities depend on a thresh , called , that modify the steganalysis system accuracy.
With these probabilities it is possible to calculate other parameters, like the detection probability, Pdet 1 Pmd,
and the error probability Perr:
err fa md
P P P
2 (16)
4.3.1. Chi-Square Test
that is possible to use for the 1
A steganalytic technique
Chi-Square test are compared with the threshold.
One method to calculated the chi-square test is the Zh
0 2 2 1
0 i 0 i
i i
ang-Ping attack [13] that evaluates two variables:
f
h
h
(17)
2 1 0
i i
i
1 2
0 i
f h h
(18)
and if 1 0 it will calculate the chi-square values:
f f
20 1 2
0 1
chi f f
f f
(19)
to compare with the threshold.
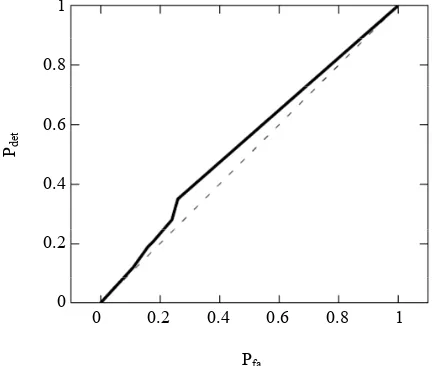
4.3.2. ROC Curve
luate the PSB performances is done
s it is possible to graph the R
rves (solid lin
This analysis to eva
on a random set of MP3 files. With the comparison with the threshold and the Chi-Square value it is possible to calculate the two probabilities of false alarm and missed detection, shown in Table 9.
With these two probabilitie
OC curve. This curve indicates the efficiency of the steganalytic method. If the curve is near the first quad- rant bisector the steganographyc algorithm is very strong, otherwise the steganalytic method is efficient.
In Figure 7 it is possible to see the ROC cu
e) of the PSB algorithm for the MP3. This curve is very smash on the first quadrant bisector (dashed line). This indicates that the steganographyc method is very robust when this steganalytic algorithm is used. When the ROC curve is far from the bisector the stegano- graphic algorithm isn’t very robust or else the stegana- lytic technique is very efficacious. Instead when this curve is very close to the bisector the technique is very secure, since there is perfect security when the ROC curve is exactly equal to the bisector.
1
0.8
0.6
0.4
0.2
0
Pdet
0 0.2 0.4 0.6 0.8 1
[image:6.595.308.537.111.217.2]Pfa
Figure 7. ROC curve for the PSB-MP3.
Table 9. F ob-
Tau Pfa Pmd Pd = 1 − Pmd alse alarm, missed detection and detection pr abilities when the threshold takes different values.
0.01 0.26 0.65 0.35
0.1 0.24 0.72 0.28
0.5 0.18 0.79 0.21
1 0.16 0.81 0.19
10 0.11 0.88 0.12
. Conclusions
ic algorithm for the MP3 format has
igh ca- pa
imulated to evaluate th
algorithm implemented, as assu- m
[1] G. Kipper, “In eganography,” Au-
5
A new steganograph
been developed by changing, in the Peak Shaped Based for the JPEG, the discrepancy equation, adapting it to vectors and studying the statistical distribution of the MDCT coefficients. The analysis of the performance of this algorithm showed that this method does not intro- duce audible distortion when the signal audio is repro- duced. Further, this method does not create relevant statistical differences in the samples distribution.
The Peak Shaped Based for the MP3 has an h
city compared to the other algorithms and a good PSNR. In fact the mean Embedding Capacity is equal to 12.75%, higher than the most relevant techniques used for MP3 steganography; the PSNR is equal to 58.21 dB, higher than the PSB for the JPEG.
A steganalytic attack has been s
e robustness of the algorithm. This attack is implement- ed on the Zhang Ping analysis and on the Chi-Square test. This attack has been adapted to the PSB-MP3 since it was created for the JSteg steganography. By calculating the false alarm probability and the missed detection pro- bability it is possible to draw the ROC curve. The ana- lysis of this curve shows that this attack is not suitable for this steganographic method because the ROC is crushed on the bisector. The error probability, calcu- lated with the ROC curve, tends to 0.5 when the thre- shold increases; when it takes this values the choice is completely random.
The steganographyc
ed, is resistant to the statistical attacks.
REFERENCES
vestigator’s Guide to St erbach Publications, Boca Raton, 2003. doi:10.1201/9780203504765[2] P. Sallee, “Model-based Steganography,” Springer Ver-
er and V. Atti, “Audio Signal Process lang, Berlin, 2004.
[3] A. Spanias, T. Paint
[image:6.595.66.285.532.715.2][6] L. Rossi, F. Garzia and R. Cusani, “Peak-Shaped-Based Steganographic Technique for JPEG Images,” EURASIP Journal on Information Security, 2009, Article ID: 382310.
doi:10.1155/2009/382310
[7] R. Yu, X. Lin, S. Rahardja and C. C. Ko, “A St
lippi and H. He,
atistic [12] K. Lee, A. Westfeld and S. Lee, “Category Attack for LSB Steganalysis of JPEG Images,” Springer Verlang, Berlin, 2006.
Study of the MDCT Coefficient Distribution for Audio,” IEEE International Conference on Multimedia and Expo, Taipei, 30-30 June 2004, pp. 1483-1486.
[8] D. Liu, H. Zhang, M. Polycaropou, C. A
“Advances in Neural Networks,” Springer Verlag, Berlin, 2011.
Journal of Engineering Science and Technology, Vol. 2, No. 8, 2010, pp. 3561-3570.
[11] A. Westfeld, “F5-A Steganographic Algorithm,” Springer Verlang, Berlin, 2001.
![Figure 5. Statistical distribution of the MP3 coefficients approximated with the GG [7]](https://thumb-us.123doks.com/thumbv2/123dok_us/1576062.703794/4.595.60.288.280.544/figure-statistical-distribution-mp-coefficients-approximated-gg.webp)