Munich Personal RePEc Archive
War of the Words: How Elites’
Communication Changes the Economy
Baerg, Nicole Rae
University of Mannheim
April 2014
War of the Words
How Elites’ Communication Changes the Economy
∗
Nicole Rae Baerg,
Department of Political Science
University of Mannheim
April 12, 2014
Abstract
How does variation in the clarity of elites’ communication change the economy? Previous re-search shows that elites’ communication changes the economy, but not all messages are crafted equally. Models of strategic communication suggests that clearer and precise information can improve the economy more than ambiguous messages. In order to test this claim, I develop a new dataset of political elites’ inflation statements and measure each statements’ information precision. I then test whether or not economic performance depends on how precisely politi-cal elites communicate. I find evidence that an increase in information precision, through its attenuating effects on inflation expectations, lowers inflation. Furthermore, I find that this is true when examining a number of developing countries over a relatively volatile time period.
∗The author thanks Mark Hallerberg, Drew Linzer, Eric Reinhardt, and Jeff Staton for helpful comments and
1
Introduction
People who make economic policy, such as central bankers, also make speeches, and the things that
they say moves markets. A growing literature in economics and political science examines how
the things that central bankers or governments say shapes consumer and producer expectations
and behavior (Bailey and Schonhardt-Bailey, 2008; Blinder et al., 2008; Ehrmann and Fratzscher,
2007; Guisinger and Singer, 2010; Meade and Sheets, 2005; Rosa and Verga, 2007; Sibert, 2009).
For example, Guisinger and Singer (2010) find that in the case of exchange rate regimes,
gov-ernments that credibly announce their economic policies are more likely to have better economic
fundamentals. Unfortunately, however, most of these theories ignore the fact that some messages
are more precise whereas other messages are more vague. Game theoretic models of
communi-cation argue that credible communicommuni-cation is both truthful and clear. If elites’ speeches matter for
the economy then variation in the presentation of information, whether it is clear of vague, should
covary with changes in the economy. One important implication is that by disseminating
informa-tion more clearly, central bankers, or other economic experts, can improve monetary performance
by providing more precise and believable information about inflation to the public.
If precise statements can better guide the economy then clear communication offers large
bene-fits. These potential benefits are not lost on policymakers. In the summer of 2012, for example, the
Federal Open Market Committee (FOMC) publicly stated that future interest rates will remain low
until “Mid 2015.” A more precise statement is where the FOMC declares an actual policy target.
Interestingly, the FOMC declared not just one buttwotargets in December 2012, providing more
clear information to the public. By declaring a 6.5 percent unemployment target and a 2.5 percent
inflation target, households could better understand the goals and objectives of future policy. The
new Federal Reserve Bank Chair Janet Yellen has stated that clear communication is important
for reducing market volatility and is important for the Fed. The adoption of a numerical target is
generally considered more transparent. For example, in January 2013 the Bank of Japan adopted a
two precent inflation target, replacing its earlierprice stability in the medium to short rungoal in
Clear information can change the economy in a number of important ways. First, clear
under-standing of future policymaking can help the public adjust their short term inflation expectations.
Because short term inflation rates influence both short term and long term interest rates, this can
change the economy. Second, clear public understanding can decrease the level of uncertainty in
the economy, leading to better contracts and less volatility in the economy. This implies that labor
contracts, interest rates and asset prices, as well as other purchases are likely to be more efficient.
Empirical research examining whether or not variation in information precision covaries with
changes in economic performance remains under explored, however. One reason is that we lack a
measure of information precision– message vagueness or message clarity. In order to test whether
or not clarity helps improve the economy, I construct a dataset that includes political elite
state-ments about inflation made in the news in a group of Latin American countries between 1993 and
2010. Testing whether or not changes in information precision alters expectations, I find evidence
that an increase in information precision (or the inverse, a decline in ambiguity) is systematically
associated with lower inflation. The main finding of the paper is that cheap talk is effective in
lowering inflation, so long as the message is clear.
In the next section, I apply the logic of cheap talk models to political communication by
cen-tral bankers and other economic policy experts about the economy. Section three introduces the
measurement challenges and the strategy that I pursue. The fourth section presents the statistical
analysis, considers alternative explanations, and shows how the model fits to the data. The final
section concludes.
2
Political Competition and Signaling
In signaling models, a message sender,S wants to inform a message receiver,R, about something
that he knows but that R does not know. This means thatS has private information and thatR
would be better off knowing this information. S is not benevolent, however. In revealing S′s
knows that the message sender is self-interested,Ris skeptical aboutS′smessage. This skepticism
means that only under some conditions willR incorporate information from S into her actions.1
The key question is how much ofS′sprivate information canS credibly reveal?
Cheap talk models are a subclass of signaling models. One influential cheap talk model is
by Crawford and Sobel (1982). Crawford and Sobel’s model is a single sender-receiver model,
meaning that there is a single sender of information and a single receiver. Crawford and Sobel
find that the precision of information sent by S to R depends on how far apart R and S′s ex
antepreferences are from one another. When the sender and the receiver are alike– have similar
preferences–Scan send more precise statements without triggeringR’s skepticism. Alternatively,
when the sender and the receiver want different things– have dissimilar preferences– it is harder for
Sto reveal his information truthfully. As a result, differences in the quality of credible information
flows depends on differences in the preferences ofRandS.
Intuitively, the reason why precise information is transmitted whenRandSare alike is because
the receiver is less skeptical that the sender will say something not in the receiver’s self-interest.
As they want different things, however, the receiver’s skepticism grows. Because it is a strategic
model, the sender anticipates the household’s skepticism, and adjuststhe clarityof his message to
counter the receiver’s expected behavior. In order to have any influence at all, S communicates
his private information with more or less strategic ambiguity, taking into accountR′slikely action.
In equilibrium, S crafts a messages which depends on the difference between his own ex ante
preferences andR′sex antepreferences. One testable prediction from the model is that information
precision varies as a function of the differences between the sender’s and the receiver’s preferences.
Modeling advances in economics and political science extend the single sender cheap talk
framework to make a number of innovations such as including multiple senders (Austen-Smith
and Wright, 1992; Gilligan and Krehbiel, 1989; Krishna and Morgan, 2001; Minozzi, 2011). In
these theories, instead ofS, more than one sender,AandB, make pronouncements. Like the single
sender model,A andB want to influenceR′sactions. In Krishna and Morgan’s model, AandB
1
have some private information and knownex antepreferences. The message receiver knows theex
antepreferences of the senders but she does not know the message senders’ private information,
which is common knowledge between the senders. The result of the strategic interaction between
A, B, and R is that Aand B both strategically craft proclamations to send to the receiver. Like
the single sender model above, in equilibrium, the precision of information sent by the senders
depends on distance between each sender andR. In addition, in a multi-sender model, information
precision now also depends on the distance between A andB, relative to R. In summary, these
models depict a political process where elites compete for the hearts and minds of households
using strategic speech and the output of this political process is variation in precision of credible
information2.
The benefit of using cheap talk models to depict information exchange is their generalizability.
In Crawford and Sobel’s as well as in Krishna and Morgan’s model, information precision refers
to the number partitions in a generic, unidimensional state space, where the greater the number
of partitions n, the more precisely information is revealed in equilibrium. In other words, the
greater the size ofn, the more precisely elites reveal information. In applying this class of models
to elite communication about the economy, equilibria no longer refers to partitions on a generic
number line, but instead, represents the precision of political elites’ public proclamations about
the economy. Senders are political elites, or actors engaged in economic policymaking, who have
different underlying inflation preferences. The receiver is a less informed household who benefits
from learning elites’ information. Finally, information revelation refers to how ambiguously or
clearly elites reveal their private information to the public.
Applying this strategic framework to monetary policy in this way suggests that in the first stage,
two economic policymakers negotiate how to send a message about the economy. If both
policy-makers coordinate their speech, then the benefit is that policypolicy-makers provide better information,
and household and market expectations are anchored. Monetary anchoring will be reflected in
inflation expectations of the household. If an agreement is not reached in the first stage, however,
2
household and market expectations may become unhinged. If this is true, then the first player never
has an incentive to say something that it knows the second player will refute. This means that in
equilibrium, strategic speechmaking generates consensual statements about inflation, even when
policymakers hold differences in opinions and preferences (THIS AUTHOR).
For example, if the household is totally unsure of the world and political elites provide no
information then assuming that the true state of the world lies somewhere with uniform probability
between∈ [0,1], the household’s best guess is 1
2[0,1]. Information is clearer when elites reveal,
with greater precision, a narrower interval. By doing so, elites’ communication coordinates the
public’s beliefs, anchoring them to a more precise focal point such as between ∈ [0.25,0.55].
What we are interested in in this paper is whether or not a shift from∈ [0,1]to∈ [0.25,0.55] in
communication attenuates inflation expectations and lowers inflation.
In summary, political elites try to change the economy by making public statements. Not all
statements are the same, however. The more precisely elites’ communicate, the more
informa-tion households have. The more true knowledge that households learn, the more efficient their
economic decisions. One way that an improvement in information can change their beliefs is by
changing their inflation expectations. Because expected inflation matters for actual inflation, the
more accurate households’ inflation expectations, the less likely countries will experience
infla-tion persistence and inflainfla-tion traps (Sargent and Wallace, 1982; Sargent, Williams and Zha, 2009;
Treisman, 2000).
Applying a multiple sender cheap talk model to the study of communication and message
clar-ity generates a number of important and empirically verifiable claims. One testable implication is
that is that an increase in transparency will lead to better economic outcomes. The main proposition
that I test in this paper is that,
H1 CLARITY: An increase in more accurate economic information about monetary
condi-tions will reduce inflation expectacondi-tions and lower inflation. Alternatively, an increase in more
ambiguous economic information about monetary conditions raises inflation expectations and
In addition to policymakers’ speech, institutions provide information by establishing rules and
credibility. In fact, good institutions should provide better information than cheap talk because
enacting and maintaining good institutions is costly. In a world where there are costly signals,
the inclusion of political elites’ cheap talk, whether their messages are precise or vague, should
not help to explain inflation. If independent central banks, budget targets, and credible exchange
rate regimes convey all the information that households need to formulate their expectations, then
additional words by political elites should have no independent effect at all.
Alternatively, if communication by diverse and multiple political elites matters and specifically
the precision of their speech matters, then we should see that information precision matters
inde-pendently of the institutional environment. In other words, if cheap talk helps to explain inflation,
then this means that we should observe greater degrees of information precision lowering
infla-tion, even when we account for costly signals such as better exchange rate regimes, more balanced
budgets, and independent central banks.
Therefore, a corollary hypothesis is that both costly signals and cheap talk messages can
pro-vide accurate information about the economy. As a result, the second hypothesis that I test is:
H2 CREDIBILITY:An increase in more accurate economic information about monetary
con-ditions, even if it is cheap, will reduce inflation expectations and lower inflation
3
Empirical Analysis
The main dependent variable is changes in monthly, year over year consumer price inflation, πt.
I predict changes in monthly, year over year inflation by regressing last period’s average inflation
expectations, πe
t−1 conditional on information the household receives from political elites today,
It. This means that the variable of interest isπte−1∗It. If the costly-signaling hypothesis is correct,
then messages should exert no independent effect on inflation expectations once we account for last
costly signals. 3 I measure households’ average inflation expectations using average forecasted
inflation. I explain this in greater detail below. The level of elites’ information precision is a latent
variable. The measurement strategy that I use to construct this variable is also given in greater
detail below.
4
The Data
The panel that I use to test the hypothesis consists of six countries from Latin America (Argentina,
Brazil, Colombia, Mexico, Peru, and Venezuela). The time period examined, in monthly intervals,
is 1993 to 2010. Despite the fact that there are only six countries in the sample and seventeen
years, across these six countries and seventeen years, there is enormous variation in the countries’
inflation experiences. The variety of experiences offers an excellent test of the theory. Consider
some historical examples: In 1991, Argentina enacted the “Convertibility Program.” This program
attempted to improve the country’s macroeconomic policy credibility and to establish inflation
sta-bility. The initial success of Argentina’s fixed exchange rate regime brought Argentinian inflation
down to annual rates as low as negative one percent in 1999, or deflation. In 2002, however,
Ar-gentinian inflation rose again to rates over 25 percent. During the same period, other Latin
Amer-ican countries, including Mexico and Brazil, faced economic crises of their own. Mexico faced
double-digit inflation, averaging approximately 20 percent over the 1990s, whereas Brazil, despite
starting the 1990s, with a major bout of hyperinflation, managed to keep inflation under 10 percent
throughout much of the 2000s. Venezuela’s economy was less volatile but similarly plagued with
inflationary problems. Inflation was as high as 100 percent in 1996, and never fell below
double-digits over the decade. Finally, Brazil reported the maximum inflation level in the region in 1993,
with annual inflation reported at over 2000 percent. Like earlier attempts to tame hyperinflation
in Argentina and in Israel, Brazil attempted to reform the macroeconomy by adopting the “Real
plan.” Brazil’s inflation rates declined from 45 percent during the second quarter of 1994, to less
3I also run an alternative model that specifics the first difference of the dependent variable,π
t−πt−1on the LHS.
than one percent in 1996. Importantly, in addition to their diverse experiences, these countries also
have significant similarities. Some of the similarities include regional affiliation which might be
important to investors and therefore impact inflation, common external shocks such as changes in
world or US interest rates which may transmit inflationary or deflationary shocks, and political
institutions such as mixed presidential systems, large parties or neoliberal reform agendas. By
re-stricting our sample to this set of countries, we can discount possible alternative explanations and
meanwhile uncover some of the factors that help to explain across country and over time variation.
4.1
Inflation
The main outcome variable is monthly, year over year inflation. Inflation refers to the rate at which
the level of prices for goods and/or services are accelerating in the economy. The measure that I use
is a weighted basket of goods and services purchased by households, or the consumer price index
(CPI). I use a country’s monthly report of year over year consumer prices. This data is distributed
to the International Labour Organization from national statistical offices and is disseminated by
Federal Reserve Bank of Cleveland. 4
4.2
Inflation Expectations
In order to measure the representative household’s inflation expectations, I use averaged
profes-sional forecast data of the current year’s annual inflation. The profesprofes-sional forecast data is from
Consensus Economics and is proprietary data. Consensus Economics is a for-profit organization
that polls industry and academic forecasters each month to get their views on expected values of
key macroeconomic indicators. The actual series that I use is the current year forecasted change
in consumer prices. Coverage starts in 1993 and ends in 2010. The number of forecasters polled
in a given month varies, ranging from seven forecasters to twenty-three forecasters, for a total of
13,829 forecasts. While the frequency of the forecast data is monthly, each month, the forecaster
forecasts the current year’s annual inflation rate. In order to calculate the average household’s
flation expectations, I take a monthly average of all the forecasters’ forecasts for a given country
month, and use this as a proxy for the publics’ expectations of current year’s inflation.
A potential problem with using experts’ expected inflation to measure households’ expected
inflation is that the average forecaster may have similar private information as political elites. If
the forecaster is privy to the same expert information as political elites, there may be stronger
association between pronouncements by political elites and forecaster inflation expectations
be-cause of shared knowledge and not bebe-cause of information transmission from elites to households.
Unfortunately, to my knowledge, a dataset measuring actual household survey of inflation
expec-tations for this sample of countries over time is not available. Fortunately, however, recent work
from the Bundesbank comparing German household inflation expectations and professional survey
forecasts suggests that the two series have significant overlap. Menz and Poppitz (2013) find that
forecaster inflation expectations matches households’ inflation expectations in Germany well, and
that this is particularly true for higher income, higher educated males that watch the news. People
who receive elites communication in the news media, therefore, are more likely to have inflation
forecasts that mirror professional forecasters. While using professional forecasters’ expectations
to proxy the inflation beliefs of households is not exact, there is a strong positive relationship
be-tween professional forecast and household forecasts and this relationship is particularly strong for
the better educated and employed.
A second problem relates to the timing of the inflation series and the expectations series. On
the one hand, inflation is a measurement of monthly changes in year over year inflation whereas
the forecast variables are monthly projections of the current year’s inflation. While the inflation
series and the expectations series are not strictly the same, the persistent nature of inflation allows
for comparison across the series.
4.3
Information Precision
Observable to the household are elites’ public statements about the economy. My theoretical model
signals about the economy. Furthermore, inter-elite strategies constrain or enhance the precision
of information disseminated to the public. As a result, in order to test the hypotheses listed above,
we need a measure of the information precision in elites’ statements made in the news media.
In order to measure the precision of information in inflation pronouncements, and following
from the methodology presented in Ehrmann and Fratzscher (2010), I construct a new dataset of
all public inflation statements by political elites using Factiva, a news source database. Factiva
contains newspaper articles and newswire reports from 14,000 news sources. Using this dataset,
I extract all database entires containing the words “minister and central bank and inflation and
“country name”” from the popular newswire, “Reuters News.”
The number of newspaper articles returned by Factiva for a given country and a given year is
very large. For instance, running the search of “minister and inflation and Argentina and central
bank” generates over 1000 newspaper articles between January 1, 1993 and December 31, 1993
alone. Doing such a search on the entire sample yields over 9,000 newspaper articles for the six
Latin American countries in my dataset. With over 9,000 hits, human coding of each document is
impossible. In addition to the laboriousness, the use of humans to hand code each newspaper article
introduces the potential for measurement error which may then cause problems of reliability and
validity. In fact, recent scholarship by Mikhaylov, Laver and Benoit (2012) find that human coding
of the Comparative Manifestos Project yields misclassification in serious and systemic ways.
Instead of using human coding, I depend on machine learning techniques to retrieve, parse,
fil-ter, and classify the newspaper articles. This allows me to get measurement of my key independent
variable, “information precision,” that is consistent across newspaper sources, countries, and
over-time. Furthermore, recent work by Klebanov, Diermeier and Beigman (2008) and Quinn et al.
(2009) demonstrate ways that machine learning can be applied to political textual analysis that
yields more reliable (less biased) and consistent estimates despite a less nuanced comprehension
of textual language than human coders might achieve.
Like other research that relies on machine classification of textual data, there are a number of
result of the English search, it is likely that not all statements about inflation are reported.
An-other potential problem with the English search criteria is that the reported pronouncements may
be those of interest to foreigners. This is a potential problem because I am interested in the
do-mestic audience. Nevertheless, while it is very likely that dodo-mestic political elites have more than
one audience, given that Factiva contains the newswire reports from local offices, I am confident
that the statements collected contain a wide sample of all statements made and include statements
of relevance to domestic households. One important indicator of the relevancy of the search to
domestic households is that the local news media is discussed. For example, one Reuters
news-paper article states, “The dailyLa Nacion, quoting Economy Ministry sources, said Peronists and
Radicals had agreed to pass a compulsory contribution law for those companies which do not
buy solidarity bonds.” This example and others suggests that Reuters newswire articles captures
domestic political elites’ statements reported in the local Spanish-language media.
Second, by using the terms “minister” and “central bank” in the initial search criteria, the
search selection may over-select statements from incumbents and under-select statements from
opposition members. The search may also not include statements from political elites such as
labor union leaders, political opponents, or prominent academics which are included in my
defi-nition of political elites. One important indicator that statements from oppositional members are
included is that some articles report counter-claims. For example, one newspaper article states,
“The [Colombian] government, however, points to the lowest inflation in almost 30 years - 9.98
percent over the last 12 months - as a sign of good housekeeping. Critics say the inflation record is
unsurprising given the scale of the economic slump.” This example and others like it suggests that
the search captures statements made by political elites outside of the government.
4.3.1 Unsupervised Learning
Using text as data to generate a measure of information precision requires two steps - treating text
as data and data coding. The first step is conceptualizing each newspaper article as unstructured
newspa-per articles in such a way that the private information can be categorized and coded. Through
categorization and coding, it is possible to extract a measurement of the variable, “information
precision.”
Automated content analysis follows a logic very similar to traditional content analysis in
qual-itative analysis (Laver, Benoit and Gerry, 2003). First the data is unitized. The researcher decides
the unit of analysis, whether the unit be words, tokens, sentences, statements, or quotes. Second,
the units are assigned a metric. Typical metrics include word frequencies or word counts,
mea-sures of semantic relationship between words, a measure of how closely related the words are, and
finally, measures of word distance in text (Manning and Schutze, 1999).
For the newspaper articles, I determine that the unit of analysis I am most interested in is token
frequency. Tokens are textual data that have been pre-processed to remove whitespace, grammar,
punctuation, and stopwords that have little conceptual information but are necessary for sentence
comprehension such as “and, if, but, how, then.” Once the sentence is tokenized and the stopwords
are removed, the article’s content is transformed into word tokens. For example, the statement,
“Minister Calvo says that inflation will be lower next January” is transformed using the above
process into distinct tokens: “Minister” “Calvo” “says” “inflation” “lower” “next” “January.”
Once the data is processed into a token frequency table, the next step is filtering. The objective
of filtering is to make sure that the articles extracted are relevant. While the initial search criteria,
“minister and central bank and inflation and “country name”” pre-processes some of the data,
upon examination of the newspaper articles, there are many newspaper articles that are not relevant
inflation pronouncements. Again, because the number of newspaper articles is very large, I turn to
machine learning techniques to filter the documents into “pertinent” and “non-pertinent” inflation
announcements. I apply a K-means clustering algorithm to the tokenized frequency table, which I
4.3.2 Filtering Pertinent and Non-pertinent Inflation Announcements using Clustering
K-means clustering is an iterative clustering algorithm that takes input data and assigns the data to
knumber of groups based on how well the data fits to a specified cluster. For example, if there are
k = 2groups, then the K-means algorithm will first randomly choose two means; second, it will
assign all the input data closest to that particular mean, that mean’s label; third, it will determine
if the algorithm can do a better job fitting the data, and if so, choose another mean. The algorithm
iterates through this process until the best fit is found. It then assigns all data points belonging to
that mean a label (Hastie, Tibsgurani and Friedman, 2003).
Used as a filter, K-means clustering classifies the articles into two groups, “pertinent” and
“non-pertinent” inflation announcements. “Pertinent” newspaper articles are relevant inflation
state-ments and “non-pertinent” newspaper articles are business journals, weekly reports, or numerical
market data reports. I then discard those articles that the classifier identifies as “non-pertinent.”
Running the filter removes approximately one-third of the newspaper articles. Those articles
re-maining after filtering are assumed to be relevant inflation statements.
In examining the removed newspaper articles with a random sample of hand coded articles, the
K-means clustering algorithm successfully identifies “non-pertinent” in my hand-coded sample;
in all cases, the newspaper articles that I remove would be hand-coded as “non-pertinent.” While
I can be relatively sure that the number of “false negatives” is small by surveying the discarded
articles, more difficult to determine is the number of “false positives.” So long as any remaining
articles are similar to the token frequencies in the “pertinent” category, while “false positives” will
increase the noise of the measure, they should not introduce bias. Furthermore, while the K-means
classifier is simple, work by Hand (2006) shows that when compared against more complicated
classification strategies, simpler classifications tend to outperform more complex models and do
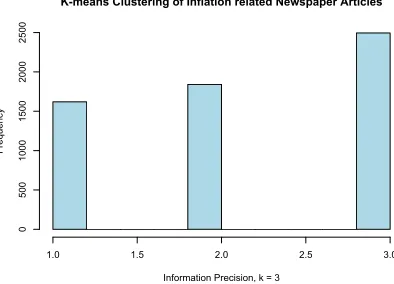
4.3.3 Measuring Information Precision using Clustering
Having discarded the non-relevant statements, I then classify the remaining articles into distinct
categories of ranked information precision. I run another clustering model and setk = 3, the same
number of information types that I would classify if I were hand coding the data. Because the
method is unsupervised, I make only the assumption that that there are three groupings and that
these groupings should be distinguishable due to differences in token frequencies. Like above, the
classifier assigns the newspaper articles into three groups based on the best fit of the means. Figure
1 shows the assignment of each individual newspaper article based on an article’s token frequency
count.
[Figure 1 around here]
[Figure 2 around here]
Finally, from the remaining classified articles, I construct a measure of the proportion of
in-formative news articles for a given country-month. I create a dummy variable for each classified
newspaper article and aggregate the total number of counts for each information type by
country-month. Finally, I calculate the total proportion of “precise” articles divided by the sum of the total
number of articles for a given month. If my theory is correct, then what matters is not the exact
content of any particular news article, but instead the overall precision of information in the
in-formation environment. In doing so, I control for the fact that while a household may not read a
particular article, people are exposed to news about the economy. Figure 2 shows the distribution
of the information environment by country-month.
5
Results
This section presents the statistical analysis using the data and the estimation model in equation
(1). Inflation in the current period is determined by last period’s inflation expectations conditional
parameter estimates,Z is a matrix that includes our variables of interest and control variables. β1
includes last month’s inflation rate to account for the fact that inflation is a highly autoregressive.
I also include country, ηi and month τt fixed effects to account for spatial and temporal features
of the data, like institutions, that are otherwise unspecified in the model. Finally, the inclusion of
annual output, as measured by per capita income, also effectively includes a year fixed-effect term
in some models. To account for costly signals, I include the number of changes to economic policy
reported to the IMF.
πi,t =α0+β1πt−1+β2Zt+ηi+τt+ǫi,t (1)
I run this model using standard OLS panel regression techniques and report the findings in
Table 3. Table 3 shows that, when information precision is zero, inflation expectations have a
pos-itive and significant relationship with inflation. The estimated relationship is 0.9 in the panel with
missing data and 0.7 when I account for missing data. I estimate the missing data (approximately
50 percent of the data is missing) two ways, first using multiple imputation using the software
Amelia and second, predicting missing values using last period’s inflation rate. I do not interpret
the coefficient on information precision independent of the interaction term as it specifies the effect
of information precision on inflation expectations when expected inflation is zero, which is a value
not of theoretical importance.
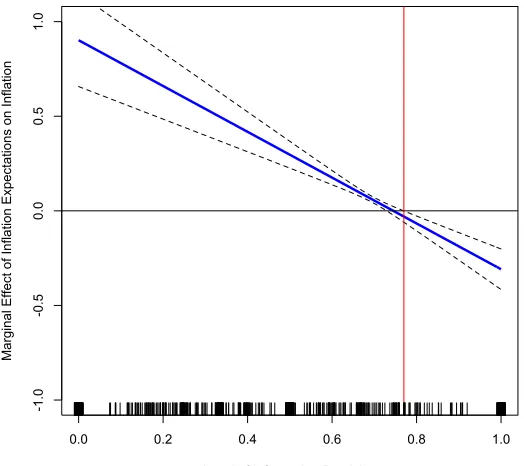
Figure 3 shows the marginal effects plot. At different levels of information precision, inflation
expectations attenuate, contributing to lower predicted inflation.
[Figure 3 around here]
For all ranges of the information variable greater than 0, an increase in information precision
atten-uates predicted inflation by lowering inflation expectations. What this means is that as information
precision increases, the effects of clear and credible information reduces the influence of inflation
expectations in the previous period. This provides some evidence that an increase in information
high levels of precision, or values over 0.8, the coefficient on inflation expectations is negative.
What this means is that at very high levels of information precision, inflation expectations
nega-tively contribute to inflation. This suggests that when information precision is really high or greater
than (0.8), “clear” information not only attenuates the household’s last period inflation expectations
but actually but may actually cause a reduction in inflation expectations and lower inflation.
This finding provides some evidence for the claim that elites’ statements, if they are clear, can
steer the economy. While even ambiguous information seems to attenuate inflation expectations,
clear information reduces expectations much more than ambiguous information.
In addition to the country fixed effects, the monthly fixed effects, and the lagged dependent
variable, for robustness, I also include annual per capita output as measured by GDP normalized
to 2005 prices.5
We know that countries with better institutions, more credible exchange rates, and better trained
policymakers are also countries with higher income. Furthermore, we also know that the higher
educated are more likely to have better congruence in their expectations with forecasters. By
including this data, I aim to control for these factors. When I include per capita output into the
model, however, I find no significant differences in the results. I present these findings and the
findings from other robustness checks in Table 4.
In order to test hypothesis 2, or whether cheap talk and costly signals matters for inflation
expectations, I include a measure of announced policy changes to the economy as reported in
the International Monetary Fund’s Exchange Commitments and Exchange Restrictions, Annual
Reports. The IMF classifies policy changes according to topics including changes to the exchange
rate regime, imports, exports, invisibles, capital, gold, non-resident accounts, and changes to the
payments system. It is therefore a good record of overall economic policy changes. I count a policy
“change” by topic as equal to “1” if there was a policy announcement reported by the IMF in a
specific quarter. If there was no announcement in a quarter, I enter “0”. For example, if Mexico
announced a change to its import restrictions with Argentina in Q1 1999, I code this as 1 import
5
announcement for Mexico. I do not include the Mexican announcement in Argentina’s tally as I
am interested in the relative frequency for which there is an announced policy change for a given
country, not bilateral changes. Because I have this change data at the quarterly frequency and the
data that I am using here is monthly, I interpolate the monthly number of policy changes from the
quarterly data using a cubic spline.
When I include this variable into the model, the coefficient for costly signals is both negative
and significant. As expected, this suggests that the greater the costly signals the lower inflation.
More important for the testing of hypothesis 2, however, is that the introduction of costly signals
does not change either the coefficient estimate or the significance level of the interaction term. The
value of the coefficient and the level of significance are robust to the inclusion of costly signals as
is the predicted relationship across the levels of information precision according to the marginal
effects plot.
Table 4 presents all of the findings in greater depth including each model specification. Model
1 shows the results from listwise deletion and including country and month fixed effects. Model 2
includes country fixed effects. Model 3 includes the control variable for per capita output which
is effectively a year fixed effect term. Model 4 includes the control variable for per capita output
and costly signals using the IMF change data. Model 5 corrects for missing data using multiple
imputation in Amelia.
Finally, I also check that the results from the model are not sensitive to specification of the
dependent variable or extreme values in the sample. I also run the model with a different measure
of the dependent variable πt−πt−1 and the results are similar. I also examine whether extreme
values, especially hyperinflation in Brazil in 1993 and 1994, matters. I discard all observations for
Brazil in 1993 and 1994 and rerun the analysis. Here I find results are similar to those presented in
Table 3 and Table 4. This suggests that the hyperinflation experiences of Brazil are not driving the
6
Conclusion
This paper offers a new perspective on how ambiguity and clarity in elites’ communication changes
the economy. Using text analysis, I develop a new measure of information precision from Reuters
News reports in Latin America. I show that there is significant variation in the precision of
in-formation contained in elites’ statements and that some announcements are clear whilst others are
ambiguous.
Using this new measure to predict inflation, I also show that an increase in the precision of
political elites’ statements lowers inflation, even when talk is cheap. Furthermore, the findings
are robust when I include controls for costly signals and output. Given that multiple elites make
proclamations, cheap talk models with multiple senders suggest that inter-elite politics generates
strategic speech. This paper shows that not all speech affects the economy equally; when elites’
communication is more precise, countries have lower levels of inflation expectations and lower
inflation.
Finally, researchers with an interest in measuring information precision and its inverse,
ambi-guity, might apply similar unstructured text analysis strategies as a way to generate new measures
useable for theory testing. For example, future research can use this text analysis strategy to
test whether a similar empirical relationship exists between information precision and support for
fiscal austerity or economic reforms more broadly. Assuming that political elites have an
infor-mational advantage and a strategic interest in influencing their audience, the paper contributes an
understanding of how and under what conditions political elites can use their words to steer the
References
Austen-Smith, David and John R. Wright. 1992. “Competitive Lobbying for a Legislator’s Vote.”
Social Choice and Welfare9:229–257.
Baerg, Nicole. 2013. The Political Economy of Conquering Inflation: Elite Consensus and Elite
Opposition and its Effects on Inflation Stabilization. Dissertation, Emory University, Laney
Graduate School.
Bailey, Andrew and Cheryl Schonhardt-Bailey. 2008. “Does Deliberation Matter in FOMC
Mon-etary Policymaking? The Volcker Revolution of 1979.”Political Analysis16(4):404–427.
Blinder, Alan, Michael Ehrmann, Marcel Marcel Fratzscher, Jakob De Haan and David Jansen.
2008. “Central Bank Communication and Monetary Policy: A Survey of Theory and Evidence.”
Journal of Economic Literaturepp. 910–945.
Crawford, Vincent P and Joel Sobel. 1982. “Strategic Information Transmission.”Econometrica
50(6):143–151.
Ehrmann, Michael and Marcel Fratzscher. 2007. “Explaining Monetary Policy in Press
Confer-ences.”International Journal of Central Banking.
Ehrmann, Michael and Marcel Fratzscher. 2010. “Politics and Monetary Policy.” The Review of
Economics and Statistics93(3):941–960.
Gilligan, Thomas W. and Keith Krehbiel. 1989. “Asymmetric Information and Legislative Rules
with a Heterogeneous.”American Journal of Political Science33(2):459–490.
Guisinger, Alexandra and David Singer. 2010. “Exchange Rate Proclamations and
Inflation-Fighting Credibility.”International Organization64:313–337.
Hand, David. 2006. “Classifier Technology and the Illusion of Progress.” Statistical Science
Hastie, Trevor, Robert Tibsgurani and Jerome Friedman. 2003.The elements of statistical learning:
Data Mining, Inference, and Prediction. New York: Springer Publications.
Klebanov, Beata, Daniel Diermeier and Eyal Beigman. 2008. “Lexical Cohesion Analysis of
Political Speech.”Political Analysis19(4):447–463.
Krishna, Vijay and John Morgan. 2001. “A Model Of Expertise.” The Quarterly Journal of
Eco-nomics116(2):747–775.
Laver, Michae, Kenneth Benoit and John Gerry. 2003. “Extracting Policy Positions from Political
Text Using Words as Data.”American Political Science Review97(2):311–331.
Manning, Christopher and Hinrich Schutze. 1999. Foundations of Statistical Natural Language
Processing. Cambridge: Cambridge University Press.
Meade, Ellen E. and D. Nathan Sheets. 2005. “Regional Influences on FOMC Voting Patterns.”
Journal of Money, Credit and Banking37:661–677.
Menz, Jan-Oliver and Philipp Poppitz. 2013. “Households disagreement on inflation expectations
and socioeconomic media exposure in Germany.”Discussion Paper: Deutsch Bundesbank(7).
Mikhaylov, Slava, Michael Laver and Kenneth Benoit. 2012. “Coder reliability and
misclassifica-tion in the human coding of party manifestos.”Political Analysis20(1):78 – 91.
Minozzi, William. 2011. “A Jamming Theory of Politics.”Journal of Politics73:301–315.
Quinn, Kevin, Burt L. Monroe, Michael Colaresi, Michael H. Crespin and Dragomir R. Radev.
2009. “How to Analyze Political Attention with Minimal Assumptions and Costs.”American
Journal of Political Science54(1):209–228.
Rosa, Carlo and Giovanni Verga. 2007. “On the Consistency and Effectiveness of Central Bank
Sargent, Thomas J and Neil Wallace. 1982. “The Real-Bills Doctrine versus the Quantity Theory:
A Reconsideration.”Journal of Political Economy90(6):1212–36.
Sargent, Thomas, Noah Williams and Tao Zha. 2009. “The Conquest of South American Inflation.”
Journal of Political Economy117(2):211–256.
Shirai, Sayuri. 2014. “Monetary easing and communication policy- a review based on several
surveys.” Speech by Member of the Policy Board of the Bank of Japan - Columbia University,
NYC.
Sibert, Anne. 2009. “Is Central Bank Transparency Desirable?”Journal of the European Economic
Association7(4):831–857.
Treisman, Daniel. 2000. “Decentralization and Inflation: Commitment, Collective Action, or
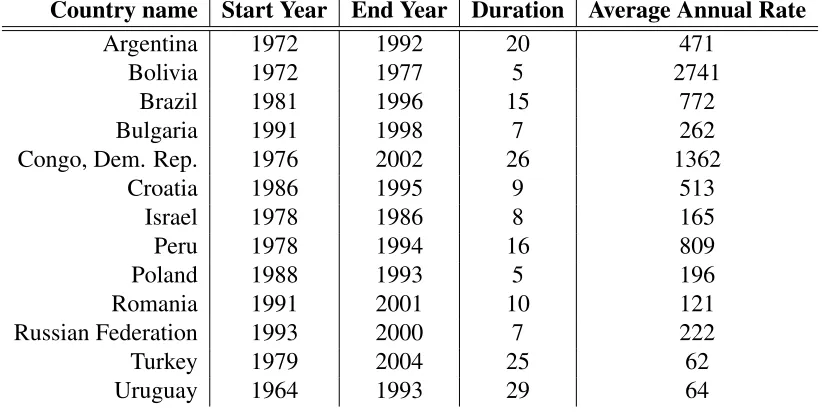
Table 1: Inflation episode length, average level, and variation for a selection of countries
Country name Start Year End Year Duration Average Annual Rate
Argentina 1972 1992 20 471
Bolivia 1972 1977 5 2741
Brazil 1981 1996 15 772
Bulgaria 1991 1998 7 262
Congo, Dem. Rep. 1976 2002 26 1362
Croatia 1986 1995 9 513
Israel 1978 1986 8 165
Peru 1978 1994 16 809
Poland 1988 1993 5 196
Romania 1991 2001 10 121
Russian Federation 1993 2000 7 222
Turkey 1979 2004 25 62
[image:24.612.101.512.133.341.2]Uruguay 1964 1993 29 64
Table 2: Variation in frequency of country experiences by inflation types (1960 to 2010)
Range of Annualized inflation Number of Countries
Hyperinflation (Series Average) 13
Chronic Inflation (Average) 31
Chronic Inflation (Series Maximum) 102
Low inflation (Series Average) 185
Table 3: OLS Regression Analysis with Interaction
Regressor FE Model Imputed Model
Lagged Inflation 0.9 (0.0) 0.9 (0.0)
Inflation Expectations 0.9 (0.1) 0.7 (0.1)
Information Precision 2.3 (7.8) 1.1 (4.95)
Inflation Expectations * Information Precision -1.2 (0.2) -0.9 (0.1)
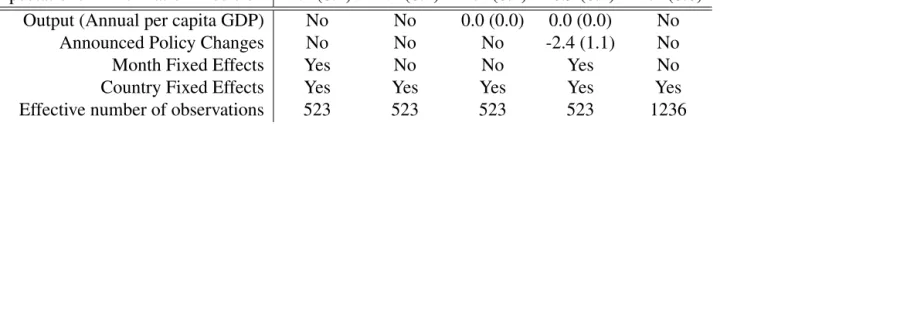
[image:24.612.152.462.433.508.2] [image:24.612.113.505.604.697.2]Table 4: OLS Regression Analysis with Interaction
Regressor Model 1 Model 2 Model 3 Model 4 Model 5 Lagged Inflation 0.9 (0.0) 0.9 (0.0) 0.9 (0.0) 0.9 (0.0) 0.9 (0.0) Inflation Expectations 0.9 (0.1) 0.9 (0.1) 0.9 (0.1) 0.9 (0.1) 0.7 (0.1) Information Precision 2.3 (7.8) 0.4 (2.9) 2.2 (8.1) 1.1 (5.0) 2.4 (0.9) Inflation Expectations * Information Precision -1.2 (0.2) -1.2 (0.2) -1.2 (0.2) -0.9 (0.1) -1.1 (0.0)
Output (Annual per capita GDP) No No 0.0 (0.0) 0.0 (0.0) No
Announced Policy Changes No No No -2.4 (1.1) No
Month Fixed Effects Yes No No Yes No
Country Fixed Effects Yes Yes Yes Yes Yes
Effective number of observations 523 523 523 523 1236
K-means Clustering of Inflation related Newspaper Articles
Information Precision, k = 3
F
re
q
u
e
n
cy
1.0 1.5 2.0 2.5 3.0
0
500
1000
1500
2000
[image:26.612.201.398.117.259.2]2500
Figure 1: Number of newspaper articles by types of information precision (most informative to least informative)
Distribution of the Information Environment
Ranking Informative Statements: 0 Low Information; 1, High Information
F
re
q
u
e
n
cy
0.0 0.2 0.4 0.6 0.8 1.0
0
1000
2000
3000
4000
[image:26.612.138.444.431.606.2]Figure 3: The marginal effect of inflation expectations on inflation
0.0 0.2 0.4 0.6 0.8 1.0
-1 .0 -0 .5 0.0 0.5 1.0
Level of Information Precision