Differences in birth-weight outcomes: A
longitudinal study based on siblings
Bacci, Silvia and Bartolucci, Francesco and Chiavarini,
Manuela and Minelli, Liliana and Pieroni, Luca
7 May 2014
Online at
https://mpra.ub.uni-muenchen.de/55789/
International Journal of
Environmental Research and
Public Health
ISSN 1660-4601
www.mdpi.com/journal/ijerph
Article
Differences in birtweight outcomes: A longitudinal study based
on siblings
Silvia Bacci1
,, Francesco Bartolucci1*, Manuela Chiavarini2, Liliana Minelli2, and Luca Pieroni
3
1
Department of Economics, University of Perugia, Via A. Pascoli, 20, 06123 Perugia, Italy.
2
Department of Experimental Medicine, Public Health Section, University of Perugia, P.le Gambuli, 1, 06122 Sant’Andrea delle Fratte (Perugia), Italy.
3
Department of Political Sciences, University of Perugia, Via A. Pascoli, 20, 06123 Perugia, Italy.
*Author to whom correspondence should be addressed; e-mail: [email protected], phone: (+39)075.585.5227, fax: (+39)075.585.5950.
Received: xx / Accepted: xx / Published: xx
Abstract: Objectives We investigate about the differences in birthweight between first-and second-borns, evaluating the impact of changes in pregnancy (e.g., gestational age), demographic (e.g., age), and social (e.g., education level, marital status) maternal characteristics.
Data and Methods All analyses are performed on data collected in Umbria (Italy) taking into account a set of 792 women who delivered twice from 2005 to 2008. Firstly, we use a univariate paired t-test for the comparison between weights of first- and second-borns. Secondly, we use linear and nonlinear regression approaches in order to: (i) evaluate the effect of demographic and social maternal characteristics and (ii) predict the odds-ratio of low and high birthweight infants, respectively.
Results We find that the birthweight of second-borns is significantly higher than that of first-borns. Statistically significant effects are related with a longer gestational age, an increased number of visits during the pregnancy, and the gender of infants. On the other hand, we do not observe any significant effect related with mother’s age and with other characteristics of interest.
1. Introduction
Categorical risk indicators based on birthweight are largely used in perinatal clinics and research. Part of the literature [1,2] investigated the relationship between birthweight and associated mortality rate and suggested the existence of population-specific standards for birthweight. However, the picture of a biological specificity of the birthweight was criticized by some studies in ethnically homogenous populations. Among others, Carlson and Hoem [3] found, in a study concerning the Czech Republic, that differences in birthweight distributions come from underlying differences in lifestyle and social conditions (see also [4], [5], and [6]). Thus, to limit the impact of confounding factors, empirical analyses focus on birth outcomes of siblings. Skjaerven et al. [7], for example, found a significant correlation between the birthweight of siblings, even if their study does not evaluate whether the level of association is affected by mothers’ individual and socioeconomic characteristics.
The purpose of the present study is to bridge the lack of the literature mentioned above and to examine differences in birthweight between first- and second-borns, evaluating the impact of changes in pregnancy (e.g., gestational age), demographic (e.g., age), and social (e.g, education level, marital status) maternal characteristics. These estimates are possible by re-examining information available from the Standard Certificate of Live Birth (SCLB) of a population of contemporary Italian women in the Umbria region and selecting a sample of 792 women who delivered twice from 2005 to 2008. Umbria is a region of around 900,000 inhabitants, situated in central Italy, where the number of births per year is around 8,000. Birthrate and fertility indexes have constantly increased and have moved close to the national average (birth-rate 2007: Italy 9.5%, Umbria 8.9%; fertility index 2007: Italy 1.40, Umbria 1.38).
The adopted longitudinal dataset, which reflects the low birth-rate of Italy in comparison to other European countries, also allows us to estimate the tendency toward a repetition of adverse pregnancy outcomes and, indirectly, to underlie the strength of the biological influence on determining birthweight at different occasions. While observational studies report increasing risks of the adverse pregnancy outcomes in low weight babies, there is not much theory to explain the increase of low birthweight borns during the second pregnancy. An exception is the nutritional depletion hypothesis [8,9]. This suggests that a too short period between pregnancies affects the recovering of the nutritional reserves for supporting fetal growth and contributes to the risk of fetal growth restriction. On the other hand, changes of mother’s behavior in conducting pregnancies (i.e., the reduction of the number of visits), in mother’s clinical patterns (i.e., gestational age), or gender composition of the child may explain differences in birthweights.
Our results show that birthweight of second-borns is significantly higher than that of first-borns. The effects of this difference are related with a longer gestational age, an increased number of visits during the pregnancy, and gender of infants. Instead, we do not observe any significant effect related with the mother’s age and with the other characteristics of interest. Besides, gestational age and gender result to be statistically significant also in explaining low and high weight births in comparison with normal weight babies.
more than 2.5 times for each added gestational week and they are 0.24 times for females with respect to males.
The structure of the article is as follows. The next section describes the data and the study population, the variables of interest, and the adopted statistical methods. Section3illustrates, from a statistical point of view, the main results obtained through the analyses. To conclude, these results are discussed in Section4.
2. Methods
Data source and study population. The study is based on a set of data obtained from the administration of the Standard Certificate of Live Birth (SCLB) in the Umbria region (Italy) in years 2005, 2006, 2007, 2008. SCLB is filled in within ten days after the delivery by one of the attendants the birth (e.g., doctor, midwife) and it collects information on the infants and mothers. Regarding each mother we know: age, citizenship, educational attainment, marital status, childbearing history, and prenatal care history (e.g., number of visits, gestational age at the first visit). In particular, we use mother’s citizenship to capture the effect on the birtweight of being a foreign mother with respect to being an Italian mother, even if this analysis may lead to an underestimation of this effect since it does not account for mothers born outside but having Italian citizenship. It is also worth noting that we use marital status as a proxy for living in a couple because our dataset does not include mother’s information about cohabitation. Referred to the infant, information include: birthweight, gestational age, and gender. For our study we consider women that delivered for the first time during years 2005-2008 and that delivered at least twice in this time interval; more precisely, we take into account information about the first and the second delivery. Moreover, we limit our attention to natural conceptions (i.e., without assisted fertilization methods) and singleton births. Finally, only infants with a gestational age of at least 22 weeks and a birthweight of at least 500 grams are taken into account. The total sample size resulting from the merging of each mother and her baby information amounts to 792.
Variables of interest. As already mentioned, our main interest is in the analysis of the difference in birthweight between first- and second-borns and the discovery of the significant determinants of this difference. For this aim, we here describe the main variables which are available in the dataset.
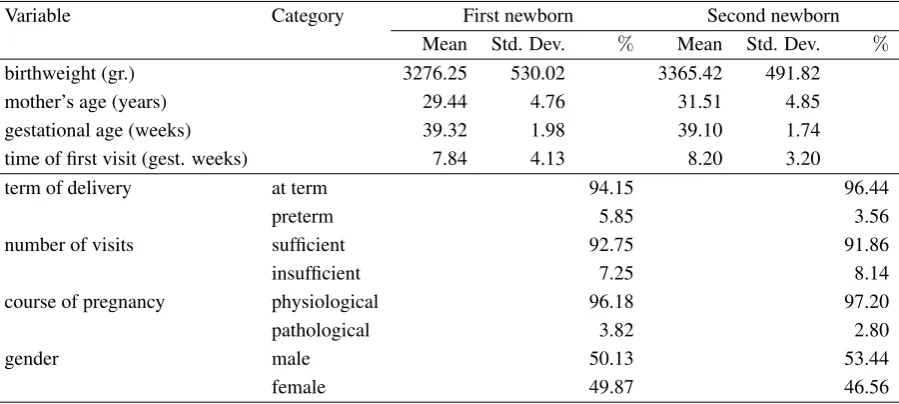
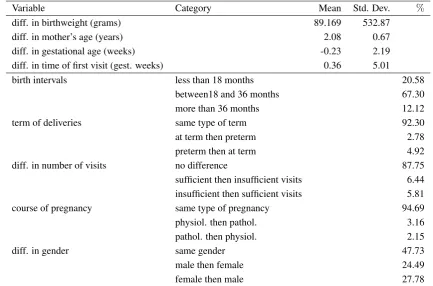
Commenting Tables1and2, reporting some descriptive statistics about the variables of interest, we observe an average birthweight equal to 3276.25 grams for the first babies, that increases to 3365.42 grams for the second babies. Several maternal characteristics may be assumed to explain this difference. We mainly take into account aspects that are strictly related with each pregnancy and, therefore, that can modify from one pregnancy to another one. In primis, we refer to the mother’s age, which in our dataset increases in average of two years between the first two deliveries (from 29.44 years for the first pregnancy to 31.51 for the second pregnancy). Moreover, 20.58%of deliveries takes place in less than
18 months apart from each other, whereas the birth intervals exceed 36 months in 12.12%of cases.
their older siblings (-0.23 gestational weeks), even if preterm deliveries take place in 3.56% of cases
versus 5.85%of first babies. In detail, we can observe that 2.78%of women delivers the first born after
37 weeks and the second-born before 37 weeks; on the other hand, 4.92% of women delivers the first
born before 37 weeks and the second-born after 37 weeks.
The prenatal care is measured by two proxies: (i) time of the first visit and (ii) total number of prenatal care visits, distinguishing between an insufficient (less than 4) and a sufficient (at least 4) number of visits. The first visit happens slightly later during the second pregnancy (8.20 gestational weeks versus 7.84 gestational weeks for the first pregnancy) and a higher proportion of women tends to reduce the total number of care visits (8.14%versus 7.25%declares an insufficient number of visits). Besides, 6.44%
of women has an insufficient number of visits during the second pregnancy although it was sufficient during the first one with respect to 5.81%of women showing an apposite behavior.
Another element that can have a certain influence on birthweight is the course of pregnancy, which is pathological for the 3.82% of first pregnancies and 2.80% of second ones. More in detail, we
distinguish between cases of physiological pregnancies followed by pathological pregnancies (3.16%)
and pathological pregnancies followed by physiological ones (2.15%).
Concerning gender of infants, in 47.73%of cases the second-born has the same gender than his/her
older sibling, in 24.49%of cases a female infant comes after a male one, and in the remaining 27.78%
of second pregnancies a male infant comes after a female one.
Finally, as control variables we also include in the analysis some social characteristics of women, such as citizenship, marital status, and educational level (Table3). We observe that79.04%of women is
Italian, whereas 11.36% comes from East-Europa. In addition, 87.50%of women is married and more
than one half (50.76%) has a high school diploma, followed by28.91%with a higher educational level
[image:5.595.74.524.530.732.2](degree or above); the remaining20.33%of women attained at most a compulsory educational level.
Table 1. Distribution of variables for first and second newborns: mean and standard deviation for quantitative variables and percentage values for categorical variables
Variable Category First newborn Second newborn Mean Std. Dev. % Mean Std. Dev. %
birthweight (gr.) 3276.25 530.02 3365.42 491.82 mother’s age (years) 29.44 4.76 31.51 4.85 gestational age (weeks) 39.32 1.98 39.10 1.74 time of first visit (gest. weeks) 7.84 4.13 8.20 3.20
term of delivery at term 94.15 96.44
preterm 5.85 3.56
number of visits sufficient 92.75 91.86
insufficient 7.25 8.14
course of pregnancy physiological 96.18 97.20
pathological 3.82 2.80
gender male 50.13 53.44
Table 2.Distribution of differences between second newborns and first newborns: mean and standard deviation for quantitative variables and percentage values for categorical variables
Variable Category Mean Std. Dev. %
diff. in birthweight (grams) 89.169 532.87 diff. in mother’s age (years) 2.08 0.67 diff. in gestational age (weeks) -0.23 2.19 diff. in time of first visit (gest. weeks) 0.36 5.01
birth intervals less than 18 months 20.58 between18 and 36 months 67.30 more than 36 months 12.12 term of deliveries same type of term 92.30 at term then preterm 2.78 preterm then at term 4.92 diff. in number of visits no difference 87.75 sufficient then insufficient visits 6.44 insufficient then sufficient visits 5.81 course of pregnancy same type of pregnancy 94.69 physiol. then pathol. 3.16 pathol. then physiol. 2.15
diff. in gender same gender 47.73
male then female 24.49
female then male 27.78
Table 3. Distribution of control variables
Variable Category %
citizenship Italian 79.04 East-Europe 11.36 other citizenship 9.60 marital status married 87.50
not married 12.50 educational level middle school or less 20.33 high school 50.76 degree or above 28.91
Statistical methods. We first test that the difference in birthweight between first- and second-borns is equal to 0 by a univariate paired t-test. Secondly, we consider the difference in birthweights as a quantitative response variable in a linear regression model, where the explanatory variables previously described are introduced as covariates. Finally, the birthweight of first- and second-borns is categorized in a suitable way and the longitudinal structure of data is explicitly taken into account in a conditional (or fixed effects) ordered logit model [10–14]. In detail, we define a categorical variable for the birthweight, which corresponds to a low birthweight (< 2500 gr), normal weight (between 2500and 4000gr), and
high birthweight (≥ 4000 gr), as suggested by the main part of literature [15]. The proposed model
[image:6.595.195.402.453.587.2]analysis, so as to obtain a useful model for predicting possible negative outcomes in terms of low and high birthweight due to the effect of statistically significant time-varying covariates.
3. Results As illustrated in Table4, reporting the results of a pairedt-test for the comparison between
averages, the second-borns tend to have a birthweight greater than 89.17 grams with respect to the first ones. With a p-value smaller than 0.001, the performed paired t-test allows us to conclude for a substantially significant difference between the two outcomes.
Table 4. Pairedt-test for the comparison between birthweights
Variable value std. err. t-value df p-value difference in birthweight 89.17 18.93 4.71 791 0.000
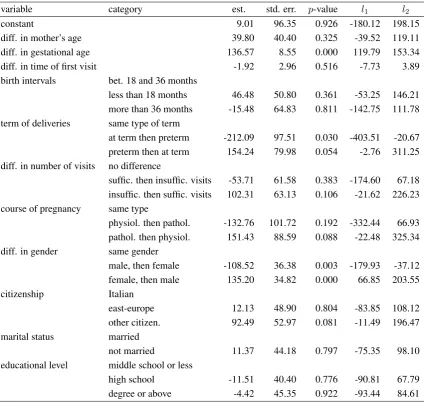
In order to detect possible determinants of the difference at issue, a linear regression model is estimated taking into account the covariates described in Tables2and3. The parameter estimates of the model containing all the possible covariates are shown in Table 5, whereas those of the model obtained by a backward selection process and containing only the statistically significant covariates are reported in Table6. These tables show the following quantities: estimates of regression coefficients, corresponding standard errors, p-values, and the inferior and superior limits (denoted byl1 andl2, respectively) of the
95%confidence intervals.
The proposed model (Table 5) explains 41.86% of the global variance of the response variable;
however, we observe that most covariates are not statistically significant. More precisely, no effect may be ascribed to the increasing of the mother’s age nor to the time of the first prenatal care visit. Neither the birth intervals help to explain the general tendency to the increase of birthweight. We only observe a certain effect (p-value = 0.088) related with possible changes in the course of the second pregnancy with respect to the first one: a physiological pregnancy that follows to a pathological one results in a positive difference of birthweight (+151.43 grams) rather than second pregnancies having the same course of the first ones. On the other hand, no significant difference is observed in case of pathological pregnancies following physiological pregnancies.
Concerning mother’s social characteristics, we only observe a weak effect of citizenship (p-value = 0.081): second-borns of women of other citizenship tend to present a greater birthweight increase with respect to those of Italian women. This can be explained by a greater awareness of the possibility and usefulness of prenatal care that foreign women gain during the first pregnancy, whereas Italian women are generally well-informed already from the beginning of first pregnancy.
On the basis of the model resulting by the backward selection process (Table6), we may impute a large part (41.94%) of the variability of the analyzed phenomenon to the effect of: (i) differences in
gestational ages, (ii) differences in term of deliveries, (iii) differences in the number of prenatal care visits between first and second delivery, and (iv) differences in the gender of first- and second-born babies.
Each additional gestational week leads to an average increase of 139.83 grams in the birthweight (l1 = 123.47, l2 = 156.19). Moreover, preterm deliveries that follow at term deliveries are
term deliveries following preterm deliveries present a higher birthweight increase (+179.65 gr) than same term deliveries. Another partly significant effect is due to the number of prenatal care visits: second-borns with a sufficient number of visits during the pregnancy show an increase of 130.87 grams (l1 = 9.55, l2 = 252.19) with respect to their sibling unsatisfactorily followed during the previous
pregnancy. We also observe that the effects of the term of deliveries and of the number of prenatal care visits are both significant at 5%level, but not at1%level.
Finally, the different gender between siblings plays a relevant role. In the presence of first male borns and second female borns, we may observe a negative difference between the birthweights (-104.92 gr) with respect to the case of siblings having the same gender. Similarly, we observe a positive difference (+136.74 gr) in the case of first female borns and second male borns.
To conclude, we outline that the main part of the variability of the differences in birthweight between first- and second-borns is not explainable through the independent variables taken into account in our analysis. Indeed, after controlling for all the significant covariates, it remains an expected residual increase in birthweight equal to 97.84 gr (p-value<0.0001;l1 = 54.95, l2 = 140.74). In other words,
a woman with a second pregnancy equal to the first one for gestational age, term of delivery, number of prenatal care visits, and gender of baby can expect an infant with a weight of 97.84 grams higher than the younger sibling. One or more changes in the mentioned significant variables give further changes in the birthweight, according with the estimated regression coefficients of Table6.
As mentioned at the end of Section 2, it may be useful to develop a model for the prediction of negative outcomes in second babies, given information about first babies. In this regard, Table7shows the conditional distribution of the birthweight of second-borns (birthweight2) given the birthweight of
first-borns (birthweight1). On one hand, the frequency of low birthweight second babies given normal
weight first babies is equal to 2.9%; however, this value rise to 20.5% when first babies are low
birthweight. Similarly, the proportion of high birthweight second babies given normal weight first babies is equal to 6.6%; however, this value rise to 27.3%when first babies are high birthweight, too.
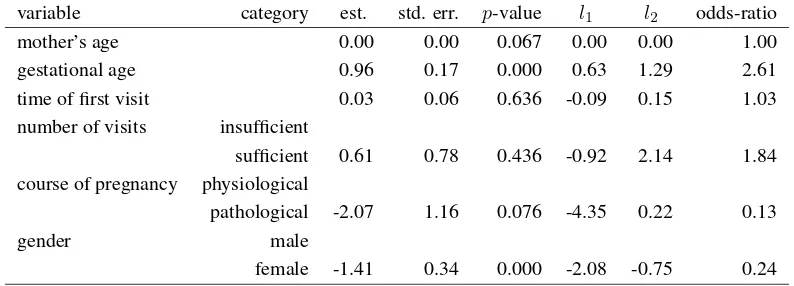
The tendency to have a low or a high birthweight baby may be predicted through a conditional ordered logit model for longitudinal data, where the categorical birthweight of first- and second-borns is taken as response variable and the other variables listed in Table 5 are inserted as covariates. We outline that the adopted model is estimated by the conditional maximum likelihood method (for a review, see [14]). As a main consequence we have that only the time-varying effects may be estimated, whereas the time-constant control effects (such as citizenship) are automatically dropped from the analysis. Results in Table 8 show that gestational age and gender are the only significant covariates which can explain differences in the probability of having babies with different birthweight. On one hand, we may conclude that for each additional gestational week the odds-ratio of having a normal or high birthweight baby increases 2.61 times as well as the odds-ratio of having a high weight baby; the same odds-ratio reduces by 76% (odds-ratio estimate equals 0.24) for females with respect to males. On the other hand, as
concerns the remaining covariates, a certain effect (p-value = 0.076) is due to the course of pregnancy, whereas the intervention covariates, such as time of first prenatal care visit and number of visits, do not play any significant role for the birthweight prediction.
Table 5.Linear regression results for the differences in birthweight: all covariates (adjusted R2
= 0.4186)
variable category est. std. err. p-value l1 l2
constant 9.01 96.35 0.926 -180.12 198.15 diff. in mother’s age 39.80 40.40 0.325 -39.52 119.11 diff. in gestational age 136.57 8.55 0.000 119.79 153.34 diff. in time of first visit -1.92 2.96 0.516 -7.73 3.89 birth intervals bet. 18 and 36 months
less than 18 months 46.48 50.80 0.361 -53.25 146.21 more than 36 months -15.48 64.83 0.811 -142.75 111.78 term of deliveries same type of term
at term then preterm -212.09 97.51 0.030 -403.51 -20.67 preterm then at term 154.24 79.98 0.054 -2.76 311.25 diff. in number of visits no difference
suffic. then insuffic. visits -53.71 61.58 0.383 -174.60 67.18 insuffic. then suffic. visits 102.31 63.13 0.106 -21.62 226.23 course of pregnancy same type
physiol. then pathol. -132.76 101.72 0.192 -332.44 66.93 pathol. then physiol. 151.43 88.59 0.088 -22.48 325.34 diff. in gender same gender
male, then female -108.52 36.38 0.003 -179.93 -37.12 female, then male 135.20 34.82 0.000 66.85 203.55 citizenship Italian
east-europe 12.13 48.90 0.804 -83.85 108.12 other citizen. 92.49 52.97 0.081 -11.49 196.47 marital status married
not married 11.37 44.18 0.797 -75.35 98.10 educational level middle school or less
high school -11.51 40.40 0.776 -90.81 67.79 degree or above -4.42 45.35 0.922 -93.44 84.61
Table 6. Linear regression results for the differences in birthweight: statistically significant covariates (α= 0.05; adjusted R2
= 0.4194)
variable category est. std. err. p-value l1 l2
constant 97.84 21.85 0.000 54.95 140.74 diff. in gestational age 139.83 8.33 0.000 123.47 156.19 term of deliveries same type of term
at term, then preterm -196.25 96.23 0.042 -385.15 -7.34 preterm, then at term 179.65 78.25 0.022 26.05 333.26 diff. in number of visits no difference
insuffic. then suffic. visits 130.87 61.80 0.035 9.55 252.19 diff. in gender same gender
male, then female -104.92 35.92 0.004 -175.42 -34.41 female, then male 136.74 34.5 0.000 69.01 204.47
[image:9.595.81.515.582.742.2]Table 7. Absolute frequencies of low, normal and high weights of first and second babies (in parentheses there are the conditional percentage values of second newborns given first newborns)
birthweight2
birthweight1 low birthweight normal weight high birthweight Total low birthweight 9 (20.5) 34 (77.3) 1 (2.3) 44 (100.0) normal weight 20 (2.9) 627 (90.5) 46 (6.6) 693 (100.0) high birthweight 0 (0.0) 40 (72.7) 15 (27.3) 55 (100.0) Total 29 (3.7) 701 (88.5) 62 (7.8) 792 (100.0)
Table 8. Conditional ordered logit regression results for the birthweight: all covariates*.
variable category est. std. err. p-value l1 l2 odds-ratio mother’s age 0.00 0.00 0.067 0.00 0.00 1.00 gestational age 0.96 0.17 0.000 0.63 1.29 2.61 time of first visit 0.03 0.06 0.636 -0.09 0.15 1.03 number of visits insufficient
sufficient 0.61 0.78 0.436 -0.92 2.14 1.84 course of pregnancy physiological
pathological -2.07 1.16 0.076 -4.35 0.22 0.13
gender male
female -1.41 0.34 0.000 -2.08 -0.75 0.24
*Estimated odds-ratios refer to normal or high birthweight infants versus low birthweight infants and to high birthweight infants versus low or normal birthweight infants.
The association between gestational age and birthweight (and mortality) is one of the most studied topic within perinatal epidemiology [18]. Observational studies showed unambiguously that the first- and second-born birtweights depend on the specific distribution of mothers’ delivery term [19]. The potential determinants summarized by the weight-specific fetal growth rate curves indicate the gestational age as the main explanatory variable affecting the weight of newborns, in particular when associated with pathological pregnancies.
Although the birtweight is partly explained by a genetic influence [20], a positive correlation between terms of delivery and birthweight is confirmed in the change from preterm deliveries to at term deliveries or vice-versa. There is a remarkable difference on birthweight if this clinical determinant arises and the underlying mechanism is similar to that for the gestational age. There is an increase in the risk for a preterm birth (and a low birthweight) when an abnormal fetal growth pattern is recognized.
[image:10.595.99.496.274.417.2]prenatal access [28]1. This hypothesis is confirmed by Chiavariniet al. [29], who found for the same region of Umbria a reduction of the inequality of the prenatal care utilization of the 30% from 2005 to 2010.
Differences in second birthweight by changes in gender (e.g., positive from female to male; negative from male to female) might be explained by the specific intrauterine growth patterns. As argued by Wald
et al. [30] and Catalanoet al. [31], the reasons for these sex-related differences are still unclear even if fetal sex seems to affect genetic and environmental regulators of fetal growth [32]. Lamplet al. [33] found in a longitudinal study that the growth of male fetuses is more sensitive to maternal weight and height, varying with gestational age. Thus, the authors suggested that fetal sex may regulate the effects of biological and non-biological determinants of intrauterine growth.
Being focused on average of the weight distribution, the variation of birthweight between first and second birth may have limited implications because it does not refer to high-risk infants [34]. When we focus on the difference of birthweight, we find that the weight of the second-born is predicted significantly from the weight of the first-born, whereas the number of prenatal care visits and the time of the first visit are not predictors of babies at risk of low and high birtweights.
Our results suggest that factors affecting the probability of having a low or high birthweight first-born also affect the probability of having a second-born baby with problematic birthweight. While we are able to show that the folate depletion hypothesis tested by Smitset al. [35] is not supported by the data, as the interval between pregnancies is never significant, we have to conclude cautiously about the public health implications. This statement is also strengthened by some limitations of our sample. On one hand, the decision to give birth twice within a 4-year period may be associated with other birth outcome factors related to the mother’s career, educational level, and wage. The use of sibling fixed effects only partly alleviates this selection concern by focusing strictly on within family differences. On the other hand, the absence in the dataset of some covariates that the current literature has found to affect the birth weight, as for example if a mother smokes or not and their status change during the two pregnancies, makes the precision of estimates questionable. For instance, mothers who smoke during pregnancy have babies that weigh less by 100-200 grams [36]. In addition, we find that, while prenatal care visits are of importance for birthweight distributions, they do not affect the risk of having a baby with risky birthweight.
Finally, we expect to rely on followup studies which account for changes in risky behavioral habits of mothers between pregnancies. Concerning this point, recently SCLBs have been enriched with information about smoking and drinking habits, which can be used in a future development of our work to investigate more thoroughly the determinants of changes in birthweight of subsequent births.
Acknowledgements
Main text.
Author contributions
1 For example, prenatal care utilization may have had a shift in Italy from the European enlargement in 2007, which gave
The present work is the result of the ideas and the contribution of all the co-authors. Bacci and Bartolucci were mainly involved in the drafting of Sections 2 and 3, whereas Chiavarini, Minelli, and Pieroni mainly worked on Sections 1 and 4.
Conflicts of Interest
“The authors declare no conflicts of interest”
References
1. Wilcox, A.; Russell, I. Birthweight and perinatal mortality: I. On the frequency distribution of birthweight. Int J Epidemiol1983, 12, 314–318.
2. Wilcox, A.; Russell, I. Why small black infants have a lower mortality rate than small white infants: the case for population-specific standards for birth weight. J Pediatr1990, 116, 7–10. 3. Carlson, E.; Hoem, J. Low-weight neonatal survival paradox in the Czech Republic. Am J
Epidemiol1999, 149, 447–453.
4. Shoham-Yakubovich, I.; Barell, V. Maternal education as a modifier of the association between low birthweight and infant mortality. Int J Epidemiol1988, 17, 370–377.
5. Foster, H.J. The enigma of low birth weight and race. N Engl J Med1997, 337, 1232–1233. 6. Chiavarini, M.; Bartolucci, F.; Gili, A.; Pieroni, L.; Minelli, L. Effects of Individual and Social
Factors on Preterm Birth and Low Birth Weight: an Italian case study. Int J Public Health2012,
57, 261–268.
7. Skjaerven, R.; Wilcox, A.; Russell, D. Birthweight and perinatal mortality of second births conditional on weight of the first. Int J Epidemiol1988, 17, 830–838.
8. Winkvist, A.; Rasmussen, K.; Habicht, J. A new definition of maternal depletion syndrome. Am J Public Health1992, 82, 691–694.
9. King, J. The risk of maternal nutritional depletion and poor outcomes increases in early or closely spaced pregnancies. J Nutr2003, 133, 1732S–1736S.
10. Diggle, P.J.; Heagerty, P.; Liang, K.Y.; Zeger, S.L. Analysis of Longitudinal Data; Oxford University Press: Oxford, 2002.
11. Andersen, E.B. Asymptotic properties of conditional maximum-likelihood estimators. Journal of the Royal Statistical Society, Series B1970, 32, 283–301.
12. Andersen, E.B. The numerical solution of a set of conditional estimation equations. Journal of the Royal Statistical Society, Series B1972, 34, 42–54.
13. Chamberlain, G. Analysis of covariance with qualitative data. Review of Economic Studies1980,
47, 225–238.
14. Baetschmann, G.; Staub, K.E.; Winkelmann, R. Consistent estimation of the fixed effects ordered logit model. IZA Discussion Paper2011, 5443.
15. W.H.O. International classification of disease. World Health Organization. Geneva1975, 1. 16. McCullagh, P. Regression models for ordinal data. Journal of the Royal Statistical Society Series
B1980, 42, 109–142.
18. Melve, K.; Skjaerven, R.; Gjessing, H.; Oyen, N. Recurrence of gestational age in sibships: implications for perinatal mortality. Am J Epidemiol1999, 150, 756–762.
19. Skjaerven, R.; Gjessing, H.; Bakketeig, L. Birthweight by gestational age in Norway. Acta Obstet Gynecol Scand2000, 79, 440–449.
20. Skjaerven, R.; Gjessing, H.; Bakketeig, L. New standards for birth weight by gestational age using family data. Am J Obstet Gynecol2000, 183, 689–696.
21. EURO-PERISTAT. European Perinatal Health Report. Nber working papers, EURO-PERISTAT, 2008.
22. Johnson, A.; Hatcher, B.; El-Khorazaty, M.; Milligan, R.; Bhaskar, B.; Rodan, M.; et al.. Determinants of inadequate prenatal care utilization by African American women. Journal of Health Care for the Poor and Underserved2007, 18, 620–636.
23. Beeckman, K.; Louckx, F.; Putman, K. Predisposing, enabling and pregnancy-related determinants of late initiation of prenatal care. Matern Child Health J2011, 15, 1067–1075. 24. Braveman, P.; Bennett, T.; Lewis, C.; Egerter, S.; Showstack, J. Access to prenatal care following
major medicaid eligibility expansions. JAMA1993, 269, 1285–1289.
25. Rowe, R.; Magee, H.; Quigley, M.; Heron, P.; Askham, J.; Brocklehurst, P. Social and ethnic differences in attendance for antenatal care in England. Public Health2008, 122, 1363–1372. 26. Delvaux, T.; Buekens, P.; Godin, I.; Boutsen, M. Barriers to prenatal care in Europe. American
Journal of Preventive Medicine2001, 21, 52–59.
27. Ayoola, A.; Nettleman, M.; Stommel, M.; Canady, R. Time of pregnancy recognition and prenatal care use: a population-based study in the United States. Birth2010, 37, 37–43.
28. Lariccia, F.; Mussino, E.; Pinnelli, A.; Prati, S. Differences between Italian and foreign women in the use of antenatal care. Genus2013, LXIX, 35–51.
29. Chiavarini, M.; Salmasi, L.; Pieroni, L.; Lanari, D.; Minelli, L. Access equality to prenatal care in Italy: the effects of socio-demographic determinants. Eur J Public Health2013, 23, 247. 30. Wald, N.; Cuckle, H.; Nanchahal, K.; Turnbull, A. Sex differences in fetal size early in pregnancy.
Br Med J (Clin Res Ed)1986, 292, 137.
31. Catalano, P.; Drago, N.; Amini, S. Factors affecting fetal growth and body composition. Am J Obstet Gynecol1995, 172, 1459–1463.
32. de Zegher, F.; Francois, I.; Boehmer, A.; Saggese, G.; Müller, J.; Hiort, O.; et al.. Androgens and fetal growth. Horm Res1998, 50, 243–244.
33. Lampl, M.; Gotsch, F.; Kusanovic, J.; Gomez, R.; Nien, J.; Frongillo, E.; et al.. Sex differences in fetal growth responses to maternal height and weight. Am J Hum Biol2010, 22, 431–443. 34. Reeves, S.; Bernstein, I. Optimal Growth Modeling. Semin Perinatol.2008, 32, 148–153. 35. Smits, L.; Essed, G. Short interpregnancy intervals and unfavourable pregnancy outcome: role
of folate depletion. Lancet2001, 358, 2074–2077.
c