Munich Personal RePEc Archive
Coal Mining, Economic Development,
and the Natural Resource Curse
Betz, Mike and Farren, Michael and Lobao, Linda and
Partridge, Mark D.
9 August 2014
By
Mike Betz1 Michael Farren2
Linda Lobao3 Mark D. Partridge2
August 9, 2014
Abstract: Coal mining has a long legacy of providing needed jobs in isolated communities but it is also associated with places that suffer from high poverty and weaker long-term economic growth. Yet, the industry has greatly changed in recent decades. Regulations, first on air, have altered the geography of coal mining, pushing it west from Appalachia. Likewise, technological change has reduced labor demand and has led to relatively new mining practices such as invasive mountain-top approaches. Thus, the economic footprint of coal mining has greatly changed in an era when the industry appears to be on the decline. This study investigates whether these changes along with coal’s “boom/bust” cycles have affected economic prosperity in coal country. We separately examine the Appalachian region from the rest of the U.S. due to Appalachia’s unique history and different mining practices. Our study takes a new look at the industry by assessing the winners and losers of coal development around a range of economic indicators and
addressing whether the natural resources curse applies to contemporary American coal
communities today. The results suggest that modern coal mining has rather nuanced effects that differ between Appalachia and the rest of the U.S. We do not find strong evidence of a resources curse, except that coal mining has a consistent inverse association with measures linked to population growth and entrepreneurship, and thereby future economic growth.
1. Department of Human Sciences, The Ohio State University. Email: [email protected]. 2. Department of Agriculture, Environment, and Development Economics. The Ohio State University. Email Farren: [email protected]; Email Partridge: [email protected]. 3. School of Environment and Natural Resource. The Ohio State University. Email: [email protected].
*This study was partially supported by the Appalachian Research Initiative for Environmental Science (ARIES). ARIES is an industrial affiliates program at Virginia Tech, supported by members that include companies in the energy sector. The research under ARIES is conducted by independent researchers in accordance with the policies on scientific integrity of their
institutions. The views, opinions and recommendations expressed herein are solely those of the authors and do not imply any endorsement by ARIES employees, other ARIES-affiliated
1" ""
1. Introduction
Nations globally are undergoing an energy revolution that is not only altering the international geopolitical balance but also the economic landscape of energy producing communities. The related effects are producing winners and losers between regions as well as within affected U.S. communities. Factors underlying this revolution in the U.S. include (1) the Clean Air Act of 1990 that increased demand for low-sulfur Western coal at the expense of Appalachian coal; (2) innovations in unconventional drilling in shale formations for oil and natural gas that began in the late 1990s; (3) U.S. climate change policies to reduce carbon which would further increase demand for natural gas relative to coal; and (4) growing demand for natural gas and coal in India and China (EIA, 1999, 2005, 2013). The transformation of the U.S. energy sector raises a critical need to identify the impacts of energy development across the nation and particularly for
communities in Appalachia that have historically been influenced by coal and where new shifts in the energy industry may be altering regional economic well-being. In particular, with policies aimed at limiting carbon and coal mining, understanding the economic effects on the affected communities to these regulations is urgently needed.
communities have experienced additional pressure as the region’s coal production began to lag long before the natural gas boom spread nationally.
While there has been a (gross) expansion of jobs related to the recent shale oil and gas boom, many of these jobs have come at the expense of falling employment in the coal industry. This shift may produce net positive or negative local economic effects depending on factors such as each industry’s relative capital intensity, supply chain size, and the proportion of jobs that go to local residents versus transient shale workers. Communities in the midst of the shale energy boom have seen economic growth—e.g., the Eagle Ford region in Texas and the Marcellus Shale region, but many of these jobs are offset by falling coal employment elsewhere.
These new and diverging trends within the energy sector suggest an urgent need to identify the community impacts of energy development, especially at a research scale that considers the entire nation. However, research on the recent energy boom is surprisingly sparse. Most studies focus on the pre-boom period that are less germane to trends associated with new technologies. Other related research examines general boom/bust cycles in energy and whether there is a “natural resources curse” in which natural resource intense locations appear to have lower long-run growth rates when averaging over the boom-bust cycle (Van der Ploeg, 2011). Some regional shale based research exists. Weber (2012) examines the shale gas boom in Colorado, Texas, and Wyoming and finds modest employment effects below those reported by industry sponsored research. Weinstein and Partridge (2011) examine the initial effects of the Pennsylvania Marcellus shale boom. They likewise find modest employment effects but also robust income growth effects presumably due to high royalty/lease payments and wages in the industry, though these studies examined more the short- to medium-term impacts of extraction.
3" ""
communities face tremendous pressures for which it is important to understand losers as well as winners. Second, the modern coal industry may have long-term effects different from those in the past which could challenge the prevailing understanding of the natural resource curse. In this manner, the industry has undergone tremendous technological change with falling employment and increased capital-intensive techniques such as mountain-top mining. Finally, as noted above, there has been a spatial redistribution of the industry with production moving west. Thus, the impacts of the coal industry are likely quite different now across both time and space.
In this study, we take a new look at the coal industry by assessing its net impacts on local communities today and providing unique contributions that respond to gaps in past work. First, we appraise a variety of indicators of economic well-being that include employment, population, and income distribution. These indicators allow us to assess not only coal mining’s effects between communities—but also the winners and losers within communities. Second, we treat two distinct epochs of energy development: 1990-2000—a period of low coal prices but modestly rising production; and 2000-2010—a period of higher coal prices but more stable production. Third, the analysis examines Appalachia separately from the rest of the United States and contributes to assessing short-term effects, as well as long-term effects associated with the natural resources curse. Fourth, we make summary comparisons with the impacts of the oil and gas industry: few if any past studies assess the performance of coal relative to these sectors. Finally, a key advantage of our empirical analysis is the use of instrumental variables in accounting for the non-random location of coal mining. We consider exogenous geological instruments both for the quantity of coal as well as the quality of coal. In doing so, we contribute to the emerging methodological literature measuring the impact of energy development.
In what follows, we first review the literature and evaluate recent trends in the coal industry. The conceptual model is then explained, followed by sections that discuss the empirical model, empirical results, and research conclusions.
2. Previous Literature
has shifted from cross-country research to subnational analyses of local economies. Scrutinizing the economic impacts of natural resource extraction at a regional level is important in part because factors salient at a national level (e.g. civil wars and exchange rates) play less
confounding roles. Further because the impact of natural resource extraction on local economic outcomes is highly dependent on context (i.e. the resource being extracted, the specific economic outcome, and the local setting), subnational studies provide a finer resolution of the specific situation. As subnational research has expanded, nuances about diverse contexts as well as the identification of broad patterns that hold across contexts have begun to emerge. Below we summarize findings for the most recent investigations of economic outcomes at a subnational level. They generally point to short-term employment and wage increases, especially during boom periods, but are mixed for long-term outcomes in natural resource dependent areas.
5" ""
Because of its focus on coal, Black et al. (2005a) is particularly germane to our research.
The authors use the presence of coal reserves as an instrumental variable to determine
differences in employment, earnings, and earnings per worker between coal and non-coal
dependent counties in Kentucky, West Virginia, Ohio, and Pennsylvania. They examine the
boom period of the 1970s, comparing the findings to the bust period of the 1980s. Wages and
employment in the energy sector did indeed grow faster in coal counties than non-coal counties
during the boom; however few positive spillovers into the non-traded sector or negative
spillovers into the traded sectors were found. Of course, given the vast technological changes and
different regulatory environments, it is unclear how much Black et al.’s (2005a) study would
generalize today, especially since it did not consider the entire United States. In a more recent
study, Douglas and Walker (2012) found that annual per-capita income growth between
1970-2009 was about 0.3% to 0.4% less in core Appalachian counties that ever had coal production as
compared to otherwise equal Appalachian counties. However higher (global) energy prices
mitigate these effects, presumably because they stimulate short-term coal development,
consistent with a boom-bust effect.
The aforementioned studies are concerned mainly with boom or bust periods that span a
decade or two. But they do not address the question of long-term viability of natural resources
extraction as a regional development strategy. Michaels (2011) investigates the long-term
consequences of natural resource extraction by analyzing southern U.S. counties overlaying
significant oil reserves in 1890. By 1990, counties overlaying oil reserves had higher per capita
incomes, larger populations, and more public infrastructure compared to other southern U.S.
counties without oil resources. However, these positive effects begin to wane around 1960.
Michaels’ (2011) study is limited insofar as it does not address when the region experienced
energy development and the size of the impact such as measured by the share of “energy”
employment. Peach and Starbuck (2010) find oil and gas extraction had a similar positive
long-term correlation with income, employment, and population for New Mexico from 1960-2000.
distributional effects of high-intensity natural resource extraction. For instance, while Black et al.
(2005a) report positive employment spillovers into local non-traded sectors during the boom,
losses in non-traded jobs during the bust were even larger. Specifically, every ten additional coal
jobs gained during the boom were associated with two additional jobs created in the local sector,
but every ten coal jobs lost during the bust was correlated with 3.5 local sector jobs lost. Deaton
and Niman (2012) use decennial census data to analyze the effect of coal mining employment on
poverty rates in Appalachia. They found increases in contemporaneous mining employment
reduce poverty. However, higher levels of mining employment ten years prior were associated
with higher poverty rates and the effect was stronger than the contemporaneous effect, consistent
with a resources curse explanation. Partridge et al. (2013), using data encompassing the entire
U.S., found that the association between coal mining and poverty was stronger in Appalachia
than the rest of the nation. Further, this association was stronger in the low-price coal period of
the 1990s than in the post-2000 decade of higher coal prices.
Other subnational studies find natural resource extraction in general retards economic
growth, consistent with findings from the international development literature (Corden, 1984;
Sachs and Warner 1995, 2001; Van der Ploeg 2011). These studies attempt to identify the
channels through which such a process may occur. Using state-level data, Papyrakis and Gerlagh
(2007) find that growth in Gross State Product (GSP) over 1986-2001 is significantly and
negatively correlated with the initial share of the primary sector in GSP. Nearly all of this
negative relationship between primary sector share and GSP is attributable to differences in
education, R&D investment, market openness, and corruption. Similarly, Freeman (2009) finds
agriculture and mining employment is significantly and negatively correlated with GSP. James
and Aadland (2011) find that the county share of primary sector earnings is negatively correlated
with annual growth in per capita income, further suggesting that the negative effects of natural
resource extraction operate at a sub-state level. Looking over the long-term from 1980-2011,
Haggerty et al. (forthcoming) found that the oil and gas boom of the 1980s had negative
7" ""
Subnational studies also provide some evidence that natural resource extraction negatively affects broader societal outcomes beyond income and employment that influence economies over the long term (Haggerty et al., forthcoming). Black et al. (2002) find that in Appalachian states affected by the coal boom and bust of the 1970s and 1980s, disability
enrollments fall in coal booms and rise in busts. Black et al. (2003), using the same instruments, find welfare program expenditures are correlated with coal boom and busts. Black et al. (2005b) also find that local educational attainment falls during coal booms which in turn may reduce long-term economic growth.
In sum, while some recent studies exist a number of gaps remain. Coal itself has been relatively little scrutinized and particularly how it performs relative to gas and oil. The natural resource curse and its application to Appalachia remains a source of debate. Research is in need of methodological updates that include modeling the non-random location of mining. Past studies are limited in scope and typically do not span the entire country. Finally, only a handful of economic outcome indicators have been examined. Few studies trace gains or losses for an array of different economic groups within communities such as local entrepreneurs, the middle class, different occupational segments, and the disabled. Our study provides a novel contribution to research on the economic impacts of natural resource extraction by filling these gaps.
3. Recent Coal Industry Trends
During the 1990s and post-2000 periods of our analytical focus, the coal industry experienced several major transformative events. Figure 1 shows the general decline of coal employment since 1948 starting with the rapid due to labor saving technological change that primarily reduced employment by nearly 75% by 1970. With the 1970s coal boom period identified by Black et al. (2005a), employment rose by 74% between 1970-1980 (from a smaller 1970 base). Then with the 1980s bust, industry employment fell 42% and another 47% during the 1990s.
Data are not strictly comparable between the pre- and post-2000 periods due to different sources in which the pre-2001 U.S. Bureau of Economic Analysis (BEA) data includes
workers after 2000. The BLS data also include coal industry support workers, miniscule in 2001 but rising thereafter. Summing the two coal sectors’ employment, total coal employment was up 14% between 2001 and 2010, consistent with a marked turnaround for the industry especially given the ongoing technological change that reduces employment.
Real coal prices over the 1970-2010 period are shown in Figure 2. The coal boom of the 1970s and the bust of the 1980s identified by Black et al. (2005a) are apparent. Consistent with declining employment, real coal prices continued to decline in the 1990s, falling 41%. Yet, real prices rose 68% between 2000-2010, likely a key reason for rising coal employment during the period. Thus price and employment trends both support the view that the 1990s was a “bust” period and 2000-2010 was a “boom” period. Nonetheless as noted, Appalachian coal regions particularly suffered after 1998, indicating that the region should be considered separately from the rest of the United States.1
4. Conceptual model
Energy development and booms can create relatively large economic shocks—especially in small rural settings. Such shocks can push the economy past an agglomeration threshold or critical mass allowing growth to endogenously take-off. Perhaps the best known theoretical representation is the New Economic Geography models in which growth takes off due to
increased variety and stronger input-output linkages (Krugman, 1991). Houston, Texas may be a good example for the oil industry as it added supply chain and higher-level corporate functions. Yet, the typical coal mining or oil patch town is small, suggesting that a spatial equilibrium framework is more appropriate in this general case, in which growth does not permanently remain above that of the pre-boom because agglomeration thresholds are unlikely to be crossed.
The spatial equilibrium framework suggests that equilibrium profits and utility levels are equalized across space (Glaeser, 2007; Partridge et al., 2008). Firm profits πi in location i are negatively related to the representative wage wiand land costs (rents) ri. Site specific amenities si
""""""""""""""""""""""""""""""""""""""""""""""""""""""""""""" 1
Appalachia varies from the rest of the country for many other reasons including different coal production
9" ""
may positively or negatively affect firm profits. When a location i experiences a positive
(negative) economic shock, economic profits are greater (less) than the national average,
attracting new (losing existing) firms, while wages and rents begin to increase:
∆firms = f(πi – πavg), f’>0. (1)
Households in i maximize their indirect utility function V(wi,ri,si), which is positively
related to wages wi, inversely related to housing costs (rents) ri,and positively related to site
specific amenities s that affect quality of life (or negatively related to disamenities). When a
location i experiences a positive economic shock that increases its wages and rents, household
utility initially rises above the national average Vavg and new workers are attracted by higher real
wages. This process is represented by:
NetMigi = g(Vi – Vavg), g’>0. (2)
The mechanism restoring equilibrium is higher wages and rising land costs (as people move in)
that reduce profits on the firm side, while real wages eventually decline on the household side
with rising housing costs. Households may be negatively impacted even further if quality of life
declines due to greater congestion; and firms may be affected if other local institutional factors
are altered. Once spatial equilibrium is restored, location i grows at the national average rate.
In an energy boom, wages and housing costs begin to rise as energy-related industries
need to attract new workers, beginning the process just described. Factor prices and housing
prices get bid up, slowing down employment growth and the higher housing prices eventually
stem migration as household utility and profits return to the national average. In the short to
medium term, the location experiences an increase in employment and population.
Factors associated with the natural resource curse can potentially affect the longer-term
growth process. For example, energy booms may lead to environmental degradation and
crowding that reduce quality of life. Likewise the quality of the local government may decline:
this may occur, for example, if the local government overbuilds infrastructure or is captured by
the industry in terms of its decision-making. Poor local government could reduce profits for the
the benefit of agglomeration economies, as industries gain critical mass. This would allow the
location to reach a greater long-run equilibrium level of population and employment (Michaels,
2011). Hence, it is an empirical question as to whether the long-run effects of energy
development are growth-inducing or growth-reducing (consistent with a resources curse
interpretation), but the short-run growth-inducing effects appear theoretically clear, though there
will likely be winners and losers across the regions and within regions. The opposite applies to a
region facing declines in energy development such as from a coal mine closure.
Several factors may slow the adjustment process or prevent spatial equilibrium from
occurring. First, individuals may have imperfect information about potential alternatives,
preventing utility-enhancing moves. This may occur extensively in isolated rural areas where
coal mining typically occurs. Secondly, individuals may lack the resources to relocate and credit
market imperfections may prevent individuals from moving to places that would offer higher
long-term utility. In terms of our study, if there are barriers to mobility, families may remain in
depressed coal mining regions, creating even higher unemployment, further depressing wages,
and increasing poverty rates.
5. Empirical Implementation and Data
We investigate how the intensity of coal mining affects different aspects of a locale’s economic
structure. Continental U.S. counties are our unit of observation. Coal employment’s share of total
employment in the beginning period is our measure of initial coal intensity. The analyses
reported in the tables focus on two time periods: the 1990-2000 period in which coal prices were
low; and the 2000-2010 period when coal prices were higher. In addition, we summarize results
for 1990-2010 to investigate the long term effects of coal. For each time period, we separate
counties within the Appalachian Regional Commission’s (ARC) borders from those in the rest of
the United States to assess whether coal mining affects outcomes differently in Appalachia.
Each economic outcome is a function of the county’s economic, demographic, and spatial
11" "
!"#$!%&=!!+!
!!"#$%+!!!!"#$%&'(+!!!!""#$%+!!!"#$%+!!!" +!!!"
(3)
where !"#$!%& is a set of economic outcomes that may be affected by coal mining. We
discuss the full list of dependent variables with detailed explanations and their sources below.
Our dependent variables for the decadal models (1990-2000 and 2000-2010) include
percent changes in per capita income, wage and salary income, median household income, rental
and investment income, population, accommodation employment, and retail employment. We
also use level-measures of poverty rate, employment/population ratio, disability/employment
ratio, and proprietors’ share of total employment. The long-term models (1990-2010) employ the
same set of dependent variables, except we use differences for the level variables (i.e. poverty,
employment/population, disability/employment, proprietors share). Per capita income, wage and
salary income, proprietors’ share of total employment, population, and rental income per capita
are from the Bureau of Economics Regional Data. Poverty and median household income
measures are from the U.S. Census Bureau’s Small Area Income and Poverty Estimates
(SAIPE). Population and demographic indicators are drawn from the US Census Bureau’s 1990
and 2000 decennial censuses and the 2010 American Community Survey 5-year estimates.
Disability indicators are from the Social Security Administration’s Old Age, Survivors, and
Disability Insurance Program (OASDI).
The explanatory variables are generally measured in the initial period in order to mitigate
problems of endogeneity. The !"#$% vector contains measures of the county’s industrial
structure. Initial mining industry employment shares, changes in mining employment shares over
the period, and a measure of relative demand shocks are included. We include mining sector
employment for coal, oil and natural gas, and other mining sectors; this allows us to draw broad
comparisons across mining sectors. Employment data are from a proprietary dataset purchased
from Economic Modeling Specialists International (EMSI) and include annual data between
1990 and 2010. The advantage of EMSI data is that employment data is disaggregated by 4-digit
benefit of distinguishing coal mining employment from other types of mining, such as oil and
gas drilling, gravel mining or metal mining, that are aggregated together in NAICS one-digit
industry codes. Previous studies typically rely on one-digit industry mining data, possibly
confounding the effects of coal mining with other mining types.
We create the total county coal mining employment share by dividing each county’s coal
mining employment by total county employment. Changes in employment shares are defined as
the difference between the share in time=2 and time=1.2 Employment share of oil and gas mining
and all other mining and their changes are also included in our models. Mining support
employment is a separate industry at the 4-digit NAICS level, however the category does not
distinguish between support for coal mining, oil and gas mining, or other mining. We add mining
support employment to each mining share by multiplying the number of county workers in
mining support by the national share of mining support from each mining industry as reported by
the Bureau of Labor Statistics.3
The demand shock variable is the predicted employment growth if all of the county’s
industries grew at their respective national growth rate, forming the industry mix term from shift
share analysis.4 The industry mix term is an exogenous measure of demand to account for shocks
that may be correlated with initial coal employment. The term is often used as an exogenous
instrumental variable in predicting local employment growth dating back to Bartik (1991).
A key economic control variable is the 1960 poverty rate provided by the USDA
Economic Research Service. This 1960 poverty rate measure accounts for legacy effects that
persist through our periods of analysis, effects that would include issues of governance, public
service delivery, industry composition, and culture. The 1960 poverty rate variable captures
""""""""""""""""""""""""""""""""""""""""""""""""""""""""""""" 2
"For instance, the coal mining employment share of Raleigh County, WV was 6.0 in 1990 and 3.3 in 2000, so the change in the coal employment share was -2.7."
3
"In 2010 the share of mining support employment devoted to coal mining support at the national level was 3%. For instance, if a county had 700 mining support workers, we added 21 workers (700 x 0.03=21) to that county’s coal employment totals. "
4
13" "
legacy effects of poverty to control for the extent to which coal mining itself is associated with
historical poverty rates. Thus, our coal employment share coefficients capture the more
contemporaneous effects of coal mining and would not reflect these (net) positive or negative
legacy effects.
The !"#$%&'( vector contains distance to the nearest metropolitan statistical area
(MSA), the weighted average poverty rate of adjacent counties, and incremental distances to the
nearest MSAs with populations of 250,000, 500,000, and 1 million.5 Most coal mining occurs in
remote rural areas and proximity to densely populated urban areas has been shown to be an
important positive factor in rural economic growth and poverty (Partridge and Rickman 2008).
Agglomeration influences economic development and growth though: better
employer-employee matching; dispersing infrastructure costs through input sharing; and knowledge
spillovers. We account for such affects with the !""#$% vector, which contains measures of
the nearest MSA population, total county population, MSA population, non-metro population,
and dummy variables controlling for whether the county is a core-city, big MSA, core-city small
MSA, suburban big MSA, or suburban small MSA following Partridge and Rickman (2008).
Demographic factors affect economic outcomes primarily through human capital development,
where places that have better educated workforces and higher proportions of working-age
population tend to have better economic outcomes. Thus, the !"#$% vector contains measures
of county age structure, education, race, place of birth, and family structure.
The coefficients !! −!! are vectors of regression coefficients, !!" are state fixed effects
of state i in time j, and !!" is the error term. For each time period/geography pair, we estimate
two specifications. First, we estimate a more parsimonious specification that does not include the
change in mining employment share variables. We then estimate models that include these
variables. Robust standard errors are estimated in all models.
One of our concerns in estimating the models is the potentially endogenous relationship
""""""""""""""""""""""""""""""""""""""""""""""""""""""""""""" 5
between coal mining employment and our outcome variables. If unobserved factors related to
coal mining affect the outcome variables, our estimates may be biased. This may be the case if
the coal industry targets places with dysfunctional or nonexistent regulatory structures, or
alternatively is welcomed by pro-business counties. In such a situation, we cannot observe
government quality, so if coal mining takes place in locations with dysfunctional government
(for example), and such government drives out other types of economic activity, our estimates
will suggest that coal mining has a more negative effect on economic outcomes than is actually
the case. Conversely, if the coal industry predominantly locates in places with well-functioning
business-friendly policies and such policies are attracting other businesses, then our results
would be more positive than the true coal mining effect. Using Ordinary Least Squares (OLS) to
estimate our models under such circumstances may lead to biased results.
To accommodate the existence of potentially important unobserved effects, we first use
the industry mix term to account for demand shocks that may be correlated with coal mining
shares and we also employ instrumental variables (IV) techniques. As potential instruments, we
use geological data from the United States Energy Information Agency (EIA) to create a set of
suitable instruments that should be correlated with coal mining intensity but only indirectly
affect economic outcomes through their relationship to coal mining intensity.6 We tested several
measures of coal quality and availability and found that the county average of the BTUs
produced per ton of ash created was the best predictor of its coal mining employment share. The
industry desires coal that produces higher BTUs with the least amount of ash (average county
BTUs per ton of ash), which is federally regulated. As described below, our instruments are
strong.
6. Results
The results of our analyses are presented in Tables 1-7. Each table follows the same format.
Results are presented for two dependent variables respectively for the 1990-2000 and 2000-2010 """""""""""""""""""""""""""""""""""""""""""""""""""""""""""""
6The data for our instruments come from USEIA’s annual Federal Energy Regulatory Commission 423 data which
contain information from each coal plant concerning quantity, quality, and source of coal used in electricity
15" "
periods and for both the ARC region and the rest of the U.S. We test two model specifications
for each sample. The first is more parsimonious while the second includes changes in
employment shares for each of the three mining categories. To condense our discussion, Tables
1-7 report only the coefficients of interest obtained from the fully-specified models that include
all independent variables denoted earlier.
Instrumental variables are used in all specifications. The first stage F-test of significance
produces values that are mostly in the 20 to 40 range for the instrument (BTUs per ton of ash).
Of the ten total specifications in our first stage regressions, for nine of them, the value of an
F-test of significance is above 10, a generally accepted threshold for strong instruments. In the one
instance where the F-value is less than 10 (7.59 for the full model in the 1990-2000 ARC
sample), we tested whether Limited Information Maximum Likelihood estimators performed
better; however, they did not produce significantly different results from the IV estimations,
suggesting that our results are robust (Angrist and Pishke, 2009).
Income Distribution Effects and Coal. We first determine whether mining employment is
associated with changes in per capita income and if so, whether the changes are primarily
through changes in average county wage rates which would suggest a more egalitarian impact.
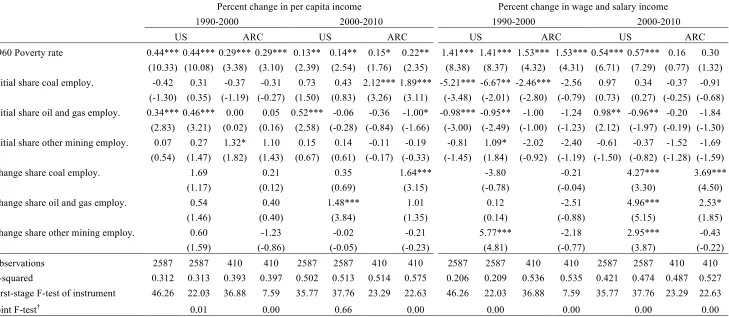
Table 1 presents the results for models of the percent change in per capita income and in wage
and salary income. Coal’s initial share of total employment is not statistically associated with
changes in per capita income from 1990-2000 in both the ARC region and the rest of the U.S.
Changes in coal employment shares over the decade are also not associated with changes in
county per capita income. The absence of an effect from initial coal employment share or growth
in coal employment share is persistent across the U.S. post-2000. However this is not the case for
the ARC region: here both the initial coal share and growth in coal employment share are
positively associated with the percent change in per capita income after 2000.
The right side of Table 1 shows how coal employment levels and changes are related to
wage and salary income. For both the rest of the U.S. and ARC samples, changes in coal
higher initial coal employment shares are negatively related to wage and salary growth in the
1990s. Thus, it appears that at least part of the positive income effect associated with coal
employment growth in the ARC region post-2000 seems to be coming through higher regional
wages associated with coal employment growth. This positive wage response may be due to
above-average wages in the industry or multiplier effects to other local industries. These results
suggest workers benefitted through higher wages during these boom years, although they had
previously lost ground when coal prices were weak in the 1990s.
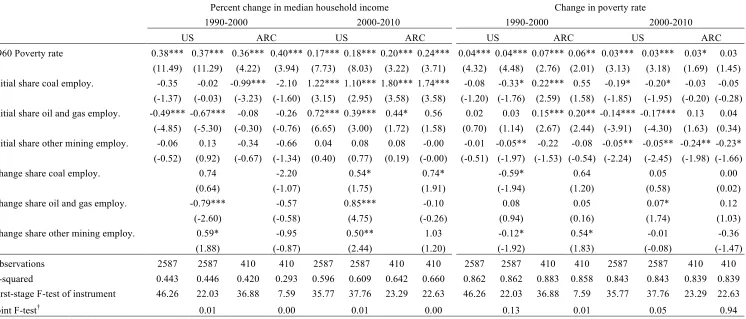
Next we determine the manner by which changes in coal employment affect households
at different points in the income distribution. Table 2 shows the determinants of changes in
median household income and poverty rates. We find no significant statistical association
between coal employment share or coal employment share growth and changes in median
household income in the rest of the U.S. in the 1990-2000 period. In the ARC region, initial coal
employment share is negative and highly statistically significant in the parsimonious model.
When we add the changes to mining shares in the subsequent model, statistical significance
disappears, although the coefficient for coal employment share remains negative and a joint
F-test shows the coal employment share and the change in coal employment share are jointly
significant. Middleclass households in the ARC region likely would have been hurt more during
the low-price decade of the 1990s as fewer coal employment opportunities would have existed
laid off coal workers. This association however is reversed post-2000, where initial coal
employment is positively associated with median household incomes in both the ARC region and
the rest of the U.S. Places with higher initial shares of coal employment and faster growth in coal
employment share manifesting increases in median household incomes. In sum, the high
coal-price decade post-2000 seems to have benefitted the middleclass possibly through wages (as
suggested by our wage models for the rest of the U.S. in Table 1) or by other indirect channels.
While middleclass households seem to have benefitted in places with higher initial shares
of coal employment and faster coal employment share growth post-2000, the results are mixed
17" "
employment share growth experienced lower poverty rates in the rest of the United States from
1990-2000. But this did not occur in the ARC: such places had higher poverty rates. The
coefficient on initial coal share in the ARC region is statistically significant in the parsimonious
model and the F-test suggests initial coal employment share and coal employment share growth
are jointly significant when the changes in mining shares are included. However, post-2000, the
positive link between poverty and coal employment share and coal employment share growth in
the ARC turns negative and the initial share is no longer statistically significant (in the
parsimonious model). Consistent with Partridge et al. (2013), this pattern suggests that either the
high coal-price decade post-2000 dampened some of the poverty-inducing effects of coal mining
or that other long-term, regional forces are weakening the poverty increasing effects of coal
mining in the ARC over time.
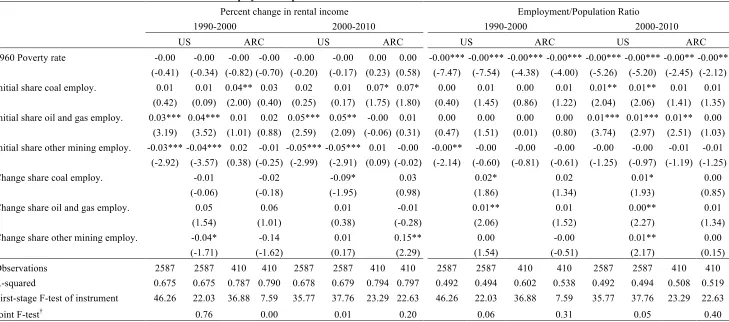
Table 3 presents the results for rental/investment income (left-side columns). These
models allow us to examine whether wealthier land/asset owners are impacted by coal
employment through rental/investment income. We find no evidence rental/investment income is
related to the initial coal employment shares or to coal employment growth in the rest of the U.S.
in the 1990s; however growth in the coal employment share is negatively associated with
rental/investment income in the post-2000 period. The ARC region differs in that the initial coal
employment share is significantly related to higher rental/investment incomes in the
parsimonious model in the 1990-2000 models and in both 2000-2010 models. Thus ARC
counties with high initial coal employment shares are associated with land/asset owners faring
better in both decades.
Overall our results suggest that coal intensity was related to a less egalitarian income
distribution in the 1990s, especially in the ARC region. By contrast during the boom period after
2000, coal intensity was associated with a neutral or more egalitarian distribution that reduced
poverty and increased incomes at the middle of the distribution. These findings do not yield
consistent conclusions about a potential natural resource curse in the ARC but rather demonstrate
Labor Market Consequences: Do Original Residents Benefit from Changes in Coal
Intensity? Economists have long debated whether job growth benefits local residents—especially
disadvantaged ones—or whether newly-created jobs go primarily to workers who have
in-migrated in-commuted in search of work. The answer is critical for understanding coal’s local
impact as to the degree to which expansions or contractions are felt locally. For example,
Blanchard and Katz (1992) find that there is an almost one-for-one migration response to overall
employment growth, suggesting original residents do not experience persistent employment
benefits from job growth. Those results were challenged by Bartik (1993), who found about
one-quarter of the new jobs went to original residents. More recently Partridge and Rickman (2006),
Rowthorn and Glyn (2006), and others find that in the long-term (about 7 years), approximately
80% of the new jobs go to migrants, whereas 20% of the jobs go to original residents.
To address this question for coal, we present results for the employment/population ratio
(emp/pop) in Table 3 (right-side columns). It should be kept in mind that the emp/pop ratio and
the coal share variables are both measured in the same units (ratios), meaning that a regression
coefficient of one indicates a one-for-one relationship between coal mining employment and the
emp/pop ratio. For the U.S., there is no statistically significant relationship between the initial
1990 coal mining share and the 2000 emp/pop rate, however there is a significant relationship for
the 2000 coal employment share and the 2010 emp/pop rate. But the economic significance of
the latter relationship is small. A one percentage point higher 2000 coal employment share is
associated with a 0.01 higher emp/pop rate suggesting a limited positive effect for the local labor
force. There is also a statistically significant positive association between the change in the coal
employment share and the emp/pop rate in both decades. The small regression coefficient
suggests that most of the jobs go to outside commuters, new residents, or that they are
reallocated to local workers who switched sectors. If anything, the ARC results suggest an even
weaker emp/pop response in which the coal mining variables have no statistically significant
effect in both decades. Thus, while some individuals are benefiting from the new employment
19" "
suggest that a transient workforce moves in and out of Appalachian coal towns in booms and
busts (Black et al. 2005a).
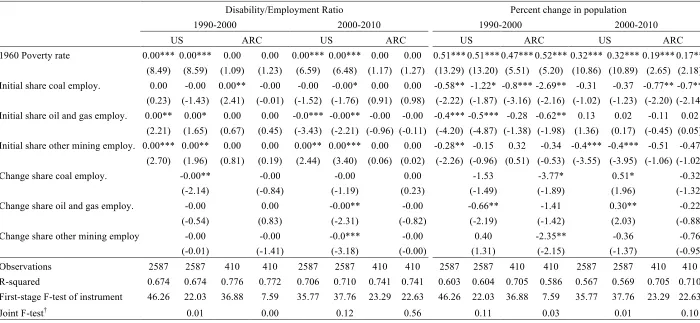
Labor-Market Consequences: The Disabled Population. To further examine the labor
market consequences of coal, Table 4 reports results using the 2000 and 2010 ratio of the
disabled to total employed. Certainly coal mining (especially underground mining) is a
dangerous vocation with consequences such as black lung disease that can spur individuals to go
onto disability or to permanently exit the labor force. To the extent that coal mining intensity
increases disability, it reduces labor market flexibility. Moreover, disability entails costly social
programs. For the rest of the U.S. in both decades, coal mining tends to be associated with a
lower disability/employment ratio. In Appalachia during the 1990s, a larger initial coal
employment share is associated with a higher disability ratio, but the coal variables are
statistically insignificant in the post-2000 models. While future research is needed to more fully
flush out these findings, it appears that the demographic composition of the workforce itself
increasingly drives disability rather than the intensity of coal mining.
Population Growth and Coal. To further examine who benefits from the size and growth
of the coal industry, Table 4 presents the results the percentage change in population. For both
the U.S. and ARC, population growth is strongly inversely associated with the initial 1990 coal
employment share. The change in coal employment share variable is negative but statistically
insignificant in the U.S. model and negative and statistically significant in the ARC model. Since
the coal industry was generally in decline in the 1990s, these results suggest that people were
fleeing places with a high-intensity of coal production and for the ARC region, people were more
prone to stay in locations with a declining coal industry.
The 2000-2010 population growth models suggest that the initial coal employment share
is no longer statistically significant for the rest of the US, while the change in 2000-2010 coal
employment share is now positive and statistically significant. This change may relate to the
relatively strong market for coal during the decade. Likewise, regulatory changes and better
with coal mining in the post-2000 period. Despite the strength of coal market, ARC locations
with greater initial 2000 coal employment shares continued to suffer statistically significant
population losses, although the change in coal share is not significant here.
Our results for population growth in conjunction with those for emp/pop (from Table 3)
have key implications for labor market processes. The 1990-2000 population results suggest that
residents of coal intensive places either do not wish to remain in those locations—perhaps due to
the negative externalities associated with coal or to views that the long-run prospects in coal
mining communities are bleak.7 Likewise, the negative association between coal mining and
population growth in the 1990s as well as the small association between coal mining and
emp/pop rates suggest that changes in coal mining employment were almost identically offset by
changes in commuting and in employment in other local sectors, indicating that coal was not an
economic engine of growth in the 1990s especially in Appalachia. Between 2000 and 2010, this
pattern modestly reversed in the rest of the U.S. as a larger local coal industry became associated
with higher emp/pop; however for Appalachia, the patterns of the 1990s continued though in
somewhat weakened form. One possible reason for the different labor market response may be
that ARC coal country residents believed the prosperity of the coal industry in the 2000-10
period to be temporary given the industry’s long-term, protracted employment decline.
Coal’s Relationship to Other Local Industries and Entrepreneurship. A common but
under-researched question is the degree to which coal mining influences other local industries.
For example, one of the hypothesized channels through which the natural resource curse operates
is by crowding out other productive activities or industries. Alternatively, mining jobs create
employment multipliers that increase employment in unrelated industries, such as retail, through
the income spent locally by coal workers. We examine whether initial coal employment share or
coal employment share growth are correlated with the percent change in tourism/accommodation
employment (NAICS sector 72) or retail employment (NAICS sectors 44-45) to assess these
"""""""""""""""""""""""""""""""""""""""""""""""""""""""""""""
7
21" "
effects. Coal mining is environmentally invasive and may discourage outdoor recreational and
tourist activity, while relatively high-paying mining jobs could support local retail.
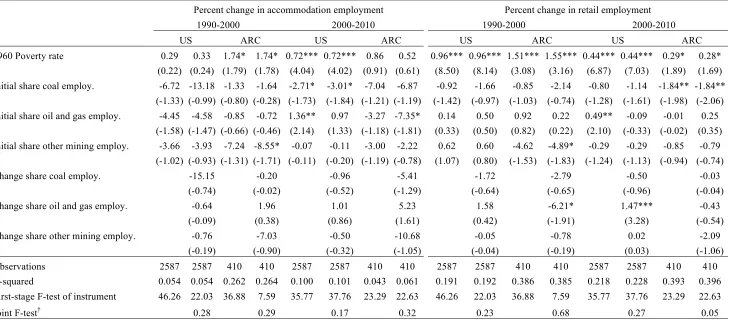
Results from Table 5 show no statistically significant relationships for coal employment
share levels or growth and changes in accommodation employment for both the rest of the US
and ARC region during the 1990s. Post-2000, there is a statistically significant negative
relationship between percent change in accommodation employment and the initial share coal
employment share in the rest of the U.S., but the relationship is not statistically significant for the
ARC sample. For the rest of the U.S., this may suggest that tourists avoid places where coal
mining is prevalent or that the more prosperous (post-2000) coal mining industry crowded out
accommodation employment. It is unclear, however, why this relationship does not apply in the
case of the ARC region, although one reason may be that its coal communities have a relatively
small tourist industry to begin with.
For retail employment, the initial coal employment share is not significant in the
1990-2000 models for the U.S. and the ARC region. But a rising share of coal employment is
associated with less retail employment in the ARC region. For the 2000-2010 models, the change
in the coal employment share is positively associated with rising retail employment growth for
the U.S. But for the ARC region, the initial coal employment share is inversely associated with
retail employment growth. Overall, coal employment is either not associated or positively
associated with retail employment in the U.S., possibly suggesting some modest positive local
spillovers. The negative association found for the ARC may be related to wide-spread population
declines in places where coal mining is prevalent and positive multiplier effects may be modest.
Finally in unreported results, we examined manufacturing employment growth because
another possible natural resource curse avenue is that mining booms increase wages that make
local traded goods production less competitive. We found no statistical relationship between
manufacturing employment growth and coal employment in any of the US and ARC models,
suggesting that on net, coal neither crowds out nor stimulates (on net) local manufacturing.
the role of small business formation and entrepreneurship. The link between entrepreneurship
and economic growth is intuitive, as entrepreneurs are innovative risk-takers and create
employment opportunities. For example, Chinitz (1961) famously compared New York’s
entrepreneurial garment industry to Pittsburgh’s large corporate steel industry. More recently,
this hypothesis has been supported in a number of empirical studies (Glaeser et al. 1992; Glaeser
et al. 2010; Glaeser et al. 2012), as has the hypothesis that small business development supports
local growth (Loveridge and Nizalov, 2007). Researchers use a number of proxies for
entrepreneurship, including the rate of self-employment and proprietors. In the case of
Appalachia, Stephens and Partridge (2011) find that the self-employment rate is positively
associated with employment and income growth. Glaeser et al. (2012) find that close proximity
to a coal mine in Appalachia crowds out entrepreneurship (as measured by self-employment
rates), suggesting that coal mining intensity reduces the long-term growth prospects by crowding
out entrepreneurs and small businesses. They argue that access to a large employer reduces
individuals’ willingness to start their own businesses.
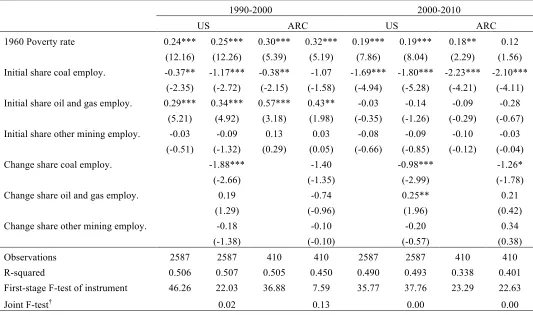
Against this backdrop, Table 6 presents the results for the proprietor’s share of total
employment as the dependent variable.8 The initial share of coal employment is negatively and
significantly related to proprietor’s share of total employment with one exception--when the
change in the coal employment share is added to the 1990-2000 ARC model. The negative
relationship is larger in the rest of the U.S. during the 1990s. The effect is also larger in the
post-2000 for both the ARC and the rest of the US post-post-2000, suggesting a stronger “crowding-out”
effect when higher coal prices persist, which would have possible negative implications for
subsequent growth after the boom. Change in coal employment share is also statistically
significant and negatively associated with proprietor’s employment share in all models except
the ARC region for 1990-2000, where it is insignificant. These results suggest one avenue by
which coal could set off a natural resource curse—by restraining the entrepreneurial spirits and
"""""""""""""""""""""""""""""""""""""""""""""""""""""""""""""
8
23"
"
small business start-ups.9
Comparison to Oil and Gas and Other Mining. Oil and gas exploration and production
are key energy industries and natural gas is a close competitor with coal. However, their local
economic development implications differ from those of coal. Overall coal mining has more
steady direct short- and long-term economic effects at a mine site. Oil and natural gas
exploration have more variable impacts that start with a heady construction phase of building rig
sites, roads, and related infrastructure such as pipelines, which then greatly slows even as
production remains quite high. Another feature is the potential for large lease and royalty
payments to landowners; these payments could significantly increase per capita income in oil
and natural gas regions but they may not trickle down to raise local wages and median household
incomes. To explain the results of our analyses, we summarize key similarities between coal and
oil-natural gas treating common features of energy development and also note differences related
to their distinct timelines of development.
It is not surprising that when considering the initial employment shares and the change in
employment shares, oil and gas employment are more positively linked to higher per capita
income growth than is coal employment for the rest of the U.S., given that oil and natural gas
exploration is associated with large royalty and lease payments. Yet, surprisingly there is little
statistical link between oil and natural gas intensity and income in the ARC region.10 Likewise,
the marginal response of wage and salary income tends to be greater for oil and natural gas
employment than for coal employment for the rest of the U.S. but not in the ARC. This pattern is
not as clear for changes in median household income and changes in poverty rates. Nor are clear
""""""""""""""""""""""""""""""""""""""""""""""""""""""""""""" 9
We also examined whether coal mining is associated with the county’s skill distribution by examining the percent of the adult population with at least a high school degree and the percent of the population with a college degree. Generally the coal results were statistically insignificant (not reported). The only exceptions were that the ARC high school graduate share is inversely associated with the coal share and the US high school graduate share is inversely associated with the college graduate share during the 2000-2010 period. In general, we find only weak evidence that
contemporary coal mining is associated with lower educational attainment. ""
10
One concern about this comparison is that the location of oil and gas production may be endogenous like coal. Yet, there are reasons to believe that it is more exogenous, especially post 2000. Specifically, the advent of new hydraulic fracturing innovations that has driven growth in the oil and natural gas sector could not have been foreseen by
differences in how the two energy sectors affect the emp/pop ratio. Our findings show that coal
employment is more negatively associated with population growth relative to gas and oil. Unlike
the negative association between coal mining and the proprietor employment share, the oil and
gas share had a positive association in the 1990s and no significant association over the
2000-2010 period. Thus, in the longer-run, it appears that oil and natural gas does not reduce small
business development nor dampen entrepreneurship as appears to have occurred in the case of
coal mining.
Long-term Models: 1990-2010. To evaluate the robustness of our previous models and
improve understanding of the long-term effects of coal mining, we estimate models that
encompass the change from 1990-2010. These models are useful in assessing whether the
long-term impacts of coal mining employment are obscured because we separate our analyses into the
bust decade of the 1990s and the boom decade post-2000. The results are omitted to condense
text but we summarize noteworthy trends. First, the initial share of coal mining appears to be
associated with a more equal income distribution for the rest of the U.S. when considering
growth in per capita income, average wages, and median household income, and poverty rates
over the entire 1990-2010 period. However, for the ARC region, there is no clear link between
coal and the aforementioned outcomes. Both the growth of coal mining employment share and
the initial coal mining share are strongly related to declining population in the ARC region, but
not for the rest of the U.S. The initial U.S. coal mining share is inversely associated with both
employment in retail and the accommodation industry, suggesting some crowding out; however
this was not statistically significant for the ARC region.
Perhaps more importantly for long-run growth, both the change of the coal mining share
and the initial coal employment share are inversely associated with the share of self-employment
in localities. Thus, in the long-run, any natural resource curse effects of coal mining would
appear to be linked to lower entrepreneurship and reduced small business development. Overall,
we do not detect clear resource-curse effects aside from the boom-bust effects often expected
25" "
a contemporary resource-curse effect that emerges indirectly through factors such as reduced
entrepreneurship among local populations.
7. Conclusion
This study takes a new look at the impacts of coal employment. We respond to current gaps in
research and address emerging concerns brought about by the global energy revolution and
climate change regulations. A unique feature of this study is the use of novel instruments to
account for unobservable factors that may bias the statistical association between coal mining
and economic outcomes. We also examine the effects of coal mining employment on a wide
range of economic indicators including those that have received scant empirical attention and
where speculation as to the direction of effects remains. We address both the bust period of the
1990s and a boom period of 2000-2010 in order to assess the differential impacts across different
points in the coal mining cycle. Effects in the Appalachian Regional Commission area are
contrasted with the rest of the United States because coal mining in the ARC region has been
often associated with negative economic outcomes.
In updating research on the coal industry to the present period, we find that its largest
effects tend to occur through its boom/bust features. Coal employment is generally associated
with more positive (or less negative) effects in the post-2000 boom period relative to the 1990s,
these results generally holding for both Appalachia and the rest of the U.S. Nevertheless, in both
the boom and bust period, ARC counties tended to fare worse on economic indicators relative to
other U.S. counties. Appalachia does not appear to be among the regional winners in the present
energy revolution and the results suggest that climate change regulations that limit coal usage
may have disproportionate negative effects on coal communities, at least in the short term.
Researchers continue to assess whether the natural resource curse remains applicable in
modern economies. Extending this question to the subnational level, we do not find clear
evidence of a resource curse across coal intensive communities today. However, our study
indicates that future research remains needed given the results for some indicators such as
By analyzing a relatively extensive array of economic indicators, a unique aspect of our
study is to identify not only variations across places but also whether different population
segments within places gain and lose. For the ARC region, coal mining does not appear to
engender the same benefits to lower and middle-income households as it does in the rest of the
United States. One explanation for this may be connected to the region’s long-standing
dependence on the coal industry. Coal industry interests may be stronger in the ARC region,
leading to a larger proportion of benefits flowing to mine owners rather than mine workers and
the local population, though an another explanation relates more to average worker skills.
Finally, by assessing an array of indicators, our study contributes to a more nuanced
understanding of the impacts of coal, documenting relationships beyond those examined in much
previous research. For the ARC region, over the entirety of the boom/bust cycle, we find that
coal employment is positively associated with changes in per capita income and the
employment/population ratio. But coal is negatively associated with changes in population and
entrepreneurship. An important implication is that although increased coal employment may
have short-term aggregate employment benefits for remote Appalachian communities, it appears
that higher shares of coal employment are associated with deleterious effects in the long run
through driving out population and dampening local entrepreneurship. However, the most
consistent impact of coal intensity appears attributable to the boom/bust process where the
27" "
References
Angrist, J. D., & Pischke, J. (2009). Mostly Harmless Economics, An Empiricist’s Companion.
Princeton, NJ: Princeton University Press.
Bartik, T.J. 1991. Who Benefits from State and Local Economic Development Policies?
Kalamazoo, MI.: W. E. Upjohn Institute for Employment Research.
---. 1993. “Who Benefits from Local Job Growth: Migrants or the Original Residents?” Regional
Studies. 27: 297-311.
Black, D., K. Daniel, and S. Sanders. 2002. “The Impact of Economic Conditions on
Participation in Disability Programs: Evidence from the Coal Boom and Bust.” The American
Economic Review 91:27-50.
Black, D., T. McKinnish, and S. Sanders. 2003. “Does the availability of high-wage jobs for low-skilled men affect welfare expenditures? Evidence from shocks to the steel and coal industries.” Journal of Public Economics 87:1921-1942.
---. 2005a. “The Economic Impact of the Coal Boom and Bust.” The Economic Journal
155:449-476.
---. 2005b. “Tight Labor Markets and the Demand for Education: Evidence from the Coal Boom and Bust.” Industrial and Labor Relations Review 59: 3-16.
Blanchard, O.J., and L.F. Katz. 1992. “Regional Evolutions.” Brookings Papers on Economic
Activity. 1:1-61.
Brown, Jason. 2014. “Production of Natural Gas From Shale in Local Economies: A Resource
Blessing or Curse?” Economic Review. Available at: www.kansascityfed.org. [downloaded
January 21, 2014].
Chinitz, B. 1961. “Contrasts in Agglomeration: New York and Pittsburgh.” The American
Economic Review. 51:279-289.
Corden, W.M. 1984. “Booming Sector and Dutch Disease Economics: Survey and
Consolidation.” Oxford Economic Papers. 36:359-380.
Deaton, J.B., and E. Niman. 2012. “An empirical examination of the relationship between
mining employment and poverty in the Appalachian region.” Applied Economics 44:303-312.
Douglas, S.M. and A.W. Walker. 2012. “Sample Selection in Appalachian Research.” Review of
Regional Studies 42: 143-159.
Freeman, D.G. 2009. “The ‘Resource Curse’ and regional US development.” Applied Economic
Letters 16:527-530.
Research Working Paper #13696.
Glaeser, E.L., H.D. Kallal, J.A. Scheinkman, and A. Shleifer. 1992. “Growth in Cities.” Journal
of Political Economy. 100:1126-1152.
Glaeser, E.L., S.P. Kerr, and W.R. Kerr. 2012. “Entrepreneurship and Urban Growth: An Empirical Assessment with Historical Mines.” Working paper, National Bureau of Economic Research. NBER #18333. Cambridge, MA.
Glaeser, E.L., W.R. Kerr, and G.A.M. Ponzetto. 2010. “Clusters of entrepreneurship.” Journal of
Urban Economics. 67:150-168.
Haggerty, Julia, Patricia H. Gude, Mark Delorey, and Ray Rasker. Forthcoming. “Long-term
effects of income specialization in oil and gas extraction: the U.S. West, 1980-2011.” Energy
Economics.
James, A., and D. Aadland. 2011. “The curse of natural resources: An empirical investigation of
U.S. counties.” Resource and Energy Economics 33:440-453.
Krugman, Paul. 1991. “Increasing Returns and Economic Geography”. Journal of Political
Economy, 99: 483-499.
Loveridge, S. and D. Nizalov. 2007. “Operationalizing the entrepreneurial pipeline theory: An
empirical assessment of the optimal size distribution of local firms.” Economic Development
Quarterly 24: 244–262.
Marchand, J. 2012. “Local labor market impacts of energy boom-bust-boom in Western
Canada.” Journal of Urban Economics 71:165-174.
Michaels, G. 2011. “The Long Term Consequences of Resource-Based Specialization.” The
Economic Journal 121:31-57.
Papyrakis, E., and R. Gerlagh. 2007. “Resource abundance and economic growth in the United
States.” European Economic Review 51:1011-1039.
Partridge, M.D., M.R. Betz, and L. Lobao. 2013. “Natural Resource Curse and Poverty in
Appalachian America.” American Journal of Agricultural Economics. 95:449-456.
Partridge, M.D., and D.S. Rickman. 2006. “An SVAR model of fluctuations in US migration
flows and state labor market dynamics.” Southern Economic Journal. 72:958-980.
Partridge, M.D., and D.S. Rickman. 2008. “Distance from urban agglomeration economies and
rural poverty.” Journal of Regional Science. 48:285-310.
Partridge, M.D., Rickman, D.S., Ali, K., Olfert, M.R. (2008) “Lost in Space: Population
Dynamics in the American Hinterlands and Small Cities.” Journal of Economic Geography, 8:
727-757.
29" "
Mexico.” Journal of Economic Issues 95(2):511-525.
Rowthorn, R., and A. Glyn. 2006. “Convergence and Stability in U.S. Employment Rates.” Contributions to Macroeconomics. 6:1-43.
Sachs, J. D., and A. M. Warner. 1995. “Natural Resource Abundance and Economic Growth.” Working paper, National Bureau of Economic Research. NBER #5398. Cambridge, MA.
--- . 2001. “The curse of natural resources.” European Economic Review. 45:827-838.
Stephens, H.M., and M.D. Partridge. 2011. “Do Entrepreneurs Enhance Economic Growth in Lagging Regions?” Growth and Change. 42:431-465.
(EIA) U.S. Energy Information Agency. 1999. Annual Energy Outlook 2000 With Projections to 2020. Available at: http://www.eia.gov/forecasts/aeo/archive.cfm. (downloaded January 15, 2014).
(EIA) U.S. Energy Information Agency. 2005. Annual Energy Outlook 2005. Available at: http://www.eia.gov/forecasts/aeo/archive.cfm. (downloaded January 15, 2014).
(EIA) U.S. Energy Information Agency. 2013. Annual Energy Outlook 2014 Early Release. Available at: "http://www.eia.gov/forecasts/aeo/er/index.cfm. (downloaded January 15, 2014).
(EIA) U.S. Energy Information Agency. 2014. “U.S. Coal Supply, Consumption, and Inventories.” EIA Short-Term Energy Forecasts (January 7, 2014). Available at:
http://www.eia.gov/forecasts/steo/tables/?tableNumber=18#. (downloaded January 15, 2014).
Van der Ploeg, F. 2011. “Natural Resources: Curse or Blessing?” Journal of Economic Literature. 49:366-420.
Weber, J.G. 2012. “The effects of a natural gas boom on employment and income in Colorado, Texas and Wyoming.” Energy Economics 34:1580-1588.
Weinstein, Amanda and Mark Partridge (Dec, 2011). “The Economic Value of Shale Natural Gas in Ohio.” The Swank Program in Rural-Urban Policy Summary and Report. Available at: http://aede.osu.edu/about-us/publications/economics-value-shale-natural-gas-ohio-0.
0" 100" 200" 300" 400" 500" 600"
1948" 1950" 1952" 1954" 1956" 1958" 1960" 1962" 1964" 1966" 1968" 1970" 1972" 1974" 1976" 1978" 1980" 1982" 1984" 1986" 1988" 1990" 1992" 1994" 1996" 1998" 2000" 2002" 2004" 2006" 2008" 2010" 2012"
E
MP
LO
Y
E
E
S
"(
T
HO
U
S
A
N
D
S
)"
Figure"1."Coal"Mining"G"Employment"(1948G2012)"
Coal"mining"(BEA)" Coal"mining"(BLS)" Support"acNviNes"for"coal"mining"(BLS)"
Sources:"