in Rhesus Macaque Monkeys
Thesis by David J. Dubowitz
In Partial Fulfillment orthe Requirements for the Degree of
Doctor of Philosophy
California Institute of Technology Pasadena, California
2002
Abstract
Dedication
A
cknowledgments
If [ have seellfarther thall others. it is because [ was stallding all the shoulders of giants. - Sir Isaac Newton (1642-1727)
This thesis is a testimony to the teaching, encouragement and support of many colleagues. I am especially grateful to my advisor, Richard Andersen, who provided me with the 0ppoI1unity, the resources and the guidance to do this work. None of this would have been possible without the unerring support of Bill Bradley, who saw a future for this research when many doubted it. I am also indebted to the other members of my thesis committee: Scott Fraser, Shinsuke Shimojo, Mark Konishi and Joel Burdick.
It has been my good fortune to work with many talented scientists in the field of MRJ. [
am particularly grateful to Dennis Atkinson, Rick Buxton, Eric Wong, Mike Tyszka, Eric Ahrens, Russ Jacobs and Dar- Yeong Chen from whom I have profited immensely.
My understanding of electrophysiology, neuroanatomy and the idiosyncrasies of primate
behavior was enriched by close collaboration with John Allman, Betty Gillikin, Kelsie Weaver, Bradley Greger and John Pezaris. I am grateful to many other members of the Andersen Lab who gave freely of their time, but in particular, Cierina Marks and Viktor Shcherbatyuk.
Conte
nts
Abstract
Dedication
Acknowledgments
Chapter 1 Introduction 1.1 Background 1.2 Overview 1.3 References
Chapter 2 Magnetic Resonance Imaging in Macaque Cortex 2.1 Abstract
2.2 Introduction
2.3 Materials and Methods 2.3.1 Animal Model 2.3.2 Stimulus
2.3.3 Surgical Technique and Experimental Setup 2.3.4 MR System
2.3.5 [mage Processing 2.4 Results
2.5 Discussion 2.6 Conclusion
2.7 References 2.8 Acknowledgment
Chapter 3 Direct Comparison of Visual Cortex Activation in Human Nonhuman Primates Using Functional Magnetic Resonance Imaging 3.1 Abstract
3.2 Introduction
3.3 Materials and Methods 3.3.1 Experimental Setup
3.3.1.1 Animal Studies 3.3.1.2 Human Studies 3.3.2 Choice of Stimulus 3.3.3 Stimulus Paradigm 3.3.4 MR System
3.3.5 Image Post-Processing 3.4 Results
3.5 Discussion 3.6 Conclusion 3.7 References 3.8 Acknowledgment
and
Chapter 4 Enhancing fMRI Contrast in Awake-behaving Primates Using Intravascular Magnetite Dextran Nanoparticles
4.1 Abstract
4.2 Introduction
4.3 Materials and Method 4.3.1 Animal Subjects 4.3.2 Contrast Agent 4.3.3 MR Imaging 4.3.4 Stimulus Paradigm 4.3.5 Image Post-processing 4.4 Results
4.5 Discussion 4.6 Conclusion 4.7 References 4.8 Acknowledgment
Chapter 5 Peripheral Somatosensory fMRl in Mouse at 11.7 T 5.1 Abstract
5.2 Introduction 5.3 Experimental
5.3.1 MRM Instrumentation
5.3.2 MR Relaxation Times in the In Vivo Mouse Brain
59 61 61 63 63 64 65
69
71 77 77 80 81 81 82 84 84 85 5.3.3 Characterizing BOLD Contrast by Modulation of Inspired Oxygen Tension5.3.4 fMRI 5.4 Results
5.4.1 MR Relaxation Times in the In Vivo Mouse Brain
5.4.2 BOLD Contrast by Modulation of Oxygen Tension 5.4.3 fMRI
5.5 Discussion
5.5.1 Relaxation Times
5.5.2 Modulation of Oxygen Tension 5.5.3 fMRI
5.6 Conclusions 5.7 References 5.8 Acknowledgment
Appendix A Improving Behavioral Control in Monkey tMRJ Studies A.I Headpost Design
A.2 Behavioral Training / Reward A.3 Eye-tracking Design
A.4 References
Appendix B Towards Combined Functional Magnetic Resonance Imaging and Electrophysiology
B. I Frameless Stereotaxic Alignment of MR Images
B.2 Co-registration of Electrophysiology Recordings and MRI B.3 References
B.4 Acknowledgment
Appendix C List of Abbreviations
L
ist of Figures
Figure 2.1 Monkey within the MRI scanner. 12
Figure 2.2 Animated visual stimulus. 13
Figure 2.3 Monkey's headcap and head post. 15
Figure 2.4 fM RI activation map. 21
Figure 2.5 fMRI signal for three different voxel sizes. 23 Figure 3.1 Monkey in a sphinx position within the MR scanner. 31 Figure 3.2 fMRI of macaque visual cortex. 43
Figure 3.3 fM Rl of human visual cortex. 44
Figure A.7 tMRl of drinking artifact. 116
Figure A.8 Training rig for monkey functional MRI. 117
Figure A.9 Sixteen-core fiberoptic eye illuminator. 119
Figure A.tO Eye illumination ofa human subject using the fiberoptic bundle. 120 Figure A.tt Co-mounted mirrors for human eye-tracking inside the MRI scanner. 121 Figure A.12 Details of co-mounted mirrors and fiberoptic illuminator. 121 Figure A.13 Design using direct illumination with four LED's. 122
Figure A.14 Ring arrangement of infrared LED's for homogeneous illumination. 123
Figure A.1 5 Homogeneous illumination of a monkey eye during fixation. 123
Figure B.1 Reid's plane indicated on MRl and on a monkey skull. 127
Figure B.2 X-ray and skull base showing meatal barsofthe stereotaxic frame. 128
Figure B.3 Fiducial markers for assessing stereotaxic measurements. 128 Figure B.4 Error in measurement between stereotaxic frame and MRI. 129 Figure B.5 MRI of macaque brain in stereotaxic co-ordinates. 130 Figure B.6 Co-ordinate frame for MRl positioning of electrodes. 131
Figure 8.7 Co-aligning of electrode position and MR images. 132
Figure B.8 Orange phantom and gadolinium-filled chamber and cap. 133
Figure B.9 Improved design of chamber cap. 134
Lis
t of Table
s
Table 2.1 Signal-to-noise measurements for three standard RF coils. 19 Table 2.2 TI and T 2 values for macaque brain. 19 Table 3.1 Summary of MRl sequence parameters for monkey and human studies. 36
1.1
Backgrounddescribe this effect on MRJ. Most imaging sequences for conventional MRJ are designed to minimize the effects of bulk magnetic susceptibility. To observe the changes in deoxyhemoglobin, imaging sequences need to be particularly sensitive to perturbations in magnetic susceptibility. These susceptibility effects are exaggerated at high magnetic field or by using gradient echo imaging techniques, particularly, "fast" gradient echo techniques. Since the first description of functional MRI, a large number of
susceptibility-weighted Imagll1g sequences have been proposed. These imaging
sequences are also inherently sensitive to susceptibility artifacts unrelated to the hemodynamic changes (e.g., at tissue interfaces between bone, water, fat or air), thus the choice of sequence is frequently an empirical one, as is its optimization for a particular need. The same is true when optimizing sequences for monkey imaging. This thesis describes a series of studies to develop functional MRJ as a neuroscience tool for studying macaque monkeys.
1.2
OverviewMost of our understanding about the primate brain comes from half a century of investigation 111 monkeys. Findings from lower primates have been extrapolated to
attempt to explain the workings of the human brain. Invasive studies of the human brain
in nonnal human volunteers. The advent of functional MRl, hailed a safe, reproducible,
noninvasive tool with which to study the human brain. To bridge the gap between
neurophysiological studies (in monkeys) and imaging studies (in humans) we need an
intermediate step. This is where there is a specific need for functional imaging studies in
monkeys to allow direct comparison with similar imaging studies in humans, and to allow
direct comparison with invasive neurophysiology studies in monkeys. Chapters 2-5 describe studies I performed in developing functional MRl in monkeys. These 4 chapters
have been published in peer reviewed joumals6-9. This thesis also contains three
appendices. The appendices are unpublished work, but parts have appeared in conference proceedings 10,11.
Chapter 2 outlines many of the technical difficulties in usmg a conventional clinical
scanner for imaging monkeys. This was the first demonstration of stimulus-correlated
functional magnetic resonance activation in a macaque monkey. This was significant as previous studies in anesthetized animals had suggested the BOLD signal would be too
small for useful functional MRl in monkeys at 1.5 T. There is significantly larger BOLD signal in the absence of anesthetic agents. Prior to this paper, all animal imaging had been
done in unconscious animals. This paper showed that the functional MRl was indeed
possible in an awake animal. It also demonstrated that a monkey could be acclimated to the MRl environment. In pal1icular that useful maps of functional brain activation could be achieved with the monkey in a prone "sphinx" position, obviating the need for him to be sitting upright (as was the conventional wisdom). While this imposes some constraints
so readily able to move them in response to a stimulus), the setup is excellent for studies of visual cortex. This paper provided optimization strategies for both the RF hardware and the imaging pulse sequences for ensuring maximum signal-to-noise ratio (SNR) for monkey imaging.
The third chapter addresses the strength of functional MRI as a noninvasive technique to compare patterns of cortical activation in humans and in nonhuman primates. One of the strengths of functional MRI in monkeys will be to integrate patterns of functional MR activation with the underlying neuronal firing. To bridge the gap between fMRl in humans and direct electrophysiological recordings of neuronal activation in monkeys, we face two challenges. Firstly, we are comparing two very different techniques in terms of
their spatial and temporal capabilities, and in terms of the physiological parameters that they are sensitive to. We are also comparing across two different species. This chapter addresses the second part where we compare patterns of functional activation using identical techniques, but in two different species. This paper described the first study of visual cortex activation across species using functional MRl. Using an animated cartoon movie as a visual stimulus, homologous areas of activation are demonstrated in both human and monkey visual cortex.
or better than the level of the cortical column. The cortical column is the building-block of cerebral architecture. All neurons within a cortical column share common features in terms of tuning, specialization, and function. Thus, imaging at resolutions that are worse than a single column will tend to superimpose the activation from many differing neurons and the signal becomes less coherent. Imaging a single cortical column is a good representation of the activity of individual neurons within the column. In practical ternlS
this requires a resolution of about 200 Ilm. This dimension is an order of magnitude smaller than typical fMRJ studies at 1.5 T (and the 3-dimensional imaging voxel needs to be three orders of magnitude smaller). An improvement in voxel resolution requires a
similar improvement in SNR. Increasing the number of measurements is one approach to increasing SNR; however using conventional BOLD imaging at 1.5 T would require 6 orders of magnitude increase in imaging times to preserve the SNR per voxel. A five-minute study would take more than 10 years (not a practical solution for awake animal imaging). The use of dedicated surface coils and low noise amplifiers goes a long way to increasing the available signal. Other strategies are to address alternate contrast mechanisms to BOLD or to use a much higher applied magnetic field.
The fifth chapter investigates the viability of functional MRl at very high static magnetic field. This is a study of functional MRl at 11.7T - an order of magnitude increase in static magnetic field over conventional clinical imaging, and allows imaging resolution for tMRI of 180 pm (i.e. sufficient for cortical column functional MRI). Engineering constraints limit the size of the MR scanner at this magnetic field strength. These studies were performed using a vertical MR scanner with a usable bore of 30 mm. The animal model for this study was a mouse, using a somatosensory stimulus to the hind paw. These studies represent the first fMRl measurements at this very high magnetic field strength, as well as the first successful fMRl studies in mice.
Appendices A and B outline some of technical developments necessary for the studies in chapters 2--4. To ensure that the neuronal activity recorded in an electrophysiology setup is the same as that producing functional MRl activation measured during an MRI experiment, it is necessary to carefully control both the stimulus as well as the behavioral response of the animal. A number of technological developments were needed to keep the animal immobilized in the scanner, to check appropriate responses (in this, case eye position), and to reward the animal while in the MR scanner. The materials and devices specifically designed to achieve this are presented in Appendix A.
animal under the same experimental and behavioral conditions. There are two approaches to this. One is to make simultaneous electrophysiology and fMRJ measurements while the animal is in the MR scanner. This is technologically very challenging as the material requirements for the two techniques are very different. Functional MRI is very sensitive to gross magnetic susceptibility artifacts introduced by external devices, for example, recording electrodes. Similarly, electrophysiology recordings are best achieved in an electrically and magnetically shielded environment, rather than in the presence of strong oscillating magnetic fields and eddy currents found inside an MR scanner. The second approach is to perform both investigations separately in their own optimum environments. For the data to be comparable, the two studies must be accurately co-registered. Appendix B outlines the techniques I developed specifically for this.
Appendix C lists the abbreviations used in this thesis.
1.3
ReferencesI. Pauling, L. and Coryell, C. D. The magnetic properties and structure of hemoglobin, oxyhemoglobin and carbonmonoxyhemoglobin. Proc. Natl. Acad. Sci. USA 22,210-216 (1936).
3. Bradley, W. G., Jr. MR appearance of hemorrhage in the brain. Radiology ]89, 15-26. (1993).
4. Ogawa, S., Lee, T. M., Kay, A. R. and Tank, D. W. Brain magnetic resonance imaging with contrast dependent on blood oxygenation. Proc. Nat!. Acad. Sci. USA 87, 9868-9872 (1990).
5. Fox, P. T. and Raichle, M. E. Focal physiological uncoupling of cerebral blood flow and oxidative metabolism during somatosensory stimulation in human subjects. Proc. Nat.! A cad. Sci. USA 83, 1140-4. (1986).
6. Dubowitz, D. J. et al. Functional magnetic resonance imaging in macaque cortex. Neuroreporl 9, 2213-2218 (1998).
7. Dubowitz, D. J. et al. Direct comparison of visual cortex activation in human and nonhuman primates using functional magnetic resonance imaging. Journal of Neuroscience Methods] 07, 71-80 (200 I).
8. Dubowitz, D. J. et al. Enhancing fMRl contrast III awake-behaving primates uSlllg intravascular magnetite dextran nanoparticles. Neuroreport 12, 2335-40 (200 I).
9. Ahrens, E. T. and Dubowitz, D. J. Peripheral somatosensory fMRl in mouse at 11.7 T. NMR Biomed. 14,318-24. (200 I).
10. Dubowitz, D. J., Martinez, A. and McDowell, J. A simple setup for tracking eye position during fMRI. Proc. of Int. Soc. Magn. Res. Med. 3,1691 (1999).
C
hapter 2 Magnetic Resonance Imaging in
Macaque
Cortex
This chapter describes the first experiments USIng fMRl to study functional neuroanatomy In an awake-behaving macaque monkey. It represents the first ever demonstration of stimulus-correlated functional magnetic resonance activation In a macaque monkey. This is significant, as previous attempts by other investigators in
anesthetized animals had suggested there was insufficient BOLD signal at 1.5 T to allow meaningful studies. The current set of experiments were performed in an awake animal, habituated to the noise of the scanner, and trained to watch a stimulus, while remaining still within the MR scanner. This paper was important in demonstrating that functional MRI in macaque monkeys was indeed possible, and could be developed as a valuable
neuroscience tool.
2.1
Abstracto-operative rhesus macaque (Macaca mulatta) in a conventional clinical 1.5 T MR scanner and present the first fMRl images from a macaque. Good resolution, signal-to-noise ratio and BOLD response (2.6-4.6%) have been achieved using the manufacturer's standard volume knee coil. Tl values of macaque gray and white matter (1490 ms, 1010 ms respectively) are higher than those in human brain, whereas T2 values are lower (55 ms, 48 ms respectively). An MR-compatible design for restraining the monkey is also described along with a suitable EPI sequence for BOLD images, optimized for monkey T2, with voxel sizes from 29-65 ~Ll, and MPRAGE sequence for anatomical studies with
0.8 mm isotropic resolution, optimized for monkey T l.
2.2
IntroductionThe advent of blood oxygen level dependent (BOLD) contrast and Functional Magnetic Resonance Imaging (fMRl)1 has provided a new noninvasive technique in behavioral
neuroscience for studying brain function. This technique has seen much development in medical and neuroscience application in human subjects2-6. However, the necessity of a
co-operative and motionless subject has, to-date, prevented a monkey model for awake fMRl from being realized. fMRl studies in anesthetized animals offer only limited value
in behavioral neuroscience.
Rhesus macaques (Macaca mulal/a) are readily trained to perform complex tasks for reward and have fomled the basis of much of our understanding about primate visual
microelectrode mappIng, radioisotope tracers and anatomical studies7-16. The ability to
perfect a nonhuman primate model for fMRI studies would lead to better understanding
about the complex relationship between cerebral fMRl activation (a blood flow change)
and the underlying cortical activation (an electrical event). It would also provide a new noninvasive tool to study functional neuroanatomy and CNS interconnections in the
nonhuman primate brain, and allow a more direct comparison with their human
homologues. In this report we describe a new technique for performing functional
magnetic resonance imaging in awake, co-operative, rhesus macaques in a conventional
1.5 T clinical MRI scannerl7, and present the first fMRl images from macaque brain.
2.3
Materials and Methods2.3.1 Animal Model
All studies were perfOlmed in a healthy, 4.5 kg, 4-year-old male rhesus macaque.
Approval for this research was obtained fi·om the Institutional Animal Care and Use
Committee, and Epidemiology and Biosafety Committees. The monkey was trained to lie
prone with his head erect ("sphinx" position) in a mockup of the bore of a clinical MR
scanner. His head was restrained by means of a custom-built MRl-safe headcap. The
monkey was trained to look at a viewing screen placed 200 em in front of him, allowing
was required only to look passively at the screen. During initial training within the MRl, a small dose of acepromazine (50 f,lg/kg i.m.) was occasionally needed to reduce anxiety in the monkey. With further training this was usually not required.
Figure 2.1 The monkey lies within the MRI in a sphinx position, with his head restrained in the RF coil. A visual stimulus is provided by a video projector on a screen at the opening to the MRI bore.
2.3.2 Stimulus
A visual stimulus was provided uSlllg an LCD video projector connected to a PC computer. For the experiments presented in this report, a 4-minute sequence of animated film, chosen to include rapidly changing colors, contrast levels, faces and movement (Aladdin, Walt Disney Company.), was presented to the monkey in 25 seconds clips.
[image:24.519.53.442.218.365.2]50-second cycle was repeated 4 times plus an additional period of 25 seconds darkness at the end (Figure 2.2). At the conclusion of each experiment, the monkey was rewarded with sugar water.
25 Sees
25 Sees
25 Sees
25 Sees
4
25 Sees
25 Sees
9
2.3.3 Surgical Technique and Experimental Setup
The monkey's head was held motionless for the duration of the experiment by means of a custom-built plastic headcap, which was surgically attached under general anesthesia. Details are shown in Figure 2.3. The screws and central post were constructed from machined polyetherimide. Four screw heads were positioned epidurally by means of a key-hole shaped trephine in the skull and secured with nylon nuts. The central post was positioned with the monkey's head held in a stereotaxic frame (Kopf Instruments), with its long axis parallel to the z-axis of the head (cranio-caudal direction). The screws and headpost were secured to each other with a polymethylmethacrylate headcap fashioned insitu. The scalp was closed in layers around the headcap.
The monkey was transp0l1ed to the MRl facility in an MR-safe plastic travel cage which had been modified to allow continuous filtered air flow. An acrylic (Plexiglas) tube was attached to the transport cage, and the monkey then crawled into the tube, from which only his head protruded. The acrylic tube with monkey was then positioned in the MRI
--Figure 2.3 Cross section through the RF coil showing details of the monkey's headcap with headpost and the headcap locator.
2.3.4 MR System
All imaging was done on a conventional 1.5 T Siemens VISION MR scanner equipped
with 25 mTim gradients employing 300 f.lsec rise times. Signal-to-noise ratio (SNR)
characteristics were measured for 3 different coils supplied with the MR scanner; circularly polarized (CP) transmit/receive head coil (26 cm diameter), CP
transmit/receive knee coil (19 cm diameter), and a receive-only flexible surface coil (37 x
Optimum coverage, SNR and coil loading were best achieved with the CP knee coil (see results).
Spin-echo TI and T2 weighted images were performed with varying repetition (TR) and
echo times (TE) in order to calculate T I and T2 of macaque gray matter and white matter
(TE=22,60, 120 msec, TR=300, 600, 900,1200,1500 msec).
Anatomical Imaging was done with a 3-D Magnetization-Prepared Gradient Echo
(MPRAGE) sequence. The TI values of monkey cortex were used to simulate
approximate parametersl8. The sequence was further optimized empirically for tissue contrast via a series of algorithmic models. Optimal parameters were found to be TRITE
= IIA / 4A msec, flip angle 12 degrees, inversion time (TI) 250 ms and delay time (TO) 600 ms. A 100 mm field of view (FOY) was acquired onto a 128 x 128 matrix, giving an isotropic resolution of 0.8 mm. 100% oversampling was used in the phase, read and slab
directions to reduce "wrap" al1ifacts and increase SNR. The total acquisition time was 13 minutes.
For BOLD weighted images, a low bandwidth (833 Hz/pixel) echo-planar (EPI FID)
sequence was found to give the best resolution, allowing a FOY as low as 140 mm to be
collected onto a 128 x 128 matrix. TE of 40 msec was chosen to approximate the T2 of monkey cortex for maximal functional contrastl9 Eight coronal slices of 3 mm were
first 5 repetitions were included to ensure steady state and were not used in data analysisl9. Optimum voxel size was determined empirically to allow maximum SNR per
pixel without excessive partial volume averaging. The monkey's head was positioned at the ccnter of the radio frequency (RF) coil for maximum SNR. This caused asymmetry in the coil loading, and the need for local shimming, which was achieved using an experimental volume-shim algorithm2o.
2.3.5 Image Processing
The time-dependent echo-planar images were processed off line on a Sun/Sparc workstation with AFNI software21 Functional images were generated using a
cross-correlation techniquel9. A series of phase-shifted trapezoids were used as the reference
waveforms (Figure 2.4). Each trapezoid function was correlated on a pixel-by-pixel basis with the time course series by a least-squares fit. Functional images were generated with intensity representing the magnitude of the best fit. Gram-Schmidt orthogonalization was used to remove linear drift in the time seriesl9. To remove spurious pixels, the functional
intensity map was thresholded at a correlation-coefficient value of 0.61 (p < I x I 0 -5
Post-processing of spin-echo images for tissue contrast optimization was done USIng NIH-Image software (U.S. National Institutes of Health, http://rsb.info.nih.gov/ nih-image/). Ten regions of interest were drawn around anatomically gray and white matter for each value of TE/TR. To calculate T\ and T2 values, mean signal (S) for gray and white was fitted to the relaxation curve:
S
-
-
S
oe
TEIT 2(I
-e
-TRIT)\
[ I ]NIH-Image was also used to calculate SNR characteristics of the 3 coils. Pixel values were combined for 6 regions of interest in a mid-coronal slice from a MPRAGE dataset,
and compared with background (air) noise for each coil. Mean SNR values for each coil were calculated.
2.4
ResultsRelative SNR calculations for 3 standard RF coils are shown in Table I. The knee coil
was the preferred coil for monkey imaging, having almost double the SNR characteristics of the head coil and a 50% improvement over the flex coil.
were used as a first approximation In optimizing the MPRAGE and BOLD weighted
sequences respectively.
ROI Area MR Signal Relative SNR
Head coil brain 379 181.82 ±12.l7 7.6
background 5000 23.89±5.92
Knee coil brain 408 227.76±11.66 14.8
background 5000 l5.4l±4.34
Flex coil brain 435 111.85±7.02 9.9
background 5000 11.29±3.06
Table 2.1 Signal-to-noise measurements for three standard Siemens RF coils; circularly
polarized head coil, circularly polarized knee coil, and surface flex coil. Measurements made in regions of interest (RO\) including both gray and white matter in a mid-coronal slice.
Noise measurements made in the air signal in the periphery of the image. Areas are measured
in pixels, mean signal and standard deviation are in arbitrary intensity units.
GM WM
TJ (msec) 1490 (920) 10tO (790)
T2 (msec) 55 (10 I) 48 (92)
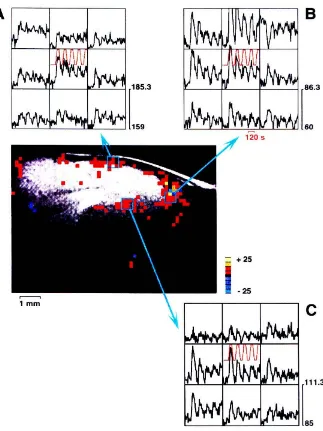
The functional intensity maps are presented in Figure 2.4. Areas of fMRI activation are clearly seen as discrete areas of activation in the primary visual cortex, and extra-striate visual cortex. These show high correlation with the presented visual stimulus. The fMRI response for 3 runs using differing voxel sizes of29.4 /-ll (3.13 x 3.13 x 3 mm), 45.9 /-ll
(3.9\ x 3.9\ x 3 mm) and 6\'2 ~t1 (3.91 x 3.9\ x 4 mm) are shown in Figure 2.5. Functional signals at these voxel sizes (as a percentage modulation of the MRI signal) were 4.6%,2.6%, 3% respectively.
2.5 Discussion
Figure 2.4 Areas showing significantly increased MR signal during the 25-st!cond movi~
clip compared wilh 10lal darkness. Analomical background image has (l.X ml11 isolropic resolulion. Funclional overlay has pixel dimensions 3.91 x3.91 x 3 mm. The posilions of Ihe
axial slices A-F are shown on Ihe sagillal slice. The unusual ghosling anifaci is due 10 Ihc
[image:33.518.34.451.85.479.2]Better signal-to-noise characteristics are achievable with such a coil in a larger subject (e.g., a human head) particularly areas of cortex that are geometrically closer to the coil (E.C. Wong -personal communication). While some improvement in signal-to-noise may be possible with a custom designed RF volume coil, the added cost and technical
expertise for this can be considerable. Our observed BOLD signal change of 2.6-4.6% is comparable with the 1.5-5% change observed in human studies 19.
The percentage modulation of the MRI signal is not a good measure for optimizing voxel
sizes; at smaller voxels the high noise may artificially elevate the observed percentage change. With increasing voxel size SNR increases, but the baseline M Rl signal may also change unpredictably due to partial volume averaging. Empirically a voxel size from 29.4 to 45.9 III was preferred, providing adequate SNR and BOLD response, while preserving
spatial resolution. Beyond this size, BOLD response was still observed, but the anatomical location was poorly defined.
Functional activation 111 the left primary visual cortex (V 1) showed higher functional intensity than on the right. In addition the area of activation in right and left V I appear to be a few millimeters displaced craniocaudally. The reason for this discrepancy is not immediately apparent. No attempt has been made to correct for the inevitable warp of
EPI images in the phase-encode direction (craniocaudal) by off-resonance effects22. The
if the area of visualized activation is to be more accurately transformed onto the
MPRAGE image (although a 0.5 pixel warp is still inevitable2\
.:'!' 'Vi c: <ll C c;; c: 0> U5
(b) ""-r--=:-- -==--,
lJSO
"90
:!13.313.3mm 110i),-I-~-~~-~----l
5J 60 70 80 90
39" ~391.3mTl "",-1---:'':""0 - :':60- """0 - ':':0--:1,,· Image Number Image Number
(c) "0..---==-- --== -..
.10
510
391 ~:J'~1 ,':mm "o-l-..-~_~-...,...----l
5 0 6 : 1 7 : : 1 80 9 0 Image Number
Figure 2.5 tMRI signal change with time for three different voxel si/.es. each graph
representing a typical active pixel in the occipital cortex. (a) 29.4 !-II (3.13 x 3.13 x 3 mm).
(b) 45.9 !-II (3.91 x 3.91 x 3 mm) and (e) 61.2 !-II (3.91 x 3.91 x 4 nun). The lower plot is the
time-varying MR signal. the upper plot is the ideal trapezoid reference function of the
stimulus vs. time used for correlation analysis. At 29.4 !-II MR signal shows good correlation
with the stimulus. but poor SNR. With voxel size increased to 45.9 !-II and 61.2 ~". SNR
improves but absolute BOLD signal diminishes due to partial volume averaging. Empirically
optimum voxel size to achieve good SNR and BOLD response is between 29 and 45 !-II.
Another possible explanation for the asymmetrical distribution of activation may lie in
the global physiological response to the stimulus used. Our paradigm was designed
primarily to stimulate as much of the visual system as possible. thus some differential
stimulation is to be expected, and has not been controlled for. In these early experiments.
control over the animal's behavior was minimal. Thus it is possible that the monkey
monkey may also have fixated on a part of the image that caused asymmetrical stimulation of the visual fields. Alternatively, the part of the image that caught the monkey's gaze (a face, for example) may not have been the most potent VI stimulus, with V I receiving maximal stimulation from elsewhere in the image. Further studies are planned which include a more refined stimulus paradigm. For these more complex paradigms and for awake-behaving studies, we have developed an infrared system for real-time monitoring of eye position that will enable us to better answer these questions.
Polymethylmethacrylate IS commonly used for head fixation 111 macaque
electrophysiological studies, and was thus our first choice material in designing an MR-safe head restraint. Some susceptibility artifact and distortion were observed with polymethylmethacrylate in vivo at the high gradient strengths employed for the BOLD weighting. For the studies described here, this presented no problem as the headcap was mounted anterior on the skull and well removed from any areas imaged. To make the technique more versatile, a new modification in which the headcap and head post are all made from a single unit of polyetherimide (machined to the curvature of the monkey'S skull) is being evaluated as an alternative for polymethylmethacrylate.
2.6 Conclusion
and, with further training, awake-behaving studies are also possible. This paves the way
for fMRI to be extended to include the study of the nonhuman primate cortex. With direct
correlation with macaque electrophysiological studies now possible, we may also be able
to gain further insight into the nature of the fMRl response.
2.7
Referencesl. Ogawa, S., Lee, T. M., Kay, A. R. and Tank, D. W. Brain magnetic resonance
imaging with contrast dependent on blood oxygenation. Proc. Natl. Acad. Sci. USA 87, 9868-9872 (1990).
2. Tootell, R. B. et at. Functional analysis of human MT and related visual cortical areas using magnetic resonance imaging. J. New"osci. 15, 3215-30 (1995).
3. DeYoe, E. A., Bandettini, P., Neitz, J., Miller, D. and Winans, P. Functional
magnetic resonance imaging (FMRI) of the human brain. J. New"osci. Methods.
54, 171-187 (1994).
4. Sereno, M. 1. et at. Borders of multiple visual areas in humans revealed by
functional magnetic resonance imaging. Science 268, 889-893 (1995).
5. Stapleton, S. R. et at. Combined utility of functional MR1, cortical mapping, and
frameless stereotaxy in the resection of lesions in eloquent areas of brain in
children. Pediatr. Neurosurg. 26, 68-82 (1997).
7. Andersen, R. A. Encoding of intention and spatial location In the posterior parietal cortex. Cereb. Cortex 5, 457-469 (1995).
8. Snyder, L. H., Batista, A. P. and Andersen, R. A. Coding of intention In the posterior parietal cortex. Nature 386, 167-170 (1997).
9. Andersen, R. A. Neural mechanisms of visual motion perception In primates. Neuron 18, 865-872 (1997).
10. Hubel, D. H. and Wiesel, T. N. Receptive fields and functional architecture of monkey striate cortex. 1. Physiol. (Land.) 195, 215-43 (1968).
II. Hubel, D. H. Exploration of the primary visual cortex, 1955-78. Nature 299, 515-24 (1982).
12. Felleman, D. J. and Van Essen, D. C. Distributed hierarchical processing in the primate cerebral cortex. Cereb. Cortex 1,1-47 (1991).
13. Tootell, R. B., Switkes, E., Silverman, M. S. and Hamilton, S. L. Functional anatomy of macaque striate cortex. 11. Retinotopic organization. 1. Neurosci. 8,
1531-1568 (1988).
14. Maunsell, 1. H. The brain's visual world: representation of visual targets In cerebral cortex. Science 270, 764-769 (1995).
15. Maunsell, 1. H. and Newsome, W. T. Visual processing in monkey extrastriate cortex. Annu. Rev. Neurosci. 10, 363-401 (1987).
16. Takechi, H. et al. Mapping of cortical areas involved in color vision in nonhuman primates. NeUl'osci. Leu. 230, 17-20 (1997).
18. Epstein, F. H., Mugler, J. P., 3rd and Brookeman, J. R. Optimization of parameter
values for complex pulse sequences by simulated annealing: application to 3D
MP-RAGE imaging of the brain. Magn. Reson. Med. 31, 164-177 (1994).
19. Bandettini, P. A., Jesmanowicz, A., Wong, E. C. and Hyde, J. S. Processing
strategies for time-course data sets in functional MRI of the human brain. Magn.
Reson. Med. 30,161-173 (1993).
20. Heid, O. H. Noniterative localized in vivo shimming in <ISs. Proc of In! Soc
Magn. Res. Med. 1, 363 (1996).
21. Cox, R. W. and Hyde, J. S. Software tools for analysis and visualization of fMRI
data. NMR Biomed. 10, 171-178 (1997).
22. Farzaneh, F., Riederer, S. J. and Pelc, N. J. Analysis of T2 limitations and
off-resonance effects on spatial resolution and artifacts in echo-planar imaging.
Magn. Reson. Med. 14, 123-139 (1990).
23. Cox, R. W. AFNI: software for analysis and visualization of functional magnetic
resonance neuroimages. Compu!. Biomed. Res. 29, 162-173 (1996).
2.8
ACknowledgmentWe thank Chris Headrick for the illustrations, Antigona Martinez for assistance with
functional image analysis, Yale Cohen and Boris Breznen for helpful discussion, Rick Paniagua for workshop and technical assistance, Sohaib Kureshi for surgical assistance.
This research was supported by the National Eye Institute (RAA) and the Pasadena
Chapter 3
Direct Comparison of Visual Cortex
Activation in Human and Nonhuman Primates Using
Functional Magnetic Resonance Imaging
The true strength of nonhuman primate functional MRl as a neuroscience tool is to bridge the gap between functional MRI studies of the human brain and our insights of the working of the brain from the more invasive electrophysiology studies in nonhuman
primates. There are two parts to this comparison: firstl to establish the link between functional MRI activation and neuronal activity; second, to study patterns of functional MRI activation in humans and in monkeys to bridge the gap between the two species. For these studies the technique remains the same, only the species under investigation varied.
This chapter looks at this latter comparison using functional MRI across species. This is the first direct visualization of functional homology between primate species using fMRl.
3.1
AbstractWe report a technique for functional magnetic resonance imaging (fMRl) in an awake,
areas of striate and extra-striate visual cortex and in areas for motion, object and face recognition in the monkey and in homologous visual areas in a human volunteer. This article describes T1, T2 and T2* values for macaque cortex, suitable MR imaging sequences, a training schedule, stimulus delivery apparatus and restraining hardware for monkey fMRI using a conventional 19 cm knee coil. Much of our understanding of the functional organization of the primate brain comes from physiological studies in monkeys. Direct comparison between species using fMRI, such as those described here, will help us to relate the wealth of existing knowledge on the functional organization of the nonhuman primate brain to human fMRI.
3.2
IntroductionSince its initial description I, fMRI has seen much development In human subjects for
psychology, neuroscience2.3, and more recently for clinical applications4.5, allowing us to
delineate areas of functional deficit (rather than merely structural deficit) or to track functional recoverl. The technique produces images of activated brain regions by detecting the indirect effect of neural activity on local blood flow and oxygen saturation - the BOLD or Blood Oxygen Level Dependent effect.
inter-species and inter-technique variability need to be considered9,22,23, Using a monkey
model for fMRll6 would bridge this gap in two ways, Firstly, allowing comparison of
behavioral electrophysiological and fMRI changes in the same animal (direct comparison
of fMRI with electrophysiological recordings in humans being limited ethically to cases
with preexisting pathology), Secondly, the ability to makc direct comparisons between
the human and macaque brain using the same imaging technique, and while performing
the same paradigm has the potential to greatly improve our understanding of the human
brain, allowing us to make direct inferences about human neurophysiology based on our
existing wealth of knowledge from macaque neurophysiology,
3.3
Materials and Methods3.3.1 Experimental Setup
Figure 3.1 The monkey lies within the MRI in a sphinx position in the RF knee coil. A
3.3. t.1 Animal Studies
All animal studies were perfomled in a healthy, 6.5 kg, adolescent 5-year-old male rhesus
macaque. Approval for this research was obtained from the Institutional Animal Care and
Usc Committee, and Epidemiology and Biosafety Committees. The monkey was trained
to lie prone with his head erect ("sphinx" position) in the bore of a clinical MR scanner
and to look at a viewing screen placed 200 cm in front of him. The monkey's head was
hcld motionless for the duration of the experiment by means ofa surgically attached
MR-compatible plastic headcap. To minimize susceptibility artifacts from the restraint, this
was machined from a single piece of polyetherimide resin (a material having both good
biocompatibility and susceptibility close to that of tissue). The monkey was transported
to the MRI facility in an MRI-compatible transport cage. An acrylic (Plexiglas) tube was
attached to the transport cage, and the monkey then crawled into the tube, from which only his head protruded. Thc acrylic tube containing the monkey was then positioned in
the M Rl machine (Figure 3.1), and the head cap was secured to the window in the
receive/transmit coil. This allowed the head to bc restrained during experiments, but
could be loosened to allow the monkey to raise or lower his head freely between
experiments. A tube to supply fruit juice was positioned near the mouth to reward the
monkey at the conclusion of each experiment. The monkey wore a diaper for the duration
of the study, and all areas of the MRI machine with which the monkey could come into contact (MR table, RF coil) were covered in polythene sheeting. Initial training consisted
of habituating the animal to a travel cage and teaching him to crawl into an acrylic tube
of the MRI environment and in the MRI scanner to reward the monkey for keeping still
while viewing a visual stimulus (taking approximately 6 months). Rewarding the monkey
consisted of positive re-enforccment with treats the monkey enjoyed (in this particular
case, fruit juice). Even with head fixation, the monkey was able to move up to 2 or 3 mm.
Good behavioral control and the willing co-operation of the monkey was essential to
obtain images free from motion artifacts.
3.3.1.2 Human Studies
A young adult male (17-year old) was used as an adolescent "age matched" human
control. Informed consent, following Institutional Review Board ethical guidelines, was
obtained after detailed explanation of the procedure. The subject lay supine and viewed
the same paradigm as the monkey on the screen at his feet via a mirror attached to the
head coil (ensuring the same viewing distance and visual field of view as the monkey).
His head was restrained with foam pads.
3.3.2 Choice of Stimulus
Macaques, like humans, have a very advanced visual system and use this as their primary
visual pathways was required, and to which the monkey would readily attend.
Preliminary observations were made on two adult male macaques while they watched
movie videos in the laboratory to elucidate what sort of visual stimulus would best hold a
monkey's attention. Comparison was made between white noise, monochrome movies,
color movies and animated cartoons. Attention was judged by recording maximal fixation
times. Macaques showed a clear preference for animated cartoons, for which they were
capable of maintaining attention, with intermittent short gaps, for up to 35 minutes. They
are easily distracted, and a noisy, colorful movie and a regular reward system greatly improve their performance.
3.3.3 Stimulus Paradigm
A visual stimulus was provided uSll1g an LCD video projector. For the experiments presented here, sequences from a children's animated film were presented to the monkey in 24-second clips. The film was chosen to include rapidly changing colors, contrast
levels, faces and movement. Each film clip was preceded by a period of complete
darkness for 24 seconds. The 48-second cycle was repeated 3 times with an additional
period of 24 seconds darkness at the end. The whole sequence lasted 3.5 minutes and was
repeated 4 times (for signal averaging). For the data presented in this report, the monkey
was required only to look passively at the screen. The human subject viewed the same
stimulus, but due to superior signal-to-noise ratio (SNR) in fMRI of human brain, only 2
3.3.4 MR System
All imaging was performed on a conventional 1.5 T Siemens VISION MR scanner
equipped with 25 mT/m gradients (300 /ls rise times). A 19 em circularly polarized knee
coi I was used as this was found to have the optimal loading characteristics and 50-100%
superiority in SNR over a conventional head coil or flexible surface coil16• The monkey's
head was positioned at the center of the radio frequency (RF) coil. This provided
maximum SNR despite the resulting asymmetrical coil loading by the animal's torso.
Local shimming was with an experimental volume-shim algorithm24.
In order to optimize anatomical and BOLD weighted sequences for monkey cortex, T I,
T2 and T2* relaxation times were measured in gray and white matter. A phase-sensitive
inversion recovery (lR) sequence was used for TI measurements (repetition time (TR),
7666 ms, echo time (TE), 29 ms, Inversion times (TI), 300, 450, 600, 900, 1200, 1500
ms). A 2D Fast Low Angle Shot (FLASH) sequence was used to measure T2* (TR 1000
ms, TE 5, 7, 10, 12, 15, 18, 20 ms) and T2 measured by fitting alternate echoes ofa
Carr-Purcell-Meiboom-Gill (CPMG) multiecho spin echo sequence (TR 8000 ms, TE 22.5 ms
- 360 ms in 22.5 ms intervals). Five slices were acquired with 200 x 200 mm FOV and a
"
"0
"
w !! ;:;
c-o
:n ;;'" 0 w
"
:l Anatomy Anatomy BOLD BOLD T, T, T2*.D
c: CO
"
OJ:l
"
en (Human) (Monkey) (Human) (Monkey) (Monkey) (Monkey) (Monkey)0
."
:l c:"
0- 3'" ~ :;:
w 3
~ ~ §;
V>
'"
Sequence 3D-MPRACE 3D-MPRACE EPI-CE EPI-CE True IR CPMC lD-FLASH~
'" ...,
:l
'"
:l"" '< c: cr "0 COJ :T-
"
..., ...., Bandwidth (Hz) , 33,280 (130) 16,640 (130) 106,624 (833) 106,624 (833) 33,280 (130) 33,280 (130) 33,280 (130)cr o· '3. 3::
"
...,
,.,.
xc:
C :l ~ Echo Time, TE (ms) 4.4 4.4 40 40 29 22.5-360 5-20
-,
"
'"
'" '"'"
5
"
OJ .D
2000' 2000' 7666 8000 1000
"
en :;:1i
Repetition Time. TR (ms) 11.4 11.4"0 '" :l :l :l""
C C 0
:l :;: :l
"
Inversion Time, TI (ms) 20 250 300-1500V; :l "0 "0
"
"
3 i3' ...,
" '"
..., Delay Time, TD (ms)0 600
"
..., :l OJ'"
:r
en w
"
c: ..., 0
"
8'"
"
'""
..., Flip Angle (degrees) 10 12 90 90 180 90 90
0-"
.'" '" wX .D ~ i3' 0\
c: N :l
"
~ ..., Number of Averagesc: :l
"
~OJ 0
"
~cr Y' ;;::l
"
..., 0 Field of View, FOV (mm) 256 x 256 90 x 90 448 x 448 256 x 256 200 x 200 200 x 200 200 x 200~ c <
"
....,"
:l"
x :;-...,
<5"
Imaging Mattix 256 x 256 128 x 128 128 x 128 128 x 128 256 x 256 256 x 256 256 x 256"0 0- ;;::l
"
..., o· 0- OJ"
3
<>"
n' Imaging Plane Sagittal Axial Axial Coronal Axial Axial Axial<>
"
"
;:? '" Z ..., 3-"
-140 J 80.1
'" c: :l :l Slice (slab) ll1ickness (mm) 4 5 5 5 5
"
OJ"
0-< cr 0- ...,"
"
"
..., ..., cr'"
Numberofsliees 140 ' 984 5 5 5'"
'<(JO C x
"
...., :T-"
0- "0"
0:::r Voxcl Resolution (mm) I x I x I 0.7 x 0.7 x 0.8 3.5 x 3.5 x 4 2x2x5 0.8 x 0.8 x 5 0.8 x 0.8 x 5 0.8 x 0.8 x 5
"
~"
'" 3
"
;;::l"
-
"
Number of Measurements' 84<2 84x4:l
" "
0 '"
c 0- "0 x c: ...,
" "
"
..., 3 '" <>3
"
"
;:? "0 ;:?Anatomical imaging was obtained using a 3-D Magnetization-Prepared Rapid Gradient Echo (MPRAGE) sequence. The measured TI values of monkey cortex were used to set initial sequence parameters. The sequence was then further refined empirically for best gray/white matter contrast. Optimal parameters for monkey cortex were found to be TRITE
=
11.4 / 4.4 ms, flip angle 12 degrees, inversion time (preparation time) 250 ms and delay time (magnetization recovery time) 600 ms. A 90 x 90 mm field of view (FOY) was acquired with a 128 x 128 matrix, and 98 phase encode steps made through a 80 mm slab (0.7 x 0.7 x 0.8 mm resolution). 100% over-sampling was used in the phase, read and slab directions to reduce "wrap" artifacts and increase SNR. The total acquisition time was 13 minutes.empirically to allow maximum BOLD contrast-to-noise ratio (CNR) per pixel without
excessive partial volume averagingl6. A voxel volume of 40 fll provided optimal BOLD
CNR but was too coarse to define anatomical structures in the small macaque brain.
Resolution was improved to 20 fll and SNR elevated with use of 4-fold signal averaging.
This resolution was achieved by imaging a FOY of256 x 256 mm and a 128 x 128 matrix
using 5 mm slices (resolution 2 x 2 x 5 mm).
For the human studies, a conventional circularly polarized 26 em head coil was used.
Optimum sequence timing parameters for 3D-MPRAGE were TRITE
=
11.4 / 4.4 ms,flip angle 10 degrees, inversion time 20 ms and delay time 0 ms. A 256 x 256 mm FOY
and 256 x 256 matrix was acquired, and 140 phase encode steps taken through a 140 mm
slab (isotropic I mm resolution). The sequence had been previously optimized for
another human fMRI study, and was not re-optimized in this current stud/I. For BOLD studies the same low bandwidth (833 Hz/pixel) was used with TEcff = 40 ms, and effective TR
=
2000 ms. Ten axial 4 mm slices with FOY 448 x 448 mm were acquiredevery 2000 ms with a 128 x 128 matrix to achieve the desired voxel size (resolution 3.5 x
3.5 x 4 mm). Eighty-six repetitions of the 10 slices were taken in under 4 minutes (84
used for image processing). This was repeated twice for signal averaging. Image
3.3.5 Image Post-Processing
The time-dependent echo-planar images were processed off line on a Sun/Sparc UnIX
workstation with AFNI software26 Time series were initially corrected for any motion
using an AIR technique and Fourier interpolation within AFNI. The multiple repetitions
of the time-dependent series (4 for thc monkey studies, 2 for the human studies) were
averaged into a single series to improvc SNR. Functional images were generated using a
cross-correlation technique. A series of phase-shifted trapezoids were used as the
reference waveforms, which were cross-correlated on a pixel-by-pixel basis with the MR
signal time course. Gram-Schmidt orthogonalization was used to remove drift in the time
series using a third order polynomial25. To remove spurious pixels, the functional
intensity map was thresholded at a correlation-coefficient value of Irl > 0.5 (p < I x I 0 -3
following conservative Bonferroni correction for multiple comparisons). Only pixels in a cluster of at least 3 contiguous significant pixels were displayed. Functional images were generated by fitting the reference waveform to the MR signal time course by linear fit,
with intensity representing the magnitude of the fit coefficient. To reject spurious
activation in areas of low signal, the linear fit coefficient was normalized by the baseline
MR signal for each pixel. Pixel intensity was thus calibrated as percentage change
relative to baseline. MPRAGE and functional maps were co-registered using AFNI software. Discrepancies in the co-registration were corrected by "nudging" the
anatomical images (up to one or two pixels). Images were treated as rigid bodies and no
unwarping performed. No additional interpolation or resampling was performed. Studies
rejected. This was assessed by examining the MR time course of areas of scalp which
would be sensitive to stimulus-correlated motion artifact, but would not be expected to
have stimulus-correlated BOLD activation.
Borders of functional cortical areas in human brain were defined by areas of significant
activation during the fMRI task, and subdivided manually based on previous human
fMRJ literature2•22,27.33 and PET literature34•35. In the macaque, areas of activation were
manually subdivided into distinct retinotopic cortical regions from anatomical studiesl2,36
and single unit recording and tracer studies37-4o.
Post-processing of spin-echo and gradient-echo images for tissue relaxometry in macaque
brain was done using NIH-Image software (U.S. National Institutes of Health,
http://rsb.info.nih.gov/nih-image/). Multiple regions of interest (ROI) were drawn around
anatomically defined gray and white matter on the TI = 300 ms phase-sensitive IR images
(which had the best gray/white matter contrast) and the ROI copied to all the other
images. To calculate TI values, MR signal intensity S(TI) for gray matter and white
matter was fitted to the inversion-recovery relaxation curve described by equation I:
[I]
Where Mo is the initial longitudinal magnetization, Mz(O) is the magnetization at TI = 0,
T2 values were calculated from the CPMG sequence by fitting the MR signal S(m:) in gray and white matter to alternate echoes of the spin-echo relaxation curve described in equation 2:
{
-
1/
1
T
,
-T1
yI;
SODDe (\ -
e
)
n=
1,3,5,7,
...
..
S(nr)
=
-
1/
1
1'
,
-
T1
YT,
S
EVENe(1-
e
)
n=
2,4,6,8,
...
..
[2]
T is the CPMG echo spacing (22.5 ms), n is the echo number, SODD and SEVEN are the
initial signals at n=O for the odd and even echo trains respectively. The final value for T2
was the mean ofT2 values calculated from even and odd echo relaxation curves.
T2* values were calculated by assuming an exponential relationship between the MR signal, S(TE), and the echo time, TE, described by equation 3:
S(TE)::::::
S'(O)e-
T
Y
T
,
.
[3]
S'(O) is the initial signal.
The fit optimization was implemented in Matlab (The Mathworks Inc., Natick, MA)
using a proprietary large-scale subspace trust-region algorithm based on an
interior-reflective Newton method41. The algorithm allows specification of upper and lower
Gray Matter (n=3) White Matter (n=3)
T, (ms) 1010 ± 8.5 (920) 790 ± 4.0 (790)
94 ± 0.8 (10 I ) 92 ± 2.5 (92)
49 ± 2.3 46± 6.5
Table 3.2 T" T2 and T2' values for macaque brain in n=3 monkeys expressed as mean ±
standard deviation. Typical values for human brain are shown in parentheses4
'.
3.4
ResultsFigure 3.2
Functional activation in macaque brain. Activated pixels are 2 x 2 mOl superimposed on T,
weighted MP·RAGE images of 0.7 x 0.7 mm resolution (coronal images A·E are at 5 mill
spacing ranging from 25 to 5 mm anterior to the occipital pole). Labeled areas are visual
cortex (V I. V2. V:>. V4). medial temporal area (MT). medial superior temporal area (MST).
lateral intraparietal area (LIP). superior sagittal sinus (s.s.s). straight sinus (st.s). transverse
Figure 3.3
Functional activation in human visual corlex. Activated pixels are 3.5 x 4 mill superimposed
on '1', weighted MPRAGE images of I mOl isotropic resolution. Coronal images A-E are at 7
111m spacing ranging from 44 to 16 mm anterior to the occipital pole. Green oars on the
sagiltal image indicate the position of coronal images A-E (height of green bars indicates
superior-inferior extent over which fMRI data was acquired). Labeled areas are visual cortex
(VI. V2. VP. V3A. V4 - dorsal and ventral). medial temporal complex (MT+). fusiform
gyrus (Fus). lingual gyrus (Lin). anterior motion urea (anLm).
The functional intensity maps for macaque and human visual cortex show homologous
anatomical locations in both species and have been labeled in Figures 3.2 and 3.3. Areas
cortex. These areas show high correlation with the presented visual stimulus. Activation
is observed in the macaque brain in areas corresponding to hierarchical visual cortical
areas V I, V2, V3, V4, in parietal area LIP (lateral intraparietal) and temporal areas MT
(medial temporal), MST (medial superior temporal) and TEO (temporal occipital area).
The central veins draining this area (superior sagittal sinus, straight sinus, transverse
sinus and sigmoid sinus) also show activation. Human cortical activation is secn in
homologous visual areas VI, V2, VP, V3A, V4, MT-complex (MT+), fusiform, lingual
and parahippocampal gyri and anterior visual motion areas.
3.5
DiscussionThis technique provides high-resolution images of discrete areas of fMRl activation in
the macaque monkey, which are comparable to visual fMRI studies in humans. Areas of
activation are recognizable in striate and extra-striate visual cortex consistent with what
would be expected from this global stimulus paradigm.
The strong activation In the pnmary and secondary areas (VI, V2) of macaque
retinotopic visual cortex (Figure 3.2) confirms the cartoon movie is stimulating visual
pathways. Activation is also noted in ventral and dorsal visual processing streams. This
includes area V4 (associated with the vivid colors in a stimulus)43, also noted is activation
in areas V3 and medial temporal area, MT, which are associated with the perception of
suggests that the stimulus may be providing "optic flow" (the complex visual motion that
may be encountered during sel f_motion)45.46. Activation of TEO (architectonic temporal
occipital area) has previously been associated with object and face recognition37 and
fMRI activation in area TEO seen in this experiment may indicate that the monkey is
recognizing faces and distinct objects in the cartoon. Activation located in the lateral
intraparietal area, LIP, is seen with stimuli requiring saccadic movements to different
areas of interest on the screen47 (i.e., a non-fixating stimulus).
The activation in the human visual cortex shows a similar pattern of retinotopic cortical
activation, with ventral and dorsal stream activation. The anatomical positions do not
corrclate structurally across species22,32,33; however, functionally homologous areas of
activation are identified in both species, and their relative size and position are readily
observed. Retinotopic visual areas V I, V2 and VP are activated during the stimulus
(Figure 3.3). Human visual cortex also shows V4 activation, which may be associated
with the vivid colors of a stimulus35 and activation in the MT -complex (the human
homologue of macaquc area MT and MST) similar to that seen in the monke/.
Comparison with previous studies of face and object recognition in humans show similar
patterns of cortical activation in the lingual and fusiform gyri29.31 using the current
stimulus. These are believed to be homologous to macaque area TE03l. Activation in
human supplementary anterior visual motion areas is also observed adjacent to auditory
cortex, which may correspond to the macaque superior temporal polysensory area27
Although the stimulus activated many areas of the visual pathways, the exact feature of
macaque or human cortex is not confirmed from the current study and is the subject of
ongoing work. These initial observations of areas of potential cross species homology are
currently the subject or more detailed fMRI studies with more directed stimuli than the
simple cartoon animation described here.
There are asymmetries in the patterns of visual activation in both the macaque and human
fMRI studies. Functional lateralization is well described in humans, particularly
language, parietal function and dominant handedness. fMRI studies have described lateral
asymmetry in other areas, e.g., MT-compl ex27. Unlike human studies, the macaque's
fMRI does not show any lateral asymmetry in MT activation. This is not unexpected, as
clinically macaques show considerably less lateralization than humans (and are
ambidextrous). Despite this, some asymmetry is seen in the pattern of activation in the
macaque (e.g., dorsal V I in Figure 3.2d). This may be due to the stimulus used. The
subject was free to observe the movie without fixating at a particular part of it, thus it is
possible that both the monkey and human subjects experienced fluctuations in visual
attcntion, perhaps becoming less attentive to all or part of the stimulus. Visual attention
has been shown to modulate fMRI signal in retinotopic visual cortex21. Further studies
are planned which include a more refined stimulus paradigm to more precisely map
known areas of cerebral activation. For these more complex paradigms and for behavioral
studies, we have developed an infrared system for real-time monitoring of eye position