Narrative Generation from Extracted Associations
Pierre-Luc Vaudry and Guy Lapalme
RALI-DIRO – Université de Montréal
C.P. 6128, succ. Centre-Ville
Montréal, Québec, Canada, H3C 3J8
{vaudrypl,lapalme}@iro.umontreal.ca
Abstract
This paper describes a method for ex-tracting potential causal relations from temporal data and using them to structure a generated report. The method is applied to the Activity of Daily Living domain. The extracted relations seem to be useful to locally link activities with explicit rhe-torical relations. However, further work is needed to better exploit them for im-proving coherence at the global level.
1
Introduction
One way of presenting voluminous and hetero-geneous temporal data is to use natural language generation (NLG) technology to produce a narra-tive text summarizing the events of a given peri-od. Experiments have shown that a narrative written by a domain expert can be a better sup-port for decision-making than a graphical presen-tation of the same data (Law et al., 2005). Unfor-tunately current automatically generated narra-tives fail to achieve the same level of perfor-mance (Portet et al., 2009). Experts in discourse analysis have concluded that the problem may lay in the narrative structure: deficiencies in nar-rative flow and narnar-rative details impacted nega-tively on coherence (McKinlay et al., 2009).
How can the coherence of generated narratives be improved? Causal networks have been suc-cessfully used to explain the process of narrative comprehension in humans (Trabasso et al., 1989). This motivated their use in the automatic creation of fairy tales (Swartjes and Theune, 2006; Theune et al., 2007). Those causal net-works are essentially composed of physical and mental events and states (of which goals and ac-tions) connected by causal relations. Restrictions
apply on which types of causal relation can con-nect which types of event or state. Some have suggested that causal relations also play an im-portant role in improving narrative generation from real-life data (Hunter et al., 2012; Gervás, 2014). Several narrative generation systems al-ready identify and make use of some causal rela-tions (Hallett, 2008; Hunter et al., 2012; Bouayad-Agha et al., 2012; Wanner et al., 2010). Going one step further, Vaudry and Lapalme (2015) have raised the question of the possibility of extracting an appropriate causal network from real-life temporal data and use it to generate more coherent narratives. They briefly proposed a document planning method that could presum-ably be parameterised to generate texts of varied styles from a single causal network. However, they did not address the causal network extrac-tion process.
The goal of the experiment described in this paper is to verify if it is possible to extract a form of causal network from temporal data and use it to generate a coherent narrative text. The exper-iment consisted of data mining for associations in Activity of Daily Living (ADL) data to pro-duce a network of hypothesised causal relations. This causal network was then used to generate a report of unusual facts aiming at supporting anomaly assessment.
2
Context of application
Ambient Assisted Living (AAL) technology can be used to help elderly people to live in their own house longer. Moreover, sensor equipment can be used to monitor an elderly person's Activities of Daily Living and detect anomalies associated with dementia early (Lalanda et al., 2010).
There are different ways of processing sensor data to detect and present possible anomalies. For example, Munstermann et al. (2012) achieve typical behaviour discovery by learning a transi-tion network from the ADL sequence data. They then use it to measure how normal a given day is and map this metric to traffic light colours.
However the normalcy of a given day is measured, health care professionals would still need to assess if there were indeed anomalies and what was their nature. For this, a more detailed access to the data is required. In our experiment, we explore a way of presenting unusual facts using NLG technology. For that we extract asso-ciation rules from the event data. We then use them to present a textual narrative summary of a given time interval that emphasises unusual facts. Health care professionals could then re-view this summary for potential anomalies with access to other sources of information. One ad-vantage of natural language is that it can com-pactly express not only events but also multiple relations between events. By selecting for the generated text only the most important events and relations, the reader should not have to pore over unnecessarily detailed usual behaviour.
Since this was our first experiment both with generating a narrative from extracted associa-tions and presenting unusual facts in ADLs, we wanted to work on as simple a dataset as possi-ble. For this reason we chose the publicly availa-ble UCI ADL Binary Dataset (Ordóñez et al., 2013). This dataset was assembled to train activi-ty classifiers that take as input raw sensor data. We do not address this task in this paper, relying instead on the reference annotations provided as our input (but see for example the paper just cit-ed or Fleury et al., 2010). Generating from real data and not reference annotations would pose problems that are out of the scope of this paper.
This dataset includes the ADLs of two users (A and B) in their own homes. The data was rec-orded for 14 and 21 consecutive days, respective-ly. Binary sensor events and the corresponding activity labels are given. We used only the latter in this experiment. For each sensor event or ac-tivity, the start and end time are given. There is
no overlap between sensor events and between activities (there was only one person per house).
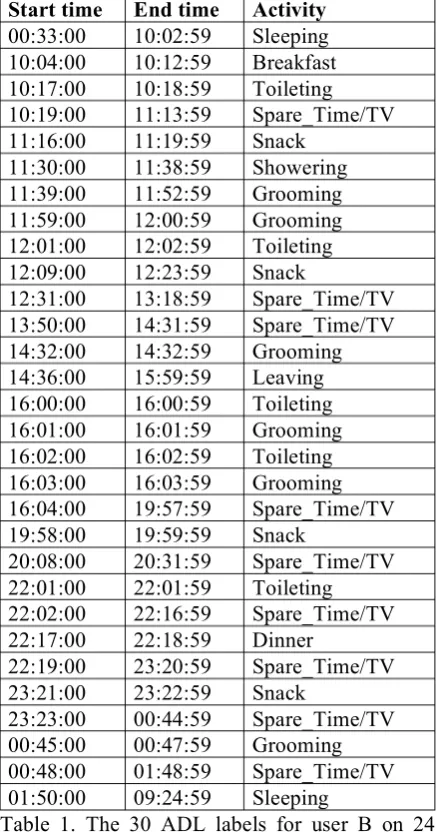
The ADL label set is: Leaving, Toileting, Showering, Sleeping, Breakfast, Lunch, Dinner, Snack, Spare_Time/TV, Grooming. The ADL sequence for user A comprises 248 activities (average of 18 activities per day) and that for user B, 493 activities (average of 21 activities per day). As an example, Table 1 shows the 30 ADL labels for user B on 24 November 2012.
Sometimes the same label is repeated and one could think that it was just the same activity that continued. However, by looking at the sensor data we can understand why it was annotated in this way. For example, between the Grooming that finishes at 11:52 and the following activity, also Grooming, that begins at 11:59, the bed-room door was used twice. In any case, it is out of the scope of this paper to question the annota-tion process.
Start time End time Activity 00:33:00 10:02:59 Sleeping 10:04:00 10:12:59 Breakfast 10:17:00 10:18:59 Toileting 10:19:00 11:13:59 Spare_Time/TV 11:16:00 11:19:59 Snack
11:30:00 11:38:59 Showering 11:39:00 11:52:59 Grooming 11:59:00 12:00:59 Grooming 12:01:00 12:02:59 Toileting 12:09:00 12:23:59 Snack
12:31:00 13:18:59 Spare_Time/TV 13:50:00 14:31:59 Spare_Time/TV 14:32:00 14:32:59 Grooming 14:36:00 15:59:59 Leaving 16:00:00 16:00:59 Toileting 16:01:00 16:01:59 Grooming 16:02:00 16:02:59 Toileting 16:03:00 16:03:59 Grooming 16:04:00 19:57:59 Spare_Time/TV 19:58:00 19:59:59 Snack
20:08:00 20:31:59 Spare_Time/TV 22:01:00 22:01:59 Toileting 22:02:00 22:16:59 Spare_Time/TV 22:17:00 22:18:59 Dinner
22:19:00 23:20:59 Spare_Time/TV 23:21:00 23:22:59 Snack
23:23:00 00:44:59 Spare_Time/TV 00:45:00 00:47:59 Grooming 00:48:00 01:48:59 Spare_Time/TV 01:50:00 09:24:59 Sleeping
[image:2.595.305.524.335.753.2]3
Data mining for association rules
For finding significant association rules in the ADL data, we used the data mining techniques presented by Hamalainen and Nykanen (2008). This approach was selected because it has been successfully applied for the construction of a causal network from a video (Kwon and Lee, 2012). The video was first segmented spatially and temporally using only pixel information to form the nodes of the network. The causal net-work was then presented as a visual (non-textual) summary of the video.
Generating a textual video summary using a similar technique would be an interesting en-deavour. However, for that we would have first needed a reliable way of producing a sufficiently accurate textual description of an arbitrary spa-tio-temporal segment of a video. Generating text from ADL labels and time-stamps is easier as a first step to test our narrative planning method.
In this experiment we considered a limited number of simple types of association rules in the ADL data. To select them we assumed that temporal proximity and temporal precedence were indicators of potential causality. Alt-hough it is far from being a guaranty of causality, it is simple enough to apply as a first step. Also, the causal relation could very well be indirect or the relation may instead imply a common cause between the two events. Nevertheless, it does not necessarily make the relation less relevant to hint at in the generated text. The relations extracted from sensor data can only be imperfect, because sensor data contain only a fraction of the relevant information. However, the causal relations that count in the end are those the human reader re-constructs in his mind with the help of other sources of information, not the exact ones the machine identified.
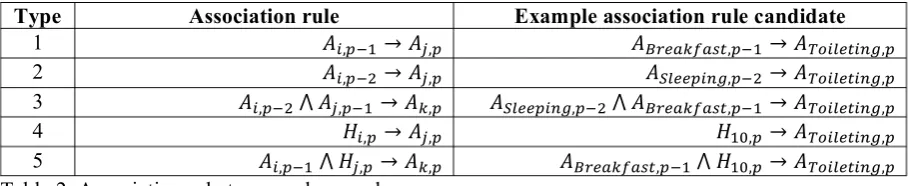
The types of association rule considered are shown in Table 2. In the following, A and H are categorical variables and stand respectively for activity and hour of the day (hours 0-23, not con-sidering minutes). Ai,p stands for a particular type
of activity i at position p in the event sequence. Association rule type 1 evaluates the influence of
the last activity on the choice of the current ac-tivity. Type 2 does the same for the penultimate activity and type 3 for the last two activities. Type 4 takes into account the influence of the current hour of the day on the choice of activity. Lastly, type 5 combines the current hour and the last activity to try to predict the current activity. Each rule is accompanied by an example with the first Toileting activity of Table 1.
To be able to describe the algorithm in more general terms, events and states will in this paper be called eventualities (after Bach, 1986). This includes activities and hours of the day.
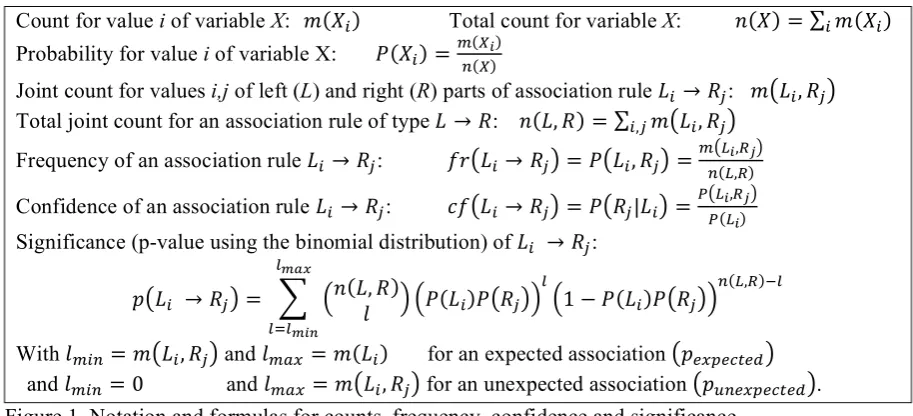
For selecting significant association rules, we computed three properties for each candidate (Hamalainen and Nykanen, 2008):
• frequency: the probability of encountering an instance of the association rule in the da-ta; it is estimated from counts;
• confidence: the conditional probability of encountering an instance of the association, given that we just encountered an instance of the left part of the association rule;
• significance: the probability of obtaining the observed counts if the events on the right part of the rule were actually independent of the events on the left part of the rule. It is measured by computing the p-value accord-ing to the binomial distribution.
We computed two p-values: one to indicate positive association rules (significantly high counts) and the other to indicate negative associ-ation rules (significantly low counts). By the lat-ter we mean cases in which the presence of the events on the left part of the rule can be used as a predictor of the absence of the events on the right part of the rule. In other words, actual instances of these association rules are unexpected.
Those properties are formalised in Figure 1. To compute frequency, confidence and signif-icance, we counted in the data 𝑚 𝐿!,𝑅! and
𝑚 𝐿! for each value i,j for each association
can-didate 𝐿! →𝑅!. Those counts were made using all the data available for a given user.
Type Association rule Example association rule candidate
1 𝐴!,!!! →𝐴!,! 𝐴!"#$%&$'(,!!!→𝐴!"#$%&#'(,!
2 𝐴!,!!! →𝐴!,! 𝐴!"##$%&',!!!→𝐴!"#$%&#'(,!
3 𝐴!,!!! ⋀ 𝐴!,!!!→𝐴!,! 𝐴!"##$%&',!!! ⋀ 𝐴!"#$%&$'(,!!!→𝐴!"#$%&#'(,!
4 𝐻!,! →𝐴!,! 𝐻!",! →𝐴!"#$%&#'(,!
[image:3.595.71.530.668.761.2]Next, we filtered the association rule candi-dates using the following criteria. To get the ex-pected association rules, we retained only candi-dates 𝐿! →𝑅! for which 𝑐𝑓 𝐿! →𝑅! >𝑐𝑓!"# and 𝑝!"#!$%!& 𝐿! →𝑅! <0.05. To get the un-expected association rules, we retained only can-didates 𝐿! →𝑅! for which 𝑐𝑓 𝐿! →𝑅! <𝑐𝑓!"# and 𝑝!"#$%#&'#( 𝐿!→𝑅! <0.05. We tried dif-ferent values of 𝑐𝑓!"# and 𝑐𝑓!"# and settled for 𝑐𝑓!"# =0.3 and 𝑐𝑓!"#=0.07. This seemed
reasonable because there were 10 ADL labels, which would give an a priori probability of 0.1 for each without any knowledge about the data. This means that associations that have a condi-tional probability of having their right part hap-pen with a probability around 0.1 given their left part do not give much information. They are thus less relevant.
We also had to filter the candidates to elimi-nate redundancy: 𝐿!! →𝑅
! is considered more
general than 𝐿!! →𝑅!
if and only if the events of
𝐿!! are included in the events of 𝐿!!. For example, the rule 𝐴!"#$%&$'(,!!!→𝐴!"#$%&#'(,! is more
general than 𝐴!"##$%&',!!! ⋀ 𝐴!"#$%&$'(,!!! → 𝐴!"#$%&#'(,!. We considered a rule candidate non-redundant only if all more general rule candi-dates were less significant (had a higher p-value). We still kept a more general rule candidate too if it was significant enough (p-value < 0.05).
For example, among the five example rule candidates with Toileting given in Table 2, only
𝐻!",! →𝐴!"#$%&#'(,! (𝑐𝑓 =0.365, 𝑝!"#!$%!& =
0.002) was selected as an expected association rule and none as an unexpected association rule. An example of a rule candidate that was selected
as an unexpected rule is
𝐴!"#$%&#'(,!!! ⋀ 𝐻!",! →𝐴!"#$%_!"#$/!",!
( 𝑐𝑓 =0.044, 𝑝!"#$%#&'#(=0.028 ). Those numbers come from the counting of all the 21 days of data available for user B.
4
The data-to-text pipeline
To generate a report from the ADL data for a given period, we roughly follow a standard data-to-text pipeline (Reiter, 2007). Since we take as input the ADL labels, we do not have to analyse the underlying sensor signals. Therefore we begin with data interpretation, which consists of finding instances of the previously selected asso-ciation rules in the input. For each of those, one or more logico-semantic relations are introduced as part of a hypothetic interpretation of the input data.
Following Bouayad-Agha et al. (2012), in this paper the term logico-semantic relation desig-nates very abstract semantic relations between eventualities that are independent from pragmat-ic factors. They are to be distinguished from rhe-torical relations in the sense of the Rherhe-torical Structure Theory (RST) (Mann and Thompson, 1987), which have an intentional load. According to Kosseim and Lapalme (2000), the many-to-many mapping between semantic relations and rhetorical relations requires placing them into separate representation levels in an NLG system.
Next the logico-semantic relations are used to plan the document as a whole in the document planning stage. The output is a rhetorical struc-ture featuring rhetorical relations. Follows the microplanning stage that plans the phrases and lexical units expressing the events and rhetorical relations. This produces a lexico-syntactic speci-Count for value i of variable X: 𝑚(𝑋!) Total count for variable X: 𝑛(𝑋)=∑!𝑚(𝑋!) Probability for value i of variable X: 𝑃(𝑋!)=!(!!)
!(!)
Joint count for values i,j of left (L) and right (R) parts of association rule 𝐿! →𝑅!: 𝑚!𝐿!,𝑅!! Total joint count for an association rule of type 𝐿→𝑅: 𝑛(𝐿,𝑅)=∑!,!𝑚!𝐿!,𝑅!!
Frequency of an association rule 𝐿! →𝑅!: 𝑓𝑟!𝐿! →𝑅!!=𝑃!𝐿!,𝑅!!=!!(!,!!!!,!)!!
Confidence of an association rule 𝐿! →𝑅!: 𝑐𝑓!𝐿! →𝑅!! =𝑃!𝑅!|𝐿!!=!!!!!(,!!! !!)
Significance (p-value using the binomial distribution) of 𝐿! →𝑅!:
𝑝!𝐿! →𝑅!!= ! !𝑛(𝐿𝑙,𝑅)!!𝑃(𝐿!)𝑃!𝑅!!! !
!1−𝑃(𝐿!)𝑃!𝑅!!! !(!,!)!! !!"#
!!!!"#
With 𝑙!"#=𝑚!𝐿!,𝑅!! and 𝑙!"# =𝑚(𝐿!) for an expected association !𝑝!"#!$%!&!
[image:4.595.69.526.68.276.2]and 𝑙!"# =0 and 𝑙!"#=𝑚!𝐿!,𝑅!! for an unexpected association !𝑝!"#$%#&'#(!.
fication that is realised as natural language text in the last stage: surface realisation.
In our case there is one more operation, which takes place between document planning and mi-croplanning: summarisation. Here the rhetorical structure is pruned to keep only the most im-portant events and relations. This produces a summary of the initially planned text.
The five pipeline stages are thus in order: data interpretation, document planning, summarising, microplanning and surface realisation. The fol-lowing sections describe them in more detail.
5
Data interpretation
In data interpretation, each activity and its con-text in the input ADL sequence are examined to find instances of application of an association rule. When there is a match, the algorithm postu-lates one or more corresponding logico-semantic relations and adds them to the document content. When an expected association instance is found, a pseudo-causal relation is created between the left and right part of the rule. It is not necessary that the relation really be a direct causation. More precisely, the relation could be paraphrased as: It does not seem a coincidence that this event is followed by that event. The real explanation may be much more complex. For short, we will retain the terms cause and result. For example, in the example day of Table 1, the third activity matches the expected rule 𝐻!",! →𝐴!"#$%&#'(,!.
1) Hour of Day 10 causes Toileting 10:17 When an unexpected association instance is found (including associations never encountered before), an unexpected result relation is created. For example, from Table 1 the following two relations are created from the unexpected rule 𝐴!"#$%&#'(,!!! ⋀ 𝐻!",! →𝐴!"#$%_!"#$/!",!.
2) Toileting 10:17 unexpectedly results in Spare_Time/TV 10:19
3) Hour of Day 10 unexpectedly results in Spare_Time/TV 10:19
In addition, an instead relation is created with the best available prediction of what activity would have been expected in the same context, according to the expected association rules:
4) Spare_Time/TV 10:19 instead of Grooming When the left part of the association rule in-cludes the hour of the day variable and a match is found, a time mention is introduced and added to the document content. This time mention refer-ences the start time of the corresponding activity. The algorithm also introduces a repetition re-lation when the activity type in the right part of a
matching association rule is included in its left part. For example, because of a match of ex-pected rule 𝐴!"##$%&',!!!→𝐴!"##$%&',!, a rep-etition relation is created:
5) Grooming 16:03 is a repetition of Groom-ing 16:01
To be able later to compare the importance of activities, time mentions and relations, a proba-bility is assigned to each of them. The probabil-ity of a logico-semantic relation is the confidence of the corresponding matching association rule. For example, relation 1 is assigned as probability
𝑐𝑓 𝐻!",! →𝐴!"#$%&!"#,! =0.365. An activity at
the right side of one or more matching associa-tion rules is assigned as probability the highest confidence of those association rules. This prob-ability is called posterior probprob-ability, in the sense that it takes into account the context (the left side of the rules). For example, Toileting 10:17 is assigned probability 0.365. For other activities, the prior probability is used, that is, the frequen-cy without looking at the context. For example, Showering 11:30 does not correspond to the right side of any matching association rules and so it is assigned as probability its frequency. Time men-tions use the frequency of the hour of the day.
6
Document planning
In this experiment, document planning and mi-croplanning are done in essentially the same way as proposed by Vaudry and Lapalme (2015). The main difference is that there are only two types of eventualities: activity and hour of the day. This leads to a lesser number of causal and un-expected result subtypes (those subtypes are dif-ferentiated by the type of their arguments). On the other hand, we use two logico-semantic rela-tions not mentioned in Vaudry and Lapalme (2015) : instead and repetition.
Document planning is done in four steps: deri-vation of additional logico-semantic relations, building of an unordered tree structure by clus-tering, logico-semantic to rhetorical relation mapping, and ordering of the tree. The following subsections describe each of them.
6.1 Deriving additional logico-semantic re-lations
eventuali-ties, only the addition of conjunction relations was relevant for this experiment.
A conjunction relation applies to items that play a comparable role (Mann and Taboada, 2005). In the case of a logico-semantic network, this can be interpreted as the following: if two or more eventualities e1, e2, ..., en that are part of the
same type of logico-semantic relation r with an-other eventuality e0, then they can be said to be
in a relation of conjunction with each other. For example, if two activities are hypothesised to be caused by the same preceding activity, they are in a conjunction relation.
6.2 Clustering
The first step in document planning is to build an unordered tree structure by performing agglom-erative hierarchical clustering. This is parameter-ized by adjacency preferences. Those must be specified for the instead and repetition relations, as well as for the causal and unexpected result relation subtypes resulting from data interpreta-tion. Adjacency preferences are expressed in terms of how much a given relation prefers to have its arguments appear in the same sentence, the same paragraph or another paragraph.
The adjacency preferences used in the ADL report generation are presented in Table 3. They reflect the following choices. A time mention coming from a relation between the hour of the day and an activity must be mentioned very close to that activity so as not to generate ambiguity. Two related activities can be mentioned in sepa-rate sentences with the appropriate markers, ex-cept for the instead relation which calls for greater proximity. This makes for relatively short sentences. The conjunction relation must appear one level deeper in the tree than its related
rela-tion to avoid ambiguity.
In our experiment, average linkage clustering is used. The distance between two eventualities is computed from the average of the adjacency preferences of the logico-semantic relations holding between them. The more a relation pre-fers to have its arguments adjacent, the smaller the distance. When no logico-semantic relation holds between two eventualities, the sum of dis-tances on the shortest path between them is used. If no such path exists, then the maximal distance is assigned. The temporal distance relative to the total duration of the period to be narrated is also taken into account, although with a low weight. In this way temporal distance helps order even-tuality pairs that would have the same distance otherwise. For example, suppose activities A and B on one hand, and B and C on the other hand, have between them the same logico-semantic relation(s). If B is temporally closer to A than to C, this will tip the balance so that A and B will be clustered together first. At each iteration, the two closest clusters are merged to form a new cluster, until all clusters are merged into one. The resulting hierarchy forms the basis of the rhetori-cal structure.
Looking up the logico-semantic relations giv-en in section 5, relation 2 has a lower adjacgiv-ency preference than relation 3. This means that Spare_Time/TV 10:19 will be clustered with Hour of Day 10 before being clustered with Toi-leting 10:17. Also, Toileting 10:17 will be in a different sentence than Spare_Time/TV 10:19.
6.3 Logico-semantic to rhetorical mapping The second step is to map each logico-semantic relation to a rhetorical relation with respect to communicative constraints.
Logico-semantic relation Adjacency preference
Rhetorical relation(s)
Satellite
Activity causes activity 0.60 Sequence n/a (multinuclear) Hour of day causes activity 1.00 Circumstance first argument Activity unexpectedly results in activity 0.60 Sequence,
Concession
n/a (multinuclear), first argument Hour of day unexpectedly results in activity 0.90 Concession first argument Instead 0.95 Instead second argument Conjunction (with p the adjacency preference of
the relation that the coordinates have in common)
1.50×p Conjunction n/a (multinuclear)
Generating a factual report such as an ADL report requires caution. There is no guarantee that the extracted association rules translate di-rectly to causal relations. Therefore we judged it was appropriate to simply suggest a possible un-named relation between the arguments of logico-semantic causal or unexpected result relations. Bouayad-Agha et al. (2012, p. 3:9) observed that a neutral perspective could be obtained by using a rhetorical temporal circumstance instead of a rhetorical cause. We also used the rhetorical temporal sequence relation for the same reason. This is because the presence of a causal relation implies that the cause precedes the effect. Thus, when a temporal relation is explicitly mentioned, it can suggest a possible causal relation without it being logically implied.
Except in the case of multinuclear relations, the parameters specifying the logico-semantic to rhetorical mapping must include how to choose which logico-semantic argument will be the rhe-torical nucleus and which will be the satellite. According to RST, in a rhetorical argument pair, the nucleus is the one that is more essential to the writer’s purpose and the other is termed the satel-lite. For example, the logico-semantic relation hour of day causes activity is expressed implicit-ly by putting forward the activity and mentioning the hour of day as only a rhetorical circumstance. The activity is judged more important because the central character of the narrative accomplish-es it. Some relations such as contrast or sequence are considered multinuclear, which means that neither argument is more essential than the other (Mann and Thompson, 1987, pp. 31–38). Two observed activities are a priori no more im-portant than the other; therefore the sequence rhetorical relation is used as a temporal relation between activities.
The parameters used for the logico-semantic to rhetorical mapping for the generation of the ADL report are presented in Table 3.
6.4 Ordering
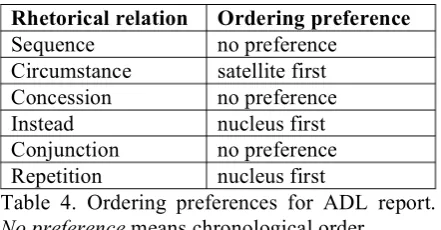
Ordering preferences are specified for each type of rhetorical relation in terms of which of the satellite or the nucleus tends to come first and how strong this tendency is. The ordering prefer-ences used in this experiment for the generation of the ADL report are presented in Table 4. In addition, a temporal ordering preference speci-fies to what extent chronological or reverse chronological order should be followed. In this experiment, chronological order was preferred.
During ordering, the ordering preferences as-sociated with the rhetorical and temporal rela-tions are treated similarly to the adjacency pref-erences in the clustering step. Sibling clusters in the hierarchy produced by the clustering are or-dered by averaging the ordering preferences of all the relations holding between them. For this purpose, a nucleus first preference has a value of 1.0 while a satellite first preference has a value of -1.0. The result of this step is an ordered tree.
7
Summarisation
To summarise the ADLs of a given period, we retain the most important facts from the rhetori-cal tree. At first we used the minimum tree depth at which a leaf is promoted as a criteria to gener-ate a partial ordering of the eventualities (Marcu, 2000). The promotion set of a text span is the union of the promotion sets of its nuclei, except if it is a leaf. The promotion set of a leaf is the singleton containing only the leaf itself. This method gave interesting results, but tended to eliminate potentially anomalous facts that were located deep in the tree. This happened often be-cause interesting logico-semantic relations tend-ed to occur between the firstly creattend-ed clusters, which placed them deep in the resulting tree.
Since the goal is to produce a report of unusu-al facts, we suppose that less typicunusu-al facts are more important. Following this hypothesis, we used the probability according to the extracted association rule set as a measure of importance. As mentioned in section 5, the probability of an eventuality that does not appear in the right part of an instance of an association rule is its prior probability. Otherwise, it is the best prediction (the highest probability) given by those associa-tion rules, i.e. the posterior probability. A satel-lite text span was included in the summary if the probability of its promoted eventuality or the minimum probability of its relations with the nucleus was below a certain threshold. Other-wise, only the nucleus was kept. This method had the benefit of pruning less important text spans regardless of their depth in the tree.
Rhetorical relation Ordering preference Sequence no preference
Circumstance satellite first Concession no preference Instead nucleus first Conjunction no preference Repetition nucleus first
[image:7.595.305.526.69.184.2]For example, with a threshold of 0.4, Groom-ing 11:39 will be pruned, because the relation Showering 11:30 causes Grooming 11:39 has probability 0.91. We can assume the reader can infer the grooming from the preceding showering if he is already familiar with user B's routine.
8
Microplanning and realisation
During microplanning, the rhetorical structure is translated into a lexico-syntactic specification. For this the microplanning algorithm traverses the document plan tree depth-first. When a leaf is visited, a specification of a description of the corresponding eventuality is produced from lexi-co-syntactic templates. When an internal node is visited, the rhetorical relations that link the two children nodes are expressed with appropriate discourse markers. The marker (or absence of marker) depends on the rhetorical relation and the aggregation level (same sentence, same para-graph or other parapara-graph). Those markers are then used to assemble the lexico-syntactic speci-fications obtained from the children nodes.
For now, only the rhetorical relations holding between the promoted leaves of the two children nodes are taken into account. When there are none, in the future we plan to take other relations between the two children nodes into account. Our hypothesis is that it could lead to more co-herent texts provided that anaphora is used judi-ciously to avoid adding ambiguity.
Sentence and paragraph segmentation are a function of clustering distance. The latter reflects adjacency preferences, which are defined in terms of sentences and paragraphs.
Surface realization was performed using the SimpleNLG-EnFr Java library (Vaudry and Lapalme, 2013). During surface realization, the syntactic and lexical specifications are combined with the output language grammar and lexicon to generate formatted natural language text. Be-cause SimpleNLG-EnFr can realise text in both English and French, we were able to generate a report in both languages. For that a version of the lexico-syntactic templates used in microplanning had to be written for each language.
9
Results
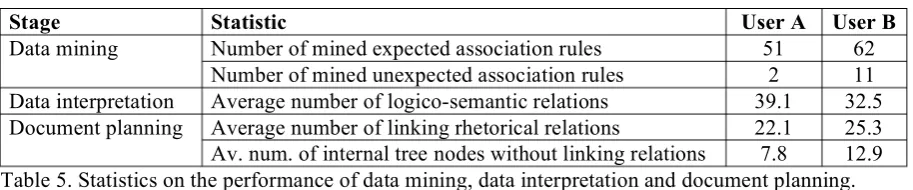
Table 5 presents some statistics on the perfor-mance of the data mining, data interpretation and document planning stages. Data interpretation and document planning were tested by generat-ing one report per 24-hour period in the ADL data for each user. We can note that not all mined association rules apply each day. Moreo-ver, not all logico-semantic relations were trans-lated to a rhetorical relation in the rhetorical structure. This leads to a number of text spans being clustered together without a linking rhetor-ical relation. Those correspond mostly to the tree nodes closest to the root of the tree.
The example report of Figure 2 was generated from the data of Table 1. The maximum proba-bility threshold used for summarisation was 0.4. At the top is displayed the start and end time of the period considered for the report. The
dis-Saturday, 24 November 2012 10:04 AM - Sunday, 25 November 2012 09:24 AM
--- At 10:04 AM he ate his breakfast.
13 minutes later at 10:17 AM he went to the toilet. Then, nevertheless he spent time in the living room although it was 10:19 AM.
1 hour later at 11:16 AM he had a snack. 14 minutes later he took a shower. 1 hour later he went to the toilet. 8 minutes later he had a snack. 2 hours later he left.
1 hour later at 4:00 PM he went to the toilet. Then he groomed and at 4:02 PM went to the toilet. Then he groomed again.
1 minute later he spent time in the living room.
4 hours later he had a snack.
2 hours later he went to the toilet and at 10:02 PM spent time in the living room. Then at 10:17 PM he dined.
1 hour later he had a snack.
1 hour later he spent time in the living room.
Figure 2. ADL report generated from Table 1 with a maximum probability threshold of 0.4.
Stage Statistic User A User B
[image:8.595.71.528.67.162.2]course markers (at, although, then, nevertheless, and, again) express the rhetorical relations that hold between sibling text spans in the rhetorical tree. The only exception is the default marker in the form of X time later that is used when no such relation exists between two text spans.
Out of 18 activities, 8 are mentioned singly in their own paragraph, without a discourse marker other than the default one. In other words, almost half of the mentioned activities are not connected closely to another part of the text. Paragraphs that do contain more than one activity have their content internally connected with discourse markers. However, they are not connected with the other paragraphs. This is consistent with the statistics of Table 5. From this we conclude that although the generated text expresses some rhe-torical relations locally, it fails to explicitly achieve global coherence. This may leave a heavy burden on the reader in forming a repre-sentation of what happened during that day. Ana-lysing the proposed data-to-text pipeline, there are several places where this may be improved.
Before generation itself, data mining could search for more diverse types of association rules so that more logico-semantic relations could be created during data interpretation. One possibil-ity is to mine for associations where the implica-tion goes backward in time, in order to indirectly capture underlying goals. For example: He went to the toilet before going to bed. (He went to the toilet because he wanted to go to bed.) Going to the toilet may not imply going to bed afterwards, but going to bed may imply having probably gone to the toilet beforehand. Moreover, associa-tions where the implication goes in both direc-tions should then be treated differently. They should probably be expressed as a conjunction.
A problem is that the summarisation stage has the effect of removing relations with a probabil-ity higher than the threshold. So the more we summarise, the less coherent the text may be-come. A possible solution to explore would be to select important relations and events based on logico-semantic relations alone, before document planning.
Maybe the key to achieve coherence at a high-er level would be to detect more abstract eventu-alities and relations in the data. Those more ab-stract eventualities, such as routines, would in-clude more concrete ones, like activities. This would create a hierarchy that could be used to build texts that are coherent at a higher level.
In a different vein, we did not concentrate our efforts on microplanning and it could certainly
be improved. For example, as the input data is in the form of temporal intervals, the text could possibly be improved if the ADLs were de-scribed in the same way instead of as specific points in time.
10
Conclusion
We designed and implemented a method that extracts association rules from ADL data and uses them for the data-to-text generation of unu-sual fact reports. The extracted association rules were used to locally to link eventualities with rhetorical relations. However, more work will be needed to see how they could be used to enhance the global coherence of generated texts.
Future work will consist first of systematically testing different values for the confidence and significance thresholds with different datasets. Richer, bigger and more varied datasets could lead to more interesting rules being learned and more real anomalies being found. Then we will explore possible improvements, such as mining for more diverse types of association rules and detecting more abstract eventualities in the data. We will also try shifting summarization before document planning.
In this work, we have focused on providing a summary of a single factual time interval, as op-posed to generating a summary of a typical (but necessarily fictitious) day. The latter is an inter-esting and complementary idea, but the extracted associations presented were not designed to do this kind of prediction. Moreover, the training data available may be insufficient to do this ac-curately enough. Incorporating recent work on activity prediction, such as Minor et al. (2015), is an avenue that should be explored.
A more thorough evaluation, including an ap-propriate baseline, will also be needed to see if the generated texts are perceived as more coher-ent and more useful for their intended role than with other generation methods.
References
Emmon Bach. 1986. The algebra of events. Linguis-tics and philosophy, 9(1):5–16.
Nadjet Bouayad-Agha, Gerard Casamayor, Simon Mille, and Leo Wanner. 2012. Perspective-oriented Generation of Football Match Summaries: Old Tasks, New Challenges. ACM Trans. Speech Lang. Process., 9(2):3:1–3:31, August.
Al-gorithms, and First Experimental Results. IEEE Transactions on Information Technology in Bio-medicine, 14(2):274–283, March.
Pablo Gervás. 2014. Composing narrative discourse for stories of many characters: A case study over a chess game. Literary and Linguistic Computing, August.
Catalina Hallett. 2008. Multi-modal presentation of medical histories. In Proceedings of the 13th inter-national conference on Intelligent user interfaces, pages 80–89.
W. Hamalainen and M. Nykanen. 2008. Efficient Dis-covery of Statistically Significant Association Rules. In ICDM ’08 Proceedings of the 2008 Eighth IEEE International Conference on Data Mining, pages 203–212. December.
James Hunter, Yvonne Freer, Albert Gatt, Ehud Reiter, Somayajulu Sripada, and Cindy Sykes. 2012. Automatic generation of natural language nursing shift summaries in neonatal intensive care: BT-Nurse. Artificial intelligence in medicine. Leila Kosseim and Guy Lapalme. 2000. Choosing
Rhetorical Structures To Plan Instructional Texts.
Computational Intelligence, 16(3):408–445.
Junseok Kwon and Kyoung Mu Lee. 2012. A unified framework for event summarization and rare event detection. In CVPR, pages 1266–1273.
P. Lalanda, J. Bourcier, J. Bardin, and S. Chollet. 2010. Smart Home Systems. Grenoble University, France.
Anna S Law, Yvonne Freer, Jim Hunter, Robert H Logie, Neil McIntosh, and John Quinn. 2005. A comparison of graphical and textual presentations of time series data to support medical decision making in the neonatal intensive care unit. Journal of clinical monitoring and computing, 19(3):183– 194, June. PMID: 16244840.
William C. Mann and Maite Taboada. 2005. Rhetori-cal Structure Theory : Relation definitions. Re-trieved August 26, 2014, from http://www.sfu.ca/rst/01intro/definitions.html William C. Mann and Sandra A. Thompson. 1987.
Rhetorical structure theory: A theory of text organ-ization. University of Southern California, Infor-mation Sciences Institute.
Daniel Marcu. 2000. The theory and practice of dis-course parsing and summarization. MIT Press, Cambridge, Massachusetts, USA.
A. McKinlay, C. McVittie, E. Reiter, Y. Freer, C. Sykes, and R. Logie. 2009. Design Issues for So-cially Intelligent User Interfaces: A Discourse Analysis of a Data-to-text System for Summarizing Clinical Data. Methods of Information in Medicine, 49(4):379–387, December.
Bryan Minor, Janardhan Rao Doppa, and Diane J. Cook. 2015. Data-Driven Activity Prediction: Al-gorithms, Evaluation Methodology, and Applica-tions. In Proceedings of the 21th ACM SIGKDD International Conference on Knowledge Discovery and Data Mining, pages 805–814. ACM Press. Marco Munstermann, Torsten Stevens, and Wolfram
Luther. 2012. A Novel Human Autonomy Assess-ment System. Sensors, 12(6):7828–7854, June. Fco Javier Ordóñez, Paula de Toledo, and Araceli
Sanchis. 2013. Activity Recognition Using Hybrid Generative/Discriminative Models on Home Envi-ronments Using Binary Sensors. Sensors, 13(5):5460–5477, April.
François Portet, Ehud Reiter, Albert Gatt, Jim Hunter, Somayajulu Sripada, Yvonne Freer, and Cindy Sykes. 2009. Automatic generation of textual summaries from neonatal intensive care data. Arti-ficial Intelligence, 173(7):789–816.
Ehud Reiter. 2007. An Architecture for Data-to-text Systems. In Proceedings of the Eleventh European Workshop on Natural Language Generation, pages 97–104, Stroudsburg, PA, USA. Association for Computational Linguistics.
Ivo Swartjes and Mariët Theune. 2006. A fabula model for emergent narrative. In Technologies for Interactive Digital Storytelling and Entertainment, pages 49–60. Springer.
Mariët Theune, Nanda Slabbers, and Feikje Hielkema. 2007. The Narrator: NLG for digital storytelling. In
Proceedings of the Eleventh European Workshop on Natural Language Generation, pages 109–112. Association for Computational Linguistics.
Tom Trabasso, Paul Van den Broek, and So Young Suh. 1989. Logical necessity and transitivity of causal relations in stories. Discourse Processes, 12(1):1–25.
Pierre-Luc Vaudry and Guy Lapalme. 2013. Adapting SimpleNLG for bilingual English-French realisa-tion. In Proceedings of the 14th European Work-shop on Natural Language Generation, pages 183– 187, Sofia, Bulgaria, August. Association for Computational Linguistics.
Pierre-Luc Vaudry and Guy Lapalme. 2015. Causal networks as the backbone for temporal data-to-text. Presented at the First International Workshop on Data-to-Text Generation, Edinburgh, United-Kingdom, March.