R E S E A R C H
Open Access
Persistently high venous-to-arterial carbon
dioxide differences during early resuscitation are
associated with poor outcomes in septic shock
Gustavo A Ospina-Tascón
1,2*, Diego F Bautista-Rincón
1, Mauricio Umaña
1, José D Tafur
1, Alejandro Gutiérrez
1,
Alberto F García
1, William Bermúdez
2, Marcela Granados
1, César Arango-Dávila
2and Glenn Hernández
3Abstract
Introduction:Venous-to-arterial carbon dioxide difference (Pv-aCO2) may reflect the adequacy of blood flow during
shock states. We sought to test whether the development of Pv-aCO2during the very early phases of resuscitation
is related to multi-organ dysfunction and outcomes in a population of septic shock patients resuscitated targeting the usual oxygen-derived and hemodynamic parameters.
Methods:We conducted a prospective observational study in a 60-bed mixed ICU in a University affiliated Hospital. 85 patients with a new septic shock episode were included. A Pv-aCO2 value≥6 mmHg was considered to be high. Patients were classified in four predefined groups according to the Pv-aCO2 evolution during the first 6 hours of resuscitation: (1) persistently high Pv-aCO2 (high at T0 and T6); (2) increasing Pv-aCO2 (normal at T0, high at T6); (3) decreasing Pv-aCO2 (high at T0, normal at T6); and (4) persistently normal Pv-aCO2 (normal at T0 and T6). Multiorgan dysfunction at day-3 was compared for predefined groups and a Kaplan Meier curve was constructed to show the survival probabilities at day-28 using a log-rank test to evaluate differences between groups. A Spearman-Rho was used to test the agreement between cardiac output and Pv-aCO2. Finally, we calculated the mortality risk ratios at day-28 among patients attaining normal oxygen parameters but with a concomitantly increased Pv-aCO2.
Results: Patients with persistently high and increasing Pv-aCO2 at T6 had significant higher SOFA scores at day-3
(p < 0.001) and higher mortality rates at day-28 (log rank test: 19.21, p < 0.001) compared with patients who evolved with normal Pv-aCO2at T6. Interestingly, a poor agreement between cardiac output and Pv-aCO2was observed (r
2
= 0.025, p < 0.01) at different points of resuscitation. Patients who reached a central venous saturation (ScvO)2≥70% or mixed
venous oxygen saturation (SvO2)≥65% but with concomitantly high Pv-aCO2at different developmental points (i.e., T0,
T6 and T12) had a significant mortality risk ratio at day-28.
Conclusion:The persistence of high Pv-aCO2 during the early resuscitation of septic shock was associated with
more severe multi-organ dysfunction and worse outcomes at day-28. Although mechanisms conducting to increase Pv-aCO2 during septic shock are insufficiently understood, Pv-aCO2 could identify a high risk of death in apparently
resuscitated patients.
* Correspondence:gusospin@gmail.com
1Intensive Care Unit, Fundación Valle del Lili, Av. Simón Bolívar Cra. 98, Cali,
Colombia
2Biomedica Research Group, Universidad ICESI, Cali, Colombia
Full list of author information is available at the end of the article
Introduction
Inadequate tissue perfusion is a pivotal factor in the pathogenesis and clinical course of multiorgan failure in the critically ill [1]. Current techniques for monitoring tissue perfusion have largely focused on systemic blood flow and the balance between oxygen demand and supply [2,3]. An early hemodynamic optimization that targets central venous oxygen saturation (ScvO2) and systemic hemodynamic parameters improves outcomes in severe sepsis and septic shock [4], reinforcing the idea that tissue perfusion abnormalities are flow dependent at least dur-ing the very early stages. However, normalizdur-ing systemic hemodynamic parameters does not guarantee adequate tissue perfusion [5-7], and in fact a substantial number of patients still progress to multiorgan dysfunction and death despite meeting ScvO2 targets [4].
In the past, authors described the coexistence of venous acidemia and increased venous carbon dioxide (CO2) dur-ing cardiac arrest in both animals [8] and critically ill humans [9]. Thereafter, increases in the venous-to-arterial carbon dioxide difference (Pv-aCO2) were reported during hypovolemic, cardiogenic, obstructive, and septic shock [10-12]. Interestingly, an inverse curvilinear relation-ship between Pv-aCO2and cardiac output was described, highlighting the importance of blood flow on venous CO2 accumulation [13,14]. Pv-aCO2thus aroused clinical inter-est as a marker of global perfusion during shock states, although some studies questioned its prognostic value [14]. In fact, some in vivo models evaluating the mechanisms conducting to venous CO2 accumulation during non-inflammatory conditions [15-17] challenged the ability of Pv-aCO2 to identify tissue dysoxia because it only rises during ischemic hypoxia, but not during hypoxic or anemic hypoxia for comparable declines in oxygen delivery and oxygen consumption. However, more recent data sug-gest that high Pv-aCO2 could identify septic patients who remain inadequately resuscitated despite achieving oxygen metabolism targets, reinforcing the notion of Pv-aCO2as a marker of global perfusion due to its ability to track blood flow alterations [18] or even detect anaerobic CO2generation [19]. Furthermore, patterns of recovery or derangement of Pv-aCO2during very early stages of resus-citation of septic shock have not been widely described and recent studies trying to demonstrate the reliability of Pv-aCO2as a tool in resuscitation of septic patients could have been influenced by selection bias because not all po-tential patients were elected to catheter insertion and goal-directed therapy [20,21].
Recent publications in critical care demonstrate that oxygen-derived parameters such as ScvO2or mixed ven-ous oxygen saturation (SvO2) are commonly normalized at ICU admission [22] and maneuvers such as emergent intubation can quickly improve ScvO2 despite regional and tissue perfusion derangements [23]. Because global
and regional hypoperfusion have been incriminated in the development of multiple organ failure, investigation on surrogate markers of such phenomenon remains im-portant in critical care. Given that Pv-aCO2 can track the adequacy of systemic perfusion during shock states, we sought to test whether the time course of Pv-aCO2 during the early phases of resuscitation is related to the development of more severe multiorgan dysfunction and worse outcomes in a population of septic shock patients resuscitated by targeting the usual oxygen-derived and hemodynamic parameters.
Materials and methods
This prospective observational study was performed in a 60-bed mixed ICU in a university-affiliated hospital. We examined all patients with a new septic shock episode admitted to the emergency room or proceeding from clinical wards during a 24-month period. Septic shock was defined using the criteria of the American College of Chest Physicians and the Society of Critical Care Medicine Consensus Conference [24]. Patients were excluded if they were younger than 18 years old, pregnant, had severe chronic obstructive pulmonary disease (GOLD 3 and 4 cat-egories according to the current classification at the time of our study) or advanced liver cirrhosis (Child–Pugh C).
General management
All patients admitted to the emergency room or proceed-ing from clinical wards who fulfilled the diagnosis criteria for septic shock were evaluated by the ICU rapid response team according to our local procedures. Each patient was equipped with an arterial cannula and a pulmonary artery catheter (CCO Swan–Ganz catheter; Edwards Life sciences, Irvine, CA, USA). Our early goal-directed therapy included a bundle of interventions that sought to obtain: mean arterial pressure ≥65 mmHg; urine output≥0.5 ml/kg/minute; normalization of serum lactate; and ScvO2≥70% or SvO2≥65%. The use of vasopressors (dopamine or norepinephrine) was standardized to main-tain a mean arterial pressure ≥65 mmHg, and repeated fluid challenges with crystalloids or colloids were used to optimize the stroke volume as well as to allow the lowest dose of vasopressors and pulse-pressure variability <12%.
Dobutamine was added for persistent ScvO2 ≤70%
Study protocol
The Fundación Valle del Lili’s Ethical and Biomedical re-search committee approved the current study. A written informed consent was waived because no new therapeutic interventions were performed and all measurements and procedures routinely followed the local protocols for the management of severe sepsis and septic shock.
Time 0 (T0) was declared when the pulmonary artery catheter was inserted using common monitoring trac-ings to place the distal port in the pulmonary artery and the proximal port in the right atrium, approximately 3 cm above the tricuspid valve. In order to standardize T0, we recorded the total volume of fluids administered and the time elapsed between the start of resuscitation (first hypotension episode) and the pulmonary artery catheter insertion (T0).
We collected arterial venous blood samples and cen-tral and mixed venous blood samples for arterial–venous gases (ABL 300; Radiometer Copenhagen, Denmark) and arterial lactate measurements at T0, and 6 hours (T6), 12 hours (T12) and 24 hours (T24) later. We sim-ultaneously registered hemodynamic and respiratory var-iables at each measurement. We defined Pv-aCO2as the difference between the mixed venous CO2partial pressure and the arterial CO2 partial pressure. Previous studies considered Pv-aCO2≥6 mmHg abnormal [14]. Hence, we classified the patients according to the Pva-CO2 develop-ment during the first 6 hours of resuscitation: persistently high Pv-aCO2(high at T0 and T6); increasing Pv-aCO2 (normal at T0, high at T6); decreasing Pv-aCO2(high at T0, normal at T6); and persistently normal Pv-aCO2 (normal at T0 and T6). The Sequential Organ Failure Assessment score [26] was used to describe multiorgan dysfunction at day 3 and we also described mortality at day 28 for the pre-defined groups.
Data analysis
After exclusion of a normal distribution of the data by the Kolmogorov–Smirnov test, we used a Kruskal–Wallis test to compare continuous variables (followed by Bonferroni correction for multiple comparisons) and a chi-squared test (or Fisher’s exact test, when appropriate) for discrete variables. Survival probabilities at day 28 were described using a Kaplan–Meier curve and differences between groups were calculated using a log-rank test before and after adjusting for SvO2 at T6. The development of SvO2, ScvO2, lactate, cardiac output, mean arterial pressure and Pv-aCO2 during the first 24 hours were analyzed using a repeated-measures analysis of vari-ance. Spearman’s rho was used to test the agreement between cardiac output and Pv-aCO2. We also calcu-lated the mortality risk ratios at day 28 in patients who attained ScvO2≥70% or SvO2≥65% but maintained persistently high Pv-aCO2 at different points during
resuscitation (T0, T6, and T12). Data were expressed as medians and 25 to 75% interquartile ranges.P≤0.05 (two-tailed) was considered significant.
Results
During the 24-month period, 108 patients older than 18 years with a new episode of septic shock were screened. Patients with advanced cirrhosis (n = 4), patients with severe chronic obstructive pulmonary disease (n= 8) and pregnant women (n = 4) were not included for analysis; additionally, a central catheter could not be placed in four patients, and three refused the procedure. The final sample was therefore 85 patients. The median length of ICU stay for all patients was 6 days (25 to 75% interquartile range, 3 to 11 days), and the 28-day mortality rate was 37.6%. The median time elapsed from sepsis-induced hypotension to catheter insertion was 3.0 hours (25 to 75% interquartile range, 1.0 to 4.0 hours) and the median volume of fluids received before catheter insertion was 2,079 ml (25 to 75% interquartile range, 1,184 to 3,135 ml) for all patients.
Thirty-six patients had Pv-aCO2 <6.0 mmHg at T0 and T6, and 17 patients had a high PvaCO2at T0 but it fell below 6 mmHg at T6 (a total of 53 patients had Pv-aCO2 <6 mmHg at T6); on the other hand, 24 patients had a persistently high Pv-aCO2 during the first 6 hours and the remaining eight evolved from normal at T0 to high PvaCO2 at T6 (32 patients had Pv-aCO2 ≥6 mmHg at T6).
We did not find any significant difference with regard to Acute Physiology and Chronic Health Evaluation II score, comorbidities, demographics, or respiratory and hemodynamic variables between groups (Tables 1 and 2), and neither for the volume of fluids received before inclu-sion (T0). Doses of vasopressors or inotropic received were similar for the groups both at T0 and T6 (Table 2). Multiorgan dysfunction at day 3 was significantly higher among patients with persistently high Pv-aCO2 com-pared with those with persistently normal or decreas-ing Pv-aCO2 during the first 6 hours of resuscitation (Kruskal–Wallis test,P<0.001) (Figure 1). Likewise, pa-tients with persistently high Pv-aCO2during the first 6 hours of resuscitation had a significant lower survival at day 28 compared with those who normalized Pv-aCO2during this period (log-rank, Mantel–Cox: 19.21,
P<0.001; Figure 2). These results were maintained after adjusting for the SvO2 achieved at T6 (log-rank test,
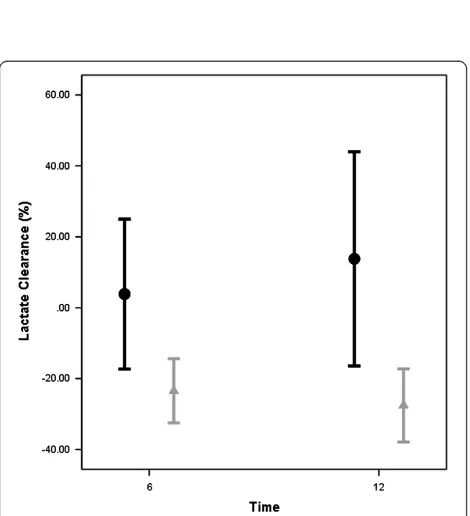
Patients with elevated Pv-aCO2at T6 had slower lac-tate clearances at T6 and T12 than patients attaining a normal Pv-aCO2 during the first 6 hours of resusci-tation (Figure 4). We also observed a significant linear correlation between mixed-venous to arterial pCO2and central-venous to arterial pCO2 (Pearson correlation: 0.71, 95% confidence interval: 0.47 to 0.86; P <0.001) but with moderate agreement between them (R2= 0.556,
P <0.001) (Figure 5). Additionally, significant differences
were observed for the time course of Pv-aCO2and central venous-to-arterial carbon dioxide difference (Pvc-aCO2) during the first 24 hours for survivor and nonsurvi-vors at day 28 (repeated-measures analysis of variance,
P = 0.003 and P = 0.03, respectively; Figure S4a,b in Additional file 1).
[image:4.595.60.538.101.582.2]Finally, patients who achieved ScvO2≥70% or SvO2≥ 65% but maintained high Pv-aCO2 at T0, T6 and T12 had a higher mortality risk at Day 28 (Table 3).
Table 1 Patient characteristics
Variable Group 1, H-H Group 2, L-H Group 3, H-L Group 4, L-L Pvalue
(n= 24) (n= 8) (n= 17) (n= 36)
Age (years) 63.0 (54.7 to 75.0) 63.5 (50.5 to 76.5) 55.0 (53.0 to 76.0) 62.0 (49.3 to 71.8) 0.83
Gender, male (%) 17 (70.8) 4 (50.0) 10 (58.8) 22 (61.1) 0.72
APACHE II 24.4 (21.2 to 26.0) 25.2 (21.0 to 27.0) 23.4 (21.2 to 25.6) 24.8 (22.2 to 25.8) 0.11
Time between diagnosis and catheter insertion (T0)
2.0 (2.0 to 4.0) 1.0 (1.0 to 3.3) 3.0 (1.0 to 4.0) 3.0 (2.0 to 4.0) 0.44
Fluids received before catheter insertion 2,039 (1,343 to 2,834) 1,934 (849 to 4,575) 2,500 (1,430 to 3,628) 2,000 (1,025 to 3,153) 0.76
Temperature (°C) 37.5 (37.2 to 37.9) 37.4 (37.1 to 37.9) 37.6 (37.0 to 38.0) 37.4 (37.4 to 37.8) 0.74
Hemoglobin (g/dl) 9.4 (8.7 to 11.6) 8.8 (7.4 to 11.4) 9.8 (9.1 to 11.4) 9.9 (9.1 to 11.4) 0.47
Source of infection,n(%)
Pneumonia 9 3 4 10
Abdominal 8 4 6 14
Urinary 2 1 3 4
Soft tissue 2 0 1 2
No specific site 3 0 2 4
Other 0 0 1 2
Culture positive,n(%) 20 (83.3) 5 (62.5) 12 (70.6) 19 (52.8) 0.11
Antibiotics given at T0,n(%) 24 (100) 7 (87.5) 16 (94.1) 32(88.9) 0.38
Antibiotics adequate,n(%) 23 (95.8) 7 (87.5) 16 (94.1) 27 (75.0) 0.10
Hydrocortisone,n(%) 22 (91.7) 8 (100) 15 (88.2) 31 (86.1) 0.68
Transfusion RBC,n(%) 4 (16.7) 3 (37.5) 3 (17.6) 4 (11.1) 0.35
Fluids and vasoactive agents
Fluids (ml), IQ 25 to 75
T0 2,039 (1,343 to 2,834) 1,934 (849 to 4,575) 2,500 (1,430 to 3,628) 2,000 (1,025 to 3,153) 0.76
T6 4,733 (3,196 to 6,360) 4,082 (1,576 to 7,584) 4,845 (2,550 to 6,560) 4,673 (3,380 to 7,348) 0.83
Norepinephrine (μg/kg/minute), IQ 25 to 75,n
T0 0.25 (0.19 to 0.36), 24 0.29 (0.14 to 1.20), 6 0.19 (0.10 to 0,37), 16 0.23 (0.10 to 0.38), 30 0.81
T6 0.20 (0.11 to 0.40), 24 0.36 (0.09 to 0.49), 6 0.12 (0.11 to 0.18), 15 0.19 (0.08 to 0.39), 31 0.45
Dopamine (μg/kg/minute), IQ 25 to 75,n
T0 – 7.1 (7.1 to 7.3), 2 10.7 (10.7 to 10.7), 1 5.1 (2.8 to 6.6), 5 0.14
T6 – – 8.0 (8.0 to 8.0), 1 5.3 (2.5 to 6.4), 4 0.16
Dobutamine (μg/kg/minute), IQ 25 to 75,n
T0 3.1 (2.7 to 4.5), 5 – 5.9 (5.1 to 6.7), 2 3.3 (3.0 to 4.2), 3 0.15
T6 3.1 (2.7 to 5.6), 3 – 5.1 (4.7 to 6.3), 4 3.8 (3.3 to 4.8), 3 0.21
H-H, venous-to-arterial carbon dioxide difference (Pv-aCO2) high at T0 and T6;L-H, Pv-aCO2normal at T0 and high at T6;H-L, Pv-aCO2high at T0 and normal at T6;
and L-L, Pv-aCO2normal at T0 and T6. APACHE, Acute Physiology and Chronic Health Evaluation; IQ 25 to 75, 25 to 75% interquartile range; RBC, red blood cells;
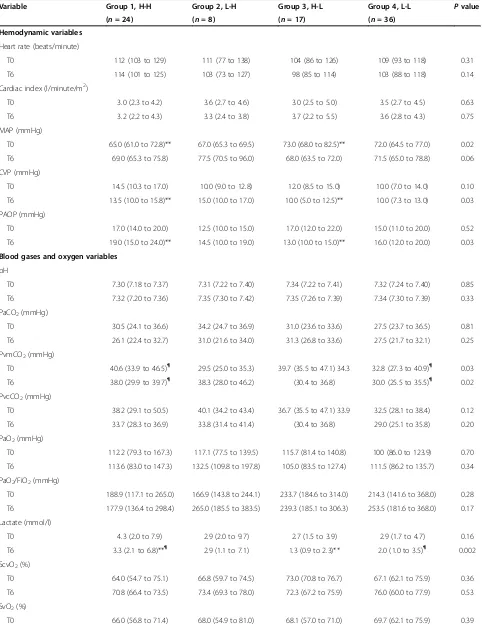
Table 2 Hemodynamic, oxygen and ventilatory parameters
Variable Group 1, H-H Group 2, L-H Group 3, H-L Group 4, L-L Pvalue
(n= 24) (n= 8) (n= 17) (n= 36)
Hemodynamic variables
Heart rate (beats/minute)
T0 112 (103 to 129) 111 (77 to 138) 104 (86 to 126) 109 (93 to 118) 0.31
T6 114 (101 to 125) 103 (73 to 127) 98 (85 to 114) 103 (88 to 118) 0.14
Cardiac index (l/minute/m2)
T0 3.0 (2.3 to 4.2) 3.6 (2.7 to 4.6) 3.0 (2.5 to 5.0) 3.5 (2.7 to 4.5) 0.63
T6 3.2 (2.2 to 4.3) 3.3 (2.4 to 3.8) 3.7 (2.2 to 5.5) 3.6 (2.8 to 4.3) 0.75
MAP (mmHg)
T0 65.0 (61.0 to 72.8)** 67.0 (65.3 to 69.5) 73.0 (68.0 to 82.5)** 72.0 (64.5 to 77.0) 0.02
T6 69.0 (65.3 to 75.8) 77.5 (70.5 to 96.0) 68.0 (63.5 to 72.0) 71.5 (65.0 to 78.8) 0.06
CVP (mmHg)
T0 14.5 (10.3 to 17.0) 10.0 (9.0 to 12.8) 12.0 (8.5 to 15.0) 10.0 (7.0 to 14.0) 0.10
T6 13.5 (10.0 to 15.8)** 15.0 (10.0 to 17.0) 10.0 (5.0 to 12.5)** 10.0 (7.3 to 13.0) 0.03
PAOP (mmHg)
T0 17.0 (14.0 to 20.0) 12.5 (10.0 to 15.0) 17.0 (12.0 to 22.0) 15.0 (11.0 to 20.0) 0.52
T6 19.0 (15.0 to 24.0)** 14.5 (10.0 to 19.0) 13.0 (10.0 to 15.0)** 16.0 (12.0 to 20.0) 0.03
Blood gases and oxygen variables
pH
T0 7.30 (7.18 to 7.37) 7.31 (7.22 to 7.40) 7.34 (7.22 to 7.41) 7.32 (7.24 to 7.40) 0.85
T6 7.32 (7.20 to 7.36) 7.35 (7.30 to 7.42) 7.35 (7.26 to 7.39) 7.34 (7.30 to 7.39) 0.33
PaCO2(mmHg)
T0 30.5 (24.1 to 36.6) 34.2 (24.7 to 36.9) 31.0 (23.6 to 33.6) 27.5 (23.7 to 36.5) 0.81
T6 26.1 (22.4 to 32.7) 31.0 (21.6 to 34.0) 31.3 (26.8 to 33.6) 27.5 (21.7 to 32.1) 0.25
PvmCO2(mmHg)
T0 40.6 (33.9 to 46.5)¶ 29.5 (25.0 to 35.3) 39.7 (35.5 to 47.1) 34.3 32.8 (27.3 to 40.9)¶ 0.03
T6 38.0 (29.9 to 39.7)¶ 38.3 (28.0 to 46.2) (30.4 to 36.8) 30.0 (25.5 to 35.5)¶ 0.02
PvcCO2(mmHg)
T0 38.2 (29.1 to 50.5) 40.1 (34.2 to 43.4) 36.7 (35.5 to 47.1) 33.9 32.5 (28.1 to 38.4) 0.12
T6 33.7 (28.3 to 36.9) 33.8 (31.4 to 41.4) (30.4 to 36.8) 29.0 (25.1 to 35.8) 0.20
PaO2(mmHg)
T0 112.2 (79.3 to 167.3) 117.1 (77.5 to 139.5) 115.7 (81.4 to 140.8) 100 (86.0 to 123.9) 0.70
T6 113.6 (83.0 to 147.3) 132.5 (109.8 to 197.8) 105.0 (83.5 to 127.4) 111.5 (86.2 to 135.7) 0.34
PaO2/FiO2(mmHg)
T0 188.9 (117.1 to 265.0) 166.9 (143.8 to 244.1) 233.7 (184.6 to 314.0) 214.3 (141.6 to 368.0) 0.28
T6 177.9 (136.4 to 298.4) 265.0 (185.5 to 383.5) 239.3 (185.1 to 306.3) 253.5 (181.6 to 368.0) 0.17
Lactate (mmol/l)
T0 4.3 (2.0 to 7.9) 2.9 (2.0 to 9.7) 2.7 (1.5 to 3.9) 2.9 (1.7 to 4.7) 0.16
T6 3.3 (2.1 to 6.8)**¶ 2.9 (1.1 to 7.1) 1.3 (0.9 to 2.3)** 2.0 (1.0 to 3.5)¶ 0.002
ScvO2(%)
T0 64.0 (54.7 to 75.1) 66.8 (59.7 to 74.5) 73.0 (70.8 to 76.7) 67.1 (62.1 to 75.9) 0.36
T6 70.8 (66.4 to 73.5) 73.4 (69.3 to 78.0) 72.3 (67.2 to 75.9) 76.0 (60.0 to 77.9) 0.53
SvO2(%)
Table 2 Hemodynamic, oxygen and ventilatory parameters(Continued)
T6 69.0 (63.3 to 72.9) 70.6 (63.4 to 73.8) 71.2 (64.4 to 75.1) 68.0 (58.7 to 74.3) 0.77
Oxygen extraction ratio
T0 34.7 (28.3 to 44.3) 30.8 (22.7 to 38.4) 29.4 (25.0 to 36.8) 30.7 (24.9 to 37.5) 0.36
T6 29.8 (26.4 to 36.6) 30.2 (24.9 to 31.3) 29.3 (24.1 to 33.3) 30.7 (23.4 to 39.3) 0.68
Pv-aCO2(mmHg)
T0 8.2 (7.0 to 10.6)*¶ 1.4 (1.1 to 5.3)*φ 6.3 (6.1 to 7.2)φξ 2.7 (2.0 to 4.0)¶ξ <0.001
T6 7.6 (6.4 to 9.4)**¶ 8.6 (6.5 to 11.7)φΨ 3.5 (0.9 to 4.3)**φ 3.3 (2.2 to 4.1)¶Ψ <0.001
Pvc-aCO2(mmHg)
T0 9.7 (7.0 to 12.1)¶ 4.6 (3.3 to 6.1) 7.3 (4.6 to 9.1) 4.4 (2.7 to 5.4)¶ <0.001
T6 7.0 (5.8 to 9.7) 8.5 (5.6 to 9.6)Ψ 4.4 (2.1 to 5.5) 4.0 (1.7 to 5.4)Ψ 0.003
Ventilatory parameters
Mechanical ventilation
T0 24 5 11 23 0.01
T6 24 5 11 23 0.01
PEEP (mmHg),n 5.0 (5.0 to 8.0), 11 6.0 (5.0 to 8.0), 23 0.48
T0 6.0 (5.0 to 8.0), 24 5.0 (5.0 to 6.0), 5 5.0 (5.0 to 8.0), 11 8.0 (5.0 to 10.0), 23
T6 6.5 (5.0 to 8.0), 24 5.0 (5.0 to 7.5), 5
Tidal volume (ml/kg)
T0 7.1 (6.3 to 7.7) 7.3 (6.3 to 7.6), 5 7.0 (6.5 to 8.0), 11 7.5 (6.6 to 8.0), 23 0.65
T6 7.2 (6.3 to 7.9) 7.2 (6.6 to 7.6), 5 7.5 (6.8 to 8.0), 11 7.5 (6.9 to 8.0), 23 0.65
Data presented as mean (25 to 75% interquartile range).CVP, central venous pressure; FiO2, oxygen inspired fraction;MAP, mean arterial pressure; PaCO2, arterial carbon
dioxyde pressure; PaO2, arterial oxygen pressure;PAOP, pulmonary artery occlusion pressure; PEEP, positive end-expiratory pressure;Pv-aCO2, mixed venous-to-arterial
carbon dioxide difference;Pvc-aCO2, central venous-to-arterial carbon dioxide difference;PvcCO2, central venous carbon dioxide pressure;PvmCO2, mixed venous carbon
dioxide pressure;ScvO2, central venous oxygen saturation;SvO2, mixed venous oxygen saturation; T0, time 0; T6, 6 hours after Time 0. *P<0.05 for Groups 1 vs. 2;
**P<0.05 for Groups 1 vs. 3;
P<0.05 for Groups 1 vs. 4;φP<0.05 for Groups 2 vs. 3;ΨP<0.05 for Groups 2 vs. 4; andξP<0.05 for Groups 3 vs. 4.
Figure 1Sequential Organ Failure Assessment scores at day 3 by the early development (first 6 hours) of mixed venous-to-arterial carbon dioxide difference.Kruskal–Wallis test,P<0.001. **Significant differences between persistently high mixed venous-to-arterial carbon dioxide difference (Pv-aCO2) and low Pv-aCO2group; and between
persistently high Pv-aCO2and decreasing Pv-aCO2group after Bonferroni
correction. H-H, Pv-aCO2high at Time 0 (T0) and 6 hours later (T6); L-H,
Pv-aCO2normal at T0 and high at T6; H-L, Pv-aCO2high at T0 and
normal at T6; and L-L, Pv-aCO2normal at T0 and T6. SOFA, Sequential
[image:6.595.57.290.447.624.2]Organ Failure Assessment.
Figure 2Survival probabilities at day 28 by the development of mixed venous-to-arterial carbon dioxide difference during the first 6 hours of resuscitation.Log-rank, Mantel–Cox: 19.21, P<0.001. H-H, mixed venous-to-arterial carbon dioxide difference (Pv-aCO2) high at Time 0 (T0) and 6 hours later (T6); L-H, Pv-aCO2
normal at T0 and high at T6; H-L, Pv-aCO2high at T0 and normal at
[image:6.595.303.539.465.654.2]Discussion
[image:7.595.305.538.88.292.2]We studied a cohort of patients during the very early phases of septic shock who were subjected to a compre-hensive resuscitation aimed to target the usual hemo-dynamic and oxygen metabolism parameters. A recent study demonstrated how Pv-aCO2could be a tool to de-tect persistent inadequate resuscitation during septic shock [18] although it was not conducted during very early stages of resuscitation. Even a faster enrollment, our study showed that a number of patients had ap-proximately normal SvO2 and ScvO2 at catheter inser-tion as it has been reported at ICU admission [22], and most of them reached normal oxygen-derived parame-ters at 6 hours. However, despite attaining the SvO2and ScvO2targets (and after adjusting for SvO2) and an ap-parent global hemodynamic normalization in most pa-tients, those with persistently high Pv-aCO2 developed more severe multiorgan dysfunction at day 3 than patients evolving with normal Pv-aCO2during the first 6 hours of
Figure 3Scatter plot between cardiac index and mixed venous-to-arterial carbon dioxide difference.All patients at Time 0 (T0) and 6 hours (T6), 12 hours (T12) and 24 hours (T24) later. Pearson correlation: 0.16;r2= 0.025;P<0.01. CI, confidence interval; Pv-aCO
2,
[image:7.595.57.292.88.314.2]mixed venous-to-arterial carbon dioxide difference.
[image:7.595.57.292.378.636.2]Figure 4Lactate clearance (%) 6 and 12 hours after Time 0 for patients with normal or high mixed venous-to-arterial carbon dioxide difference at 6 hours.Significant differences for lactate clearance (Time 0 (T0) to 6 hours later (T6) and T0 to 12 hours later (T12)) between patients with persistently high (that is, high-to-high and normal-to-high groups) and normalized mixed venous-to-arterial carbon dioxide difference at T6 (high-to-normal and persistently low groups). A negative percent clearance indicates a reduction in lactate levels. Black bars: High Pv-aCO2at T6; Gray bars: Low Pv-aCO2at T6.
Figure 5Correlation between mixed venous carbon dioxide pressure and central venous-to-arterial carbon dioxide differ-ence.Scatter plot representing the mixed-venous to arterial carbon dioxide (Pvm-aCO2) difference versus the central-venous to arterial
carbon dioxide difference (Pvc-aCO2). Pearson correlation: 0.71 (95%
confidence interval: 0.47 to 0.86);R2= 0.55,P<0.001.
Table 3 Mortality risk ratio for patients with mixed oxygen saturation≥65% but with mixed venous-to-arterial carbon dioxide difference≥6 mmHg at day 28
Time Relative riska Confidence interval Pvalue
0 hours 1.77 0.97–3.22 0.06
6 hours 2.23 1.20–4.13 0.01
12 hours 2.41 1.42–4.10 0.001
a
[image:7.595.305.537.669.725.2]resuscitation or those who evolved from high to normal PvaCO2. Additionally, we observed that persistently high Pv-aCO2 was associated with a lower survival at day 28.
Venous hypercarbia is a marker of limited blood flow during cardiac arrest and shock states [8-19]. Recent ob-servations have suggested that Pv-aCO2 might identify septic patients who remain inadequately resuscitated des-pite achieving ScvO2goals [15]. Consistent with these find-ings, we found that patients in septic shock achieving ScvO2≥70% or SvO2≥65% had worse outcomes when a concomitant high Pv-aCO2 was observed. These data reinforce the idea that Pv-aCO2provides additional infor-mation to hemodynamic and oxygen parameters habitually used during resuscitation of septic shock. Nevertheless, the underlying mechanisms that explain increases in Pv-aCO2 during septic shock are incompletely understood; however, to current knowledge, an increased Pv-aCO2results from the interactions between blood flow to the tissues, aerobic and anaerobic CO2 generation, and the CO2dissociation curve.
According to the Fick equation, during steady state the CO2excretion equals the product of cardiac output by the difference between mixed venous blood CO2content and arterial blood CO2content. Some studies have em-phasized on the key role of cardiac output on venous to arterial CO2content differences and indeed a curvilinear relationship between these two variables has been de-scribed [14]. However, in our study we found a poorer concordance between cardiac output and Pv-aCO2 at each time point of resuscitation (Figure 3) and, in fact, the cardiac output remained normal or even high during the first 24 hours of resuscitation (Figure S2 in Additional file 1), suggesting some independence between Pv-aCO2 and macrovascular blood flow changes. While in non-inflammatory low-flow states tissue and regional hyper-carbia can be easily explained by the CO2 stagnation phenomenon [15,16], the interpretation of an increased tissue and/or regional CO2 during inflammatory condi-tions is more complex. Sepsis may thereby be associated with the coexistence of normal or even high cardiac output, inter-organ and intra-organ blood flow redistri-bution, and altered microvascular and oxygen extraction capabilities. All of these alterations can influence the tissue CO2production and elimination.
A study by Neviere and colleagues thus demonstrated the key role of microvascular blood flow on gastric CO2 accumulation [27]. Similarly, using simultaneous gastric tonometry and laser Doppler flowmetry, Elizalde and colleagues demonstrated the association between gastric mucosal pH and mucosal blood flow, regardless of macro-hemodynamic variations [28]. Likewise, Tugtekin and col-leagues demonstrated in a porcine sepsis model that the increase of mucosal to arterial CO2gap was related to the
heterogeneity of gut mucosal blood flow, even though car-diac output and mesenteric blood flow were maintained [29]. Meanwhile, Creteur and colleagues found a significant correlation among sublingual CO2, gastric mucosal CO2 and microcirculatory heterogeneity in human septic shock during dobutamine infusion, and suggested that the primary determinant of tissue CO2 accumula-tion was the microcirculatory blood flow [30]. Hence, there is an evident link between blood flow and tissue or local CO2 accumulations conducting to increase tissue or venous-to-arterial CO2differences, but sometimes nor-mal macrohemodynamics does not prevent elevation of Pv-aCO2. The near normalization of the oxygen and hemodynamic parameters between the subgroups in our study suggests that venous CO2 accumulation encloses more complex mechanisms than macrovascular stagna-tion, and we could hypothesize that microvascular blood flow distribution is one of several factors potentially influ-encing the behavior of Pv-aCO2during inflammatory con-ditions in which the heterogeneity of microvascular blood flow is increased. However, this hypothesis should be con-firmed in future studies.
The interpretation of hyperlactatemia in sepsis is very complex, especially in septic shock [31] since anaerobic metabolism, non-anaerobic generation and slow clear-ance can conduct lactate accumulation. We observed higher lactate levels and slower lactate clearance at T6 and T12 in patients with persistently high Pv-aCO2 dur-ing the first 6 hours of resuscitation. Interestdur-ingly, Pv-aCO2 (and Pvc-aCO2) kinetics seems to anticipate a slower lactate clearance (Figure S5 in Additional file 1). A high Pv-aCO2could indicate a decrease in global or microvascular blood flow conducting to slow lactate clearance. However, a high Pv-aCO2 could also reflect the persistence of anaerobic metabolism as result of bi-carbonate buffering of protons derived from fixed acids [32]. Thus, an increased Pv-aCO2 to oxygen consump-tion ratio could reflect global anaerobic metabolism as was proposed by Mekontso-Dessap and colleagues [19]. However, even in the presence of anaerobic metabolism, a high efferent venous blood flow could be sufficient to wash out the global CO2 generation from the hypoper-fused peripheral tissues and, in this case, Pv-aCO2could not increase. In fact, hypoperfusion could persist in some of our patients and even oxygen parameters, global hemodynamics or Pv-aCO2remain normal.
(Pv-aCO2in our study) are really interchangeable should be addressed in future studies.
Our study has some limitations. First, our observations are restricted to macro-hemodynamic variables, and Pv-aCO2is another global variable that does not necessarily represent tissue or regional vascular perfusion at different beds. We did not describe regional perfusion variables as gastric tonometry or local tissue CO2accumulation; hence, normal Pv-aCO2might also occur when regional hypoper-fusion is ongoing.
Second, we suggest that persistently high Pv-aCO2 re-flects tissue or regional hypoperfusion. We hypothesized that Pv-aCO2 could reflect the venous CO2 accumula-tion due to the heterogeneous microcirculatory blood flow when cardiac output and oxygen parameters remain normal or even high or, eventually, Pv-aCO2 could re-flect anaerobic CO2 generation. However, mechanism conducting to venous CO2accumulation during inflam-matory conditions should be explored in future studies.
Third, during conditions of tissue hypoxia but with preserved blood flow (even though during anaerobic me-tabolism carbon dioxide production - VCO2- decreases less than oxygen consumption -VO2-), venous blood flow might be high enough to ensure adequate washout of the CO2produced by hypoxic cells, thereby preventing a Pv-aCO2increase.
Fourth, we assumed that a linear relationship exist be-tween partial CO2pressure and CO2content at the venous and arterial levels [33,34]. Pv-aCO2could thus be used as a surrogate for the Cv-aCO2. However, previous research has shown that the Haldane effect causes paradoxical increases in Pv-aCO2during blood flow increases [33,34]. Unfortu-nately, the calculation of CO2content is complex and sub-ject to errors due to the number of variables included in the formulas. Simplified formulas are easy to use, but wide differences in venous and arterial acid–base status (for example, ischemic hypoxia) can preclude their use. Never-theless, some authors consider that the Haldane effect ex-erts a minor influence, and in most cases Pv-aCO2 and CO2content differences develop similarly [35].
Finally, our observations were restricted to a small sample of patients in septic shock. Although our findings seem logical and biologically plausible, they should be confirmed in future studies.
Conclusions
The persistence of high Pv-aCO2during the early resusci-tation of patients in septic shock is associated with signifi-cant higher multiorgan dysfunction and poor outcomes. Although underlying mechanisms that increase Pv-aCO2 among patients in septic shock must be clarified, Pv-aCO2 might identify a high risk of death in apparently resusci-tated patients. Future studies should test Pv-aCO2 as a
perfusion goal during early phases of the resuscitation of patients in septic shock.
Key messages
Persistent high Pv-aCO2is related to more severe multiorgan dysfunction and worse outcomes in apparently resuscitated septic shock patients. Mechanisms conducting to increase Pv-aCO2during
inflammatory conditions are insufficiently understood. Variations in Pv-aCO2were independent of macro-flow variables (that is, cardiac output) or oxygen metabolism targets (that is, SvO2, oxygen extraction rate), suggesting that venous stagnation is not the single explanation for venous CO2accumulation. Pv-aCO2might identify a high risk of death in
apparently resuscitated septic shock patients, and could be explored as a tissue perfusion goal during resuscitation as Pv-aCO2tracks ischemic hypoxia.
Additional file
Additional file 1:Figure S1a presenting the time course of ScvO2 (%) during the first 24 hours for survivors and nonsurvivors at day-28. Figure S1bpresenting the time course of SvO2 (%) during the first 24 hours for survivors and nonsurvivors at day 28.Figure S2presenting the time course of cardiac output (l/minute) during the first 24 hours for survivors and nonsurvivors at day 28.Figure S3presenting the scatter plot between cardiac index and Pv-aCO2(according to Pv-aCO2at T6). Figure S4apresenting the time course of Pv-aCO2 (mmHg) during the first 24 hours for survivors and nonsurvivors at day 28.Figure S4b presenting the time course of Pvc-aCO2 (mmHg) during the first 24 hours for survivors and nonsurvivors at day 28.Figure S5presenting the time course of lactate levels (mmol/l) during the first 24 hours for survivors and nonsurvivors at day 28.
Abbreviations
CO2:Carbon dioxide; Pv-aCO2: Mixed venous-to-arterial carbon dioxide difference;
Pvc-aCO2: Central venous-to-arterial carbon dioxide difference; ScvO2: Central
venous oxygen saturation; SvO2: Mixed venous oxygen saturation.
Competing interests
The authors declare they have no competing interests.
Authors’contributions
GAO-T contributed to the study conception, design and manuscript preparation. DFB-R, MU, JDT, AG and WB were involved in data collection and revising the manuscript. AFG, MG, CA-D and GH revised the manuscript critically. All authors read and approved the final manuscript.
Acknowledgments
The authors thank Dr Magda Cepeda (Fundación Valle del Lili, Cali, Colombia), Dr Oscar Ramírez W (Fundación Valle del Lili, Cali, Colombia) and Dr Yoseth Ariza (Universidad ICESI, Cali, Colombia) for their contributions to the statistical analyses.
Author details 1
Intensive Care Unit, Fundación Valle del Lili, Av. Simón Bolívar Cra. 98, Cali, Colombia.2Biomedica Research Group, Universidad ICESI, Cali, Colombia. 3
Received: 19 June 2013 Accepted: 21 October 2013 Published: 13 December 2013
References
1. Beal AL, Cerra FB:Multiple organ failure syndrome in the, 1990’s. Systemic inflammatory response and organ dysfunction.JAMA1990, 1994:226–233.
2. Shoemaker WC, Appel PL, Kram HB:Tissue oxygen debt as a determinant of lethal and nonlethal postoperative organ failure.Crit Care Med1988, 16:1117–1120.
3. Vallet B:Vascular reactivity and tissue oxygenation.Intensive Care Med 1998,24:3–11.
4. Rivers E, Nguyen B, Havstad S, Ressler J, Muzzin A, Knoblich B, Peterson E, Tomlanovich M:Early goal-directed therapy in the treatment of severe sepsis and septic shock.N Eng J Med2001,345:1368–1377.
5. Third European Consensus Conference in Intensive Care Medicine:Tissue hypoxia: How to detect, how to correct, how to prevent. Societe de reanimation de langue francaise. The American thoracic society. European society of intensive care medicine.Am J Respir Crit Care Med 1996,154:1573–1578.
6. Russell JA, Phang PT:The oxygen delivery/consumption controversy. Approaches to management of the critically ill.Am J Respir Crit Care Med 1994,149:533–537.
7. Marik PE, Bankov A:Sublingual capnometry versus traditional markers of tissue oxygenation in critically ill patients.Crit Care Med2003,31:818–822. 8. Grundler W, Weil MH, Rackow EC:Arteriovenous carbon dioxide and pH
gradients during cardiac arrest.Circulation1986,74:1071–1074. 9. Weil MH, Rackow EC, Trevino R, Grundler W, Falk JL, Griffel MI:Difference in
acid–base state between venous and arterial blood during cardiopulmonary resuscitation.N Engl J Med1986,315:153–156. 10. Mecher CE, Rackow EC, Astiz ME, Weil MH:Venous hypercarbia associated
with severe sepsis and systemic hypoperfusion.Crit Care Med1990, 18:585–589.
11. Adrogue HJ, Rashad MN, Gorin AB, Yacoub J, Madias NE:Assessing acid–base status in circulatory failure. Differences between arterial and central venous blood.N Engl J Med1989,320:1312–1316.
12. Kazarian KK, Del Guercio LR:The use of mixed venous blood gas determinations in traumatic shock.Ann Emerg Med1980,9:179–182. 13. Teboul JL, Mercat A, Lenique F, Berton C, Richard C:Value of the venous–
arterial PCO2 gradient to reflect the oxygen supply to demand in humans: effects of dobutamine.Crit Care Med1998,26:1007–1010. 14. Bakker J, Vincent JL, Gris P, Leon M, Coffernils M, Kahn RJ:Veno-arterial
carbon dioxide gradient in human septic shock.Chest1992,101:509–515. 15. Vallet B, Teboul JL, Cain S, Curtis S:Venoarterial CO(2) difference during
regional ischemic or hypoxic hypoxia.J Appl Physiol2000,89:1317–1321. 16. Neviere R, Chagnon JL, Teboul JL, Vallet B, Wattel F:Small intestine
intramucosal PCO(2) and microvascular blood flow during hypoxic and ischemic hypoxia.Crit Care Med2002,30:379–384.
17. Dubin A, Estenssoro E, Murias G, Pozo MO, Sottile JP, Baran M, Piacentini E, Canales HS, Etcheverry G:Intramucosal-arterial Pco2 gradient does not reflect intestinal dysoxia in anemic hypoxia.J Trauma2004,57:1211–1217. 18. Vallee F, Vallet B, Mathe O, Parraguette J, Mari A, Silva S, Samii K, Fourcade O, Genestal M:Central venous-to-arterial carbon dioxide difference: an additional target for goal-directed therapy in septic shock?Intensive Care Med2008,34:2218–2225.
19. Mekontso-Dessap A, Castelain V, Anguel N, Bahloul M, Schauvliege F, Richard C, Teboul JL:Combination of venoarterial PCO2 difference with arteriovenous O2 content difference to detect anaerobic metabolism in patients.Intensive Care Med2002,28:272–277.
20. van Beest PA, van Ingen J, Boerma EC, Holman ND, Groen H, Koopmans M, Spronk PE, Kuiper MA:No agreement of mixed venous and central venous saturation in sepsis, independent of sepsis origin.Crit Care Med 2010,14:R219.
21. van Beest PA, Lont MC, Holman ND, Loef B, Kuiper MA, Boerma EC:Central venous–arterial pCO(2) difference as a tool in resuscitation of septic patients.Intensive Care Med2013,39:1034–1039.
22. van Beest PA, Hofstra JJ, Schultz MJ, Boerma EC, Spronk PE, Kuiper MA:The incidence of low venous oxygen saturation on admission to the intensive care unit: a multi-center observational study in The Netherlands.Crit Care Med2008,12:R33.
23. Hernandez G, Pena H, Cornejo R, Rovegno M, Retamal J, Navarro JL, Aranguiz I, Castro R, Bruhn A:Impact of emergency intubation on central venous oxygen saturation in critically ill patients: a multicenter observational study.Crit Care Med2009,13:R63.
24. Levy MM, Fink MP, Marshall JC, Abraham E, Angus D, Cook D, Cohen J, Opal SM, Vincent JL, Ramsay G:SCCM/ESICM/ACCP/ATS/SIS international sepsis definitions conference.Crit Care Med2001,2003:1250–1256.
25. Dellinger RP, Levy MM, Carlet JM, Bion J, Parker MM, Jaeschke R, Reinhart K, Angus DC, Brun-Buisson C, Beale R,et al:Surviving sepsis campaign: international guidelines for management of severe sepsis and septic shock: 2008.Crit Care Med2008,36:296–327.
26. Vincent JL, de Mendonca A, Cantraine F, Moreno R, Takala J, Suter PM, Sprung CL, Colardyn F, Blecher S:Use of the SOFA score to assess the incidence of organ dysfunction/failure in intensive care units: results of a multicenter, prospective study. Working group on‘sepsis-related problems’of the European Society of Intensive Care Medicine.Crit Care Med1998,26:1793–1800.
27. Neviere R, Mathieu D, Chagnon JL, Lebleu N, Wattel F:The contrasting effects of dobutamine and dopamine on gastric mucosal perfusion in septic patients.Am J Respir Crit Care Med1996,154:1684–1688. 28. Elizalde JI, Hernandez C, Llach J, Monton C, Bordas JM, Pique JM, Torres A:
Gastric intramucosal acidosis in mechanically ventilated patients: role of mucosal blood flow.Crit Care Med1998,26:827–832.
29. Tugtekin IF, Radermacher P, Theisen M, Matejovic M, Stehr A, Ploner F, Matura K, Ince C, Georgieff M, Trager K:Increased ileal-mucosal-arterial PCO2 gap is associated with impaired villus microcirculation in endotoxic pigs.Intensive Care Med2001,27:757–766.
30. Creteur J, De Backer D, Sakr Y, Koch M, Vincent JL:Sublingual capnometry tracks microcirculatory changes in septic patients.Intensive Care Med 2006,32:516–523.
31. De Backer D:Lactic acidosis.Intensive Care Med2003,29:699–702. 32. Raza O, Schlichtig R:Metabolic component of intestinal PCO(2) during
dysoxia.J Appl Physiol2000,89:2422–2429.
33. Jakob SM, Kosonen P, Ruokonen E, Parviainen I, Takala J:The Haldane effect–an alternative explanation for increasing gastric mucosal PCO2 gradients?Br J Anaesth1999,83:740–746.
34. Hurley R, Mythen MG:The Haldane effect–an explanation for increasing gastric mucosal PCO2 gradients?Br J Anaesth2000,85:167–169. 35. Schlichtig R, Bowles SA:Distinguishing between aerobic and anaerobic
appearance of dissolved CO2 in intestine during low flow.J Appl Physiol 1994,76:2443–2451.
doi:10.1186/cc13160
Cite this article as:Ospina-Tascónet al.:Persistently high venous-to-arterial carbon dioxide differences during early resuscitation are associ-ated with poor outcomes in septic shock.Critical Care201317:R294.
Submit your next manuscript to BioMed Central and take full advantage of:
• Convenient online submission
• Thorough peer review
• No space constraints or color figure charges
• Immediate publication on acceptance
• Inclusion in PubMed, CAS, Scopus and Google Scholar
• Research which is freely available for redistribution