ISSN Online: 1947-394X ISSN Print: 1947-3931
Evaluation of Impairment Caused by MPEG
Video Frame Loss
Carlos Alexandre Gouvea da Silva, Guilherme Fernandes de Souza Miguel,
João Guilherme Sauer, Carlos Marcelo Pedroso
Department of Electrical Engineering, Federal University of Paraná, Curitiba, Brazil
Abstract
This article presents a study on the impact of video frame losses on the quality perceived by users. Video compression standards, such as MPEG, use a se-quence of frames called Group of Pictures (GOP), which is a video compres-sion method which a frame is expressed in terms of one or more neighboring frames. This dependence between frames impacts directly in the quality be-cause a loss of a reference frame prevents the decoding of other frames in GOP, thereby reducing the user-perceived quality. The assessment of quality in this article is estimated by Peak Signal Noise Ratio (PSNR), which com-pares the original and the received images. Computer simulations were used to show that the degradation on the quality may vary for different patterns of GOPs and type of lost frames.
Keywords
MPEG-4, Video Streaming, PSNR, Frame Loss
1. Introduction
Multimedia transmission systems represent a significant portion of the use of current telecommunication systems. The evolution in software and hardware technologies for data transmission allowed the improvement of new multimedia services like IPTV (Internet Protocol Television) and VOD (Video on Demand)
[1][2]. The advances and emerging technologies have been gaining a great deal of space in the development of services and applications. Among these services, it is possible to highlight the video streaming, which has a high bandwidth con-sumption [3][4].
This kind of services, like IPTV and VOD, became very popular in the last years, generating an enormous amount of data, with video streaming being the most popular one [5], running in devices such as smartphones, desktops,
wire-How to cite this paper: da Silva, C.A.G., de Souza Miguel, G.F., Sauer, J.G. and Pedroso, C.M. (2017) Evaluation of Im-pairment Caused by MPEG Video Frame Loss. Engineering, 9, 493-503.
https://doi.org/10.4236/eng.2017.95029 Received: March 12, 2017
Accepted: May 24, 2017 Published: May 27, 2017
Copyright © 2017 by authors and Scientific Research Publishing Inc. This work is licensed under the Creative Commons Attribution International License (CC BY 4.0).
http://creativecommons.org/licenses/by/4.0/
less computer, and tablets [6]. With the increase of data being transmitted, the actual systems have to be upgraded to guarantee the quality of the service. The user-perceived quality of video streaming applications is very sensitive to delay, loss, and throughput. Quality of service (QOS) involves the totality of characte-ristics of a telecommunication service that bears on its ability to satisfy stated and implied needs of the user of the service [7]. The most important QOS para-meters are the delay, the packet loss probability, the jitter and throughput [8]. The telecommunications companies had focused in the user-perceived quality, mainly because the customer experience has become one of the most important factors in competitive market environment [9]. The analysis of the image quality during data transmission can help to estimate user-perceived quality of video streaming. A better understanding of the effects of frame loss in the user-per- ceived quality can be used to improve the network configuration [10].
Mean Opinion Score (MOS) is a subjective measure of user-perceived quality that gives a numerical indication of quality of media received, where 1 is worst and 5 the best possible quality. However, subjective methods like MOS have high costs, once that the requirements to implement the test environment are expen-sive [11]. In the other hand, objective methods use tools and statistical approach to evaluate the quality. The most used objective methods are: Peak Signal to Noise Ratio (PSNR), Structural Similarity (SSIM) and Video Quality Metric (VQM) [12].
MPEG-4 is a standard video coding format that uses: sub-sampling, spatial and temporal compression. The sub-sampling decreases color information that is not noticeable by human eyes. Spatial compression uses the redundant infor-mation within the frame. Temporal compression compares the changes between frames of GOP and stores the data that represents only the changes [13] [14] [15].
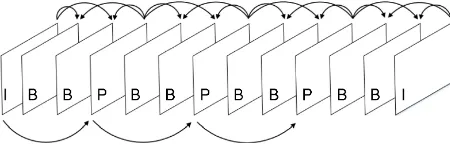
[image:2.595.260.485.644.718.2]A GOP is composed of three types of frames: the I-frame (Intra) is encoded without any references to other frames and use only the spatial compression; P-frame (Predictive) is encoded using as base the previous I-frame or P-frame; and B-frame (Bi-directionally) that uses information from an earlier I- or P-frame together with a next I-frame or P-frame as reference for its encoding [16][17]. The GOP always starts with an I-frame, followed by P- and B-frame, as showed in the Figure 1. To represent the GOP sequence of frames, it is common to use the notation (M, N), where M represents the number of frames per GOP and N is the number of consecutive B-frames. Once that I-frame is used as base for the other frames, an impairment in an I-frame is propagated to the subsequent
frames of the GOP [18]. This paper shows the impact of frame loss in the video streaming quality, using different settings of GOP for video encoded using MPEG-4 with part 10 [19]. Performance evaluation was made using computa-tional simulations, evaluating the quality with PSNR.
Besides this introductory section, this paper is organized as follows: Section 2 presents the related works; Section 3 shows quality evaluation using PSNR, fol-lowed by the Section 4 that explains the methodology, the parameters, and soft-ware tools used. Section 5 shows the results and discussion. Section 6 gives a short conclusion and an outlook on future work.
2. Related Works
The problems caused by packet loss in video playback are called artifacts [14] [20]. The main artifacts are the slice and the blocking or pixelization error. In
[21] is showed a study on the quality degradation due the loss of I-frame, and the evaluation was done using an small resolution format know as Quarter Common Intermediate Format (QCIF). The metric used was PSNR, but is used only one GOP configuration that was not informed in the paper.
In [22] is analyzed the quality degradation of the loss of P-frames, with video quality estimated using VQM. The authors do not consider the effects of loss of I- or B-frames. The SSIM is used in [23] to indicate the loss of the full I-, P-, and B-frame, however does not show the impact from the loss of specific frame in GOP.
A study of the quality degradation is showed in [24] using four videos (Fore-man, Akiyo, Coastguard, Football and Tennis) encoded with a GOP (15.2) and MPEG-2. The tests were performed in using IPTV/VOD configurations and random destinations on the internet. Results show that videos with high motion patterns are the most affected in quality with packet loss.
In [25] is proposed a method to set an optimal GOP configuration to maxim-ize the encoding efficiency and improve quality of video streaming. Results show that the use of larger GOP length results in better user-perceived quality. The number of B-frames between two reference frames such as I- or P-frames was investigated in [26]. According to the results the number B-frames of GOP should be between 1 to 4 to improve quality, while in [27] states that this num-ber should be varied from 0 to 2.
The PSNR is used in [28] to estimate the quality of video. Different Variable Bit Rate (VBR) and Constant Bit Rate (CBR) settings were used to analyze the quality degradation caused by frame loss. This research also uses H.264 video compression. However, this work does not delve into the issues of video charac-teristics and the structure of GOP.
None of the previous works studied the effects of frame loss in using different GOP configuration and specific frame in the GOP. Another important aspect is the fact that the I-frame will be sent using several packets. The loss of a packet in the beginning or end of frame results in different impairment on the video quality.
con-figuration, modern video codec’s and loss of specific frames that allows a better understanding of the impact in the user-perceived quality caused by frame loss.
3. Peak Signal to Noise Ratio
PSNR is an objective method used for quality evaluation that uses the relation-ship between the maximal possible value of the signal and the power of corrupt-ing noise that affects the quality of the received image. This method is classified in a category called Full Reference (FR), which indicates that both original and received images are available for evaluation [29][30].
The PSNR uses the Mean Square Error (MSE), evaluated as:
(
)
(
)
21 1
0 0
1
MSE M N , ,
x Y f x y g x y
MN
− −
= =
=
∑ ∑
− (1)where M and N represents the width and the height of the frame, respectively. The horizontal and vertical coordinates are represented respectively x and y. The original frame is represented by f x y
( )
, and the received frame by g x y( )
, . The PSNR is obtained from:2 max 10
PSNR 10 log L MSE
= (2)
where max 2 1 n
L = − is the biggest value that a pixel can have and n is the
num-ber of bits per pixel.
The mapping between the PSNR, SSIM and MOS are showed in the Table 1.
4. Methodology
PSNR evaluation was done using Evalvid [32], which is an open source tool de-veloped by the Berlin University. The video was encoded using ffmpeg[33], an open source multimedia framework able to encode, decode, transcode, stream, and play video using MPEG standard.
4.1. Video Test Sequences
[image:4.595.205.541.647.733.2]The video test sequences used in simulations are openly available and are part of a library used for research and projects related to video transmission and en-coding. The video used were: Coastguard, Football, Akiyo and BlueSky. The videos Coastguard, Football, and Akiyo were encoded using MPEG-4 part 10, with resolution of 352 × 288 (Common Intermediate Format, CIF) and with 25 frames per second (fps). The sequence Bluesky was encoded in High Definition
Table 1. Mapping between PSNR, SSIM and MOS [31].
PSNR (dB) SSIM MOS Meaning
PSNR ≥ 45 SSIM ≥ 0.99 5 Excellent
33 ≤ PSNR < 45 0.95 ≤ SSIM < 0.99 4 Good 27.4 ≤ PSNR < 33 0.88 ≤ SSIM < 0.95 3 Reasonable 18.7 ≤ PSNR < 27.4 0.5 ≤ SSIM < 0.88 2 Poor
(1920 × 1080) at a rate of 24 fps. In all cases it was used a Maximum Transfer Unit (MTU) of 1460 bytes. The Table 2 summarizes the main characteristics of the video test sequence used.
4.2. GOP Configuration and Methods of Frame Loss Selection
It were used six GOP configuration in the simulations: (6.2), (8.3), (9.2), (12.2), (15.2), and (15.0). These GOP configurations were used previously in other works [16][34][35].
The identification of each frame in GOP is important to analyze the impair-ment caused by frame loss. In this paper, the fallowing notation was used:
GOP6.2 = I1B2B3P4B5B6
GOP8.3 = I1B2B3B4P5B6B7B8
GOP9.2 = I1B2B3P4B5B6P7B8B9
GOP12.2 = I1B2B3P4B5B6P7B8B9P10B11B12
GOP15.2 = I1B2B3P4B5B6P7B8B9P10B11B12P13B14B15
GOP15.0 = I1P2P3P4P5P6P7P8P9P10P11P12P13P14P15
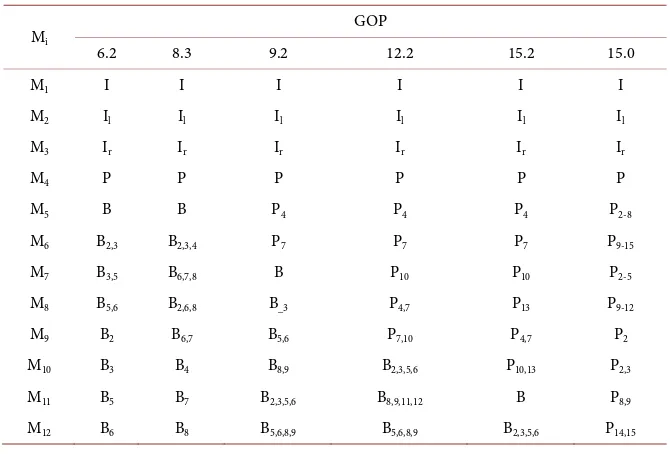
Twelve different models, of frame loss for each GOP were studied. The Table 3 presents the test setup. Twelve different scenarios of frame loss were used. Models M2 and M3 consider the loss of first 50% and last 50%, respectively, of
[image:5.595.206.542.404.482.2]the I-frames packets. This approach allows the investigation of the impairments
Table 2. Main characteristics of CIF and HD videos used for simulation and testing.
Video Moviment Patern Frames Length Resolution Format
Akyio Low 300 12 sec. 352 × 288 CIF
Coastguard Low 300 11 sec. 352 × 288 CIF
Football High 130 10 sec. 352 × 288 CIF
Bluesky Medium 217 9 sec. 1920 × 1080 HD
Table 3. Test setup for frame loss in each GOP.
Mi
GOP
6.2 8.3 9.2 12.2 15.2 15.0
M1 I I I I I I
M2 Il Il Il Il Il Il
M3 Ir Ir Ir Ir Ir Ir
M4 P P P P P P
M5 B B P4 P4 P4 P2-8
M6 B2,3 B2,3,4 P7 P7 P7 P9-15
M7 B3,5 B6,7,8 B P10 P10 P2-5
M8 B5,6 B2,6,8 B_3 P4,7 P13 P9-12
M9 B2 B6,7 B5,6 P7,10 P4,7 P2
[image:5.595.205.540.512.739.2]caused by a burst of loss in the I-frame. The modern network packet loss models indicate that loss is not random, but in burst [36]. The frame loss occurs sequen-tially during the transmission of all the videos.
The video quality was measured using PSNR with video encoded with H.264/AVC codec using a selective frame loss generator. Initially the original video was encoded in MPEG-4 and submitted to frame loss generator as showed in the Table 3, finally the resulting video was compared with the original using the PSNR.
5. Results and Discussion
[image:6.595.205.540.404.719.2]The results are showed in three different phases: first is presented a comparative of the number of frames generated for each test setup used; second, the frames size is verified; and finally, is presented the resulting PSNR for each test.
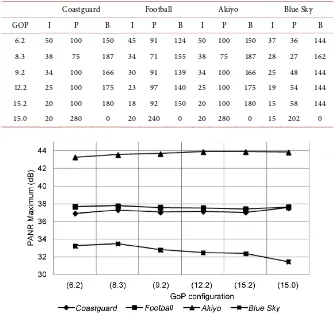
[image:6.595.205.539.404.723.2]Table 4 presents the number of I-, P-, and B-frames of all video test sequences.
Figure 2 shows the maximum possible value of PSNR for each video analyzed. It’s possible to notice that different GOP configuration leads to different PSNR maximum values. For example, in the Akiyo maximum PSNR slightly as the GOP length increases, while the other CIF videos kept maximum PSNR con-stant. The video Blue Sky, on the other hand, reduces maximum PSNR value as the GOP length increases.
Table 4. Number of I-frame, P-frame, and B-frame for GOP configuration.
Coastguard Football Akiyo Blue Sky
GOP I P B I P B I P B I P B
6.2 50 100 150 45 91 124 50 100 150 37 36 144 8.3 38 75 187 34 71 155 38 75 187 28 27 162 9.2 34 100 166 30 91 139 34 100 166 25 48 144 12.2 25 100 175 23 97 140 25 100 175 19 54 144 15.2 20 100 180 18 92 150 20 100 180 15 58 144
15.0 20 280 0 20 240 0 20 280 0 15 202 0
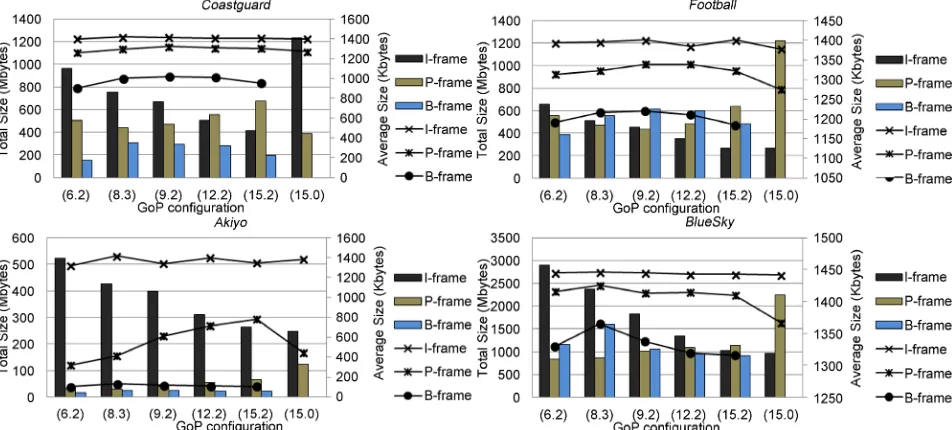
The variation GOP length leads to a variation in the number of frames gener-ated. Figure 3 indicates the relationship between the total size in Mbytes (represented by bars) and average size in Kbytes (represented by lines) of all video test sequence and GOP used. In videos with low motion pattern, like Coastguard and in special the Akiyo, the spatial compression is higher, resulting in bigger I-frames. The size of I-frames depends on the quantization matrix used in the spatial compression. For the video Akiyo is observed that the total size of I-frames is much bigger than the P-frames and B-frames for all GOP options. The average size of the frames presents the same behavior for all GOP studied.
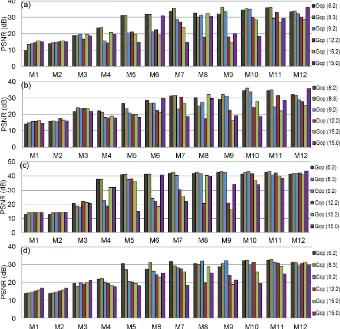
The quality evaluation per video and frame loss model is showed in the Figure 4. It’s possible to notice that the frame loss models M1, M2 and M3, loss related to
the loss of I-frame, results in smaller values of PSNR if compared with the other models, with loss of B- and P-frames. Comparing the PSNR between the models M1 and M2, the loss of the first half of the packets of I-frame have the same result
as losing the entire frame. In the model M3 the loss of second half of I-frame
re-sults in severe impairment, but not prevent the video decoding as the M1 and M2
loss configuration.
In M4 setup, the total loss of P-frame packets impairs the quality in different
[image:7.595.60.536.496.711.2]ways depending on the GOP configuration, with exception for the video Akiyo. However, the worst PSNR was observed in GOP (9.2) or (12.2). For the same GOP configuration video Coastguard presents a low PSNR. In the video Football and BlueSky, the impairments caused by the loss of P-frames increase for bigger GOP lengths. Still, video Coastguard and BlueSky presents nearly the same av-erage PSNR with the loss of all packets of P-frames and the second half of I-frame packets. However, in video Football results showed that the loss of all P-frames leads to lower average PSNR if compared with the loss of the second half of the I-frames packets.
Figure 4. Evaluation quality video using PSNR: (a) Coastguard; (b) Football; (c) Akiyo; and (d) BlueSky.
Considering the loss of P-frames in a GOP, in all cases can be observed that the loss of last P-frame results in more severe impairment if compared with the loss of the first P-frame. This happen because the P-frames are encoded using a previous I- or P-frame. Thus the lost of the first P-frame prevents the decoding of the next P-frames.
For the other loss models, the increase of GOP length results in lower average PSNR. The effects of spatial compression in combination with GOP setting will be object of future research.
6. Conclusions
The motion pattern also plays a fundamental role in user-perceived quality decrease resulting of frame loss if temporal compression is more efficient there are more packets of I-frames than other frame type, and the loss of I-frame im-pairs the user-perceived quality differently. In video with high motion pattern, with more packets carrying P- and B-frames than I-frames, depending on GOP length the loss of P- or B-frames leads to a bigger average PSNR decrease if compared with low motion pattern videos.
References
[1] Liu, Y., Guo, Y. and Liang, C. (2008) A Survey on Peer-to-Peer Video Streaming Systems. Peer-to-Peer Networking and Applications, 1, 18-28.
https://doi.org/10.1007/s12083-007-0006-y
[2] Cui, M. (2010) Research on Video on Demand Based on P2P Network. Intelligent Information Management, 2, 338-341. https://doi.org/10.4236/iim.2010.25041
[3] Liu, D. and Baker, J. (2008) Streaming Multimedia over Wireless Mesh Networks. International Journal of Communications, Network and System Sciences, 2, 105- 206. https://doi.org/10.4236/ijcns.2008.12022
[4] Saeed, B., Lung, C., Kunz, T. and Srinivasan, A. (2013) Multimedia Streaming for Ad Hoc Wireless Mesh Networks Using Network Coding. International Journal of Communications, Network and System Sciences, 6, 204-220.
https://doi.org/10.4236/ijcns.2013.65024
[5] Rodríguez, D.Z., Rosa, R.L., Costa, E.A., Abrahão, J. and Bressan, G. (2014) Video Quality Assessment in Video Streaming Services Considering User Preference for Video Content. IEEE Transactions on Consumer Electronics, 60, 436-444.
https://doi.org/10.1109/TCE.2014.6937328
[6] Wei, C. and Zhang, H. (2014) Applications of a Streaming Video Server in a Mobile Phone Live Streaming System. Journal of Software Engineering and Applications, 7, 975-982. https://doi.org/10.4236/jsea.2014.712085
[7] Recommendation E.800 (2008) Definitions of Terms Related to Quality of Service. International Telecommunication Union’s Telecommunication Standardization Sector (ITU-T) Std.
[8] Shen, Y., Liu, Y., Qiao, N., Sang, L. and Yang, D. (2012) QoE-Based Evaluation Model on Video Streaming Service Quality. Proceedings of theIEEE GC Globecom Workshops, Anaheim, 3-7 December 2012, 1314-1318.
https://doi.org/10.1109/glocomw.2012.6477772
[9] Kist, A.A. and Brodie, L. (2012) Quality of Service, Quality of Experience and On-line Learning. Proceedings of the Frontiers in Education Conference (FIE) of the IEEE, Seattle, 3-6 October 2012, 1-6. https://doi.org/10.1109/fie.2012.6462223
[10] Senthamilselvan, K. and Dhevi, L. (2016) Wireless Transmission Based Image Qual-ity Analysis Using Uni-Level Haar Wavelet Transform. Circuits and Systems, 7, 1816-1821. https://doi.org/10.4236/cs.2016.78156
[11] Recommendation, ITU-R BT. (2002) 500-11, Methodology for the Subjective As-sessment of the Quality of Television Pictures. ITU Telecom. Standardization Sector of ITU.
[12] Rodríguez, D.Z. and Bressan, G. (2012) Video Quality Assessments on Digital TV and Video Streaming Services Using Objective Metrics. IEEE Latin America Trans-actions, 10, 1184-1189. https://doi.org/10.1109/TLA.2012.6142458
Video Coding Standard and Its Applications. IEEE Communications Magazine, 44, 134-143. https://doi.org/10.1109/MCOM.2006.1678121
[14] Greengrass, J., Evans, J. and Begen, A.C. (2009) Not All Packets Are Equal, Part I: Streaming Video Coding and SLA Requirements. IEEE Internet Computing, 13, 70-
75. https://doi.org/10.1109/MIC.2009.14
[15] Pedroso, C.M. and Klein, V. (2017) Application of Traffic Shaping for Quality-Pre- serving in Video Streaming over IP. WSEAS Transactions on Signal Processing, 13, 97-114.
[16] da Silva, C.A.G., Ribeiro, E.P. and Pedroso, C.M. (2016) Preventing Quality Degra-dation of Video Streaming Using Selective Redundancy. Computer Communica-tions, 91, 120-132.
[17] Lee, I. and Guan, L. (2012) Inter-Frame Dependency in Multiview Multi-Descrip- tion Video Streaming. Journal of Ambient Intelligence and Humanized Computing, 3, 87-94. https://doi.org/10.1007/s12652-011-0075-x
[18] Khan, A., Sun, L., Jammeh, E. and Ifeachor, E. (2010) Quality of Experience-Driven Adaptation Scheme for Video Applications over Wireless Networks. IET Commu-nications, 4, 1337-1347. https://doi.org/10.1049/iet-com.2009.0422
[19] Wiegand, T., Sullivan, G.J., Bjontegaard, G. and Luthra, A. (2003) Overview of the H.264/AVC Video Coding Standard. IEEE Transactions on Circuits and Systems for Video Technology, 13, 560-576. https://doi.org/10.1109/TCSVT.2003.815165
[20] Greengrass, J., Evans, J. and Begen, A.C. (2009) Not All Packets Are Equal, Part 2: The Impact of Network Packet Loss on Video Quality. IEEE Internet Computing, 13, 74-82. https://doi.org/10.1109/MIC.2009.40
[21] Vakili, A. and Gregoire, J.C. (2011) Impact of Frame Loss Position on Transmitted Video Quality: Models and Improvements. Proceedings of the 5th FTRA Interna-tional Conference Multimedia and Ubiquitous Engineering (MUE), Crete, 28-30 June 2011, 113-118. https://doi.org/10.1109/mue.2011.31
[22] Paulikas, S. (2013) Estimation of Video Quality of H. 264/AVC Video Streaming. Proceedings of the EUROCON of the IEEE,Zagreb, 1-4 July, 694-700.
https://doi.org/10.1109/eurocon.2013.6625056
[23] Orosz, P., Skopkó, T. and Varga, P. (2015) Towards Estimating Video QoE Based on Frame Loss Statistics of the video Streams. Proceedings of the IFIP/IEEE Inter-national Symposium in Integrated Network Management (IM), Ottawa, 11-15 May 2015, 1282-1285. https://doi.org/10.1109/inm.2015.7140482
[24] Venkataraman, M. and Chatterjee, M. (2014) Effects of Internet Path Selection on Video-Qoe: Analysis and Improvements. IEEE/ACM Transactions on Networking, 22, 689-702. https://doi.org/10.1109/TNET.2013.2257838
[25] Huszák, Á. and Imre, S. (2010) Analysing GOP Structure and Packet Loss Effects on Error Propagation in MPEG-4 Video Streams. Proceedings of the 4th International Symposium on Communications, Control and Signal Processing (ISCCSP) of the IEEE, Limassol, 3-5 March 2010, 1-5. https://doi.org/10.1109/ISCCSP.2010.5463469
[26] Dumitras, A. and Haskell, B.G. (2004) I/P/B Frame Type Decision by Collinearity of Displacements. Proceedings of the International Conference on Image Processing (ICIP’04), Singapore, 24-27 October 2004, 2769-2772.
https://doi.org/10.1109/icip.2004.1421678
[27] Yokoyama, Y. (2000) Adaptive GOP Structure Selection for Real-Time MPEG-2 Video Encoding. Proceedings of the International Conference on ImageProcessing, Vancouver, 10-13 September 2000, 832-835.
[28] Chen, Y., Lin, Y. and Hsieh, S. (2016) Analysis of Video Quality Variation with Dif-ferent Bit Rates of H.264 Compression. Journal of Computer and Communications, 4, 32-40. https://doi.org/10.4236/jcc.2016.45005
[29] Chen, M.J., Su, C.C., Kwon, D.K., Cormack, L.K. and Bovik, A.C. (2013) Full-Ref- erence Quality Assessment of Stereopairs Accounting for Rivalry. Signal Processing: Image Communication, 28, 1143-1155.
[30] Bernardo, M.V., Pinheiro, A.M., Fiadeiro, P.T. and Pereira, M. (2014) Quality As-sessment of Chromatic Variations: A Study of Full-Reference and No-Reference Me-trics. Proceedings of the 22nd European Signal Processing Conference (EUSIPCO), Lisbon, 1-5 September 2014, 216-220.
[31] Zinner, T., Abboud, O., Hohlfeld, O., Hossfeld, T. and Tran-Gia, P. (2010) Towards QoE Management for Scalable Video Streaming. Proceedings of the 21th ITC Spe-cialist Seminar on Multimedia Applications-Traffic, Performance and QoE, Miya-zaki, 2-3 March 2010, 64-69.
[32] Klaue, J., Rathke, B. and Wolisz, A. (2003) EvalVid—A Framework for Video Transmission and Quality Evaluation. Proceedings of the 13th International Confe-rence on Modelling Techniques and Tools for Computer Performance Evaluation (TOOLS), Urbana, 2-5 September 2003, 255-272.
https://doi.org/10.1007/978-3-540-45232-4_16
[33] FFmpeg (2016). https://ffmpeg.org/
[34] Begg, C.L. (2007) High Quality Video Streaming with SCTP over CDMA2000. MSc. Dissertation, University of Canterbury, Christchurch.
[35] Xin, J., Lin, C.W. and Sun, M.T. (2005) Digital Video Transcoding. Proceedings of the IEEE, 93, 84-97. https://doi.org/10.1109/JPROC.2004.839620
[36] Liang, Y.J., Apostolopoulos, J.G. and Girod, B. (2003) Analysis of Packet Loss for Compressed Video: Does Burst-Length Matter? Proceedings of IEEE International Conference on Acoustics, Speech, and Signal Processing (ICASSP 2003), Hong Kong, 6-10 April 2003, 684-687. https://doi.org/10.1109/icassp.2003.1200063
Submit or recommend next manuscript to SCIRP and we will provide best service for you:
Accepting pre-submission inquiries through Email, Facebook, LinkedIn, Twitter, etc. A wide selection of journals (inclusive of 9 subjects, more than 200 journals)
Providing 24-hour high-quality service User-friendly online submission system Fair and swift peer-review system
Efficient typesetting and proofreading procedure
Display of the result of downloads and visits, as well as the number of cited articles Maximum dissemination of your research work
Submit your manuscript at: http://papersubmission.scirp.org/
![Table 1. Mapping between PSNR, SSIM and MOS [31].](https://thumb-us.123doks.com/thumbv2/123dok_us/7755336.710939/4.595.205.541.647.733/table-mapping-psnr-ssim-mos.webp)