Munich Personal RePEc Archive
Determinants of Household Poverty:
Empirical Evidence from Pakistan
Majeed, Muhammad Tariq and Malik, Muhammad Nauman
Quaid-i-Azam University, Islamabad, Pakistan.
2014
Online at
https://mpra.ub.uni-muenchen.de/57744/
Determinants of Household Poverty: Empirical Evidence from Pakistan M Tariq Majeed a and M. Nauman Malikb
Abstract
This study examines household characteristics and personal characteristics of the household head as the determinants of poverty in Pakistan. The study decomposes education of the household into different levels: primary, middle, matriculation, intermediate, bachelors and higher studies and finds evidence that poverty is greatest among the less literate households and declines as education level increases. The role of remittances appeared significant in reducing probability of being poor and this is more striking in rural areas. The probability of being poor reduces in urban area implying that incidence and severity of poverty is more pronounced in rural areas. The variables that are negatively related with the probability of being poor are: experience, age square and agriculture employment status. While the variables that are positively related with the probability of being poor are: household size, age of the household head, male-headed households and the provincial residence.
Key Words: poverty; education; gender; determinants; household; Pakistan
JEL Classification: I3, J24
1. Introduction
The Millennium Development Goals (MDGs) aims at halving by 2015 the percentage of world population in 1990 with income less than US $ 1 a day and halving the share of people who suffer from hunger. Being a developing nation, poverty reduction should be our foremost obligation. An appreciable decline has occurred recently, headcount decreased from 34.46 percent in 2000-01 to 23.94 in 2004-05 (Government of Pakistan, 2006-07). However, seeing only the statistics and the trends in poverty we can just observe that what happened to poverty in different periods and also the decomposition of poverty in different years gives us a more appropriate picture of the incidence of poverty. This knowledge is useful because it informs us whether poverty is increasing or decreasing overtime. But this information does not provide us the details of the causes of poverty. For instance, is poverty high due to low education attainment or large family size or due to any other reason? Here is a need of research about the determinants of poverty that are positively or negatively linked with the poverty status. This is the area where research can be most useful because firstly we have to understand the main determinants of poverty before designing the most efficient policy to reduce poverty in the country.
A logistic regression technique has been used to evaluate the determinants of poverty in Pakistan. An important determinant of household poverty is education of the head of the household. In the Millennium Development Goals (MDGs), originated from the United Nations (UN) summit 1999, and the Poverty Reduction Strategy Paper (PRSP), promoted by World Bank and IMF, education is considered as a weapon against poverty reduction. Therefore the idea that education is a determinant of poverty occupies much attention in recent years. Since 1960s when Becker and Shultz emphasize upon the attainment of education and skills for human
development, education‟s role in the economic growth and development become prominent and
its importance in poverty reduction increases manifold. We have to seek out such vital channels
(both qualitatively and quantitatively) between education and poverty reduction that will help us in the policy formulations of poverty reduction and educational expansion.
Along with educational deprivation we will also analyze some other personal and household characteristics as well. In this regard experience, age, gender and employment status of the head of the household are important. In most of the developing countries gender discrimination is widely prevalent. Females have less educational and earning opportunities as
compared to males. That‟s why female/male headed households can be an important determinant
of poverty. Region (urban/rural) as a determinant of poverty is important in developing countries where usually agriculture sector is dominant. Moreover, the rise of industrialization coupled with migration problems persuades us to consider the region in poverty determinants. We will also extend the location variable to cover the different provinces of a country. Moreover, household size and remittance receiving status of household will also be checked.
The main objective of this study is to find the effect of different educational levels upon the probability being poor of households (considering the expenditure side) in Pakistan. Similarly, some other personal characteristics such as gender, age, experience and employment status of the head of the household and some household characteristics such as the household size, remittance receiving status, regional and provincial location will also be analyzed.
The study is structured as follows: Section 2 provides review of the literature on determinants of poverty. Section 3 is related with the data and methodology details while section 4 includes the description of regression technique and construction of variables. Section 5 provides descriptive analysis of poverty assessment. Section 6 includes the logistic estimations and interpretation of results and finally, Section 7 concludes with some recommendations.
2. Review of Literature
After the contribution of Mincer (1958) in finding the role of education in wage earnings, Schultz (1961) and Becker (1962) both viewed investment in education attainment and in skill enhancement as the necessary component of human capital accumulation. As human capital
formulation is necessary for poverty reduction that‟s why education becomes the vital and
prominent factor in reducing poverty both at income level and also at other social and capability levels.
Tilak (2002) has conducted a comprehensive analysis of the approaches of development
and well being with respect to the education‟s reflections upon poverty. According to him in
prominent approaches of development such as the human capital approach, the basic needs approach, the human development approach and the capability approach the inverse relation of education and human poverty is well recognized. The author points out that at micro level the incidence of poverty is greatest among the illiterate households and tends to decline at higher levels of education in developing countries. Moreover, (at macro level) the decline in poverty is possible through higher level of education of the population. Tilak (2002) also notes that a mutually reinforcing relation is present between education poverty (lack of education) and income poverty because income deprivation resists persons from attaining education and absence of education causes low-income level. The other notable thing regarding the education‟s significant role in poverty reduction is that Tilak vehemently mentions the direct linear relationship between education and earnings. This relation is well recognized universally i.e. with the rise of education the earnings also rise considerably.
respectively. The results show that an additional year of schooling of the head of the household increases total income of the household by the amount of 14.1%. Female-headed household is more likely to have less income as compared to male-headed but a rise in income quintile (towards non-poor) diminishes such disadvantage. Residents of rural areas are significantly poorer than those in urban areas. The interesting finding is this that the effect of education is not same in affecting all income quintiles. The return of education is bigger for the lowest quintile and decreases as the quintile increases. This shows that people from the lowest quintiles benefit more from the skills through formal education. In other words poor persons benefit more from the education attainment. For the non-monetary effects of education upon human poverty the author considers housing and health. The results show that education improves health through modifying the behavior and decisions of persons with respect to health. Housing conditions also improves with the increasing educational level because education improves its decisions and behavior regarding housing and it can avail credit facility in a better way.
Bundervoet (2006) conducts a study upon the household data of 1998-99 of Burundi. The results show that the incidence of poverty (headcount measure), poverty gap and poverty severity are worse for the female headed families as compared to male headed families, however, the
worse off element decreases as the head‟s educational achievement increases. The binary logistic
results showed the poverty status of household using explanatory variables of household and community characteristics. At rural level higher educational level of the head of the household significantly reduces the likelihood of being poor. A literate mother in the household reduces the probability of being poor. The probability of poor rises up to the age of 42 of the head and then declines. The possible reason could be the accumulation of assets for old age.
Okojie (2002) further goes in to the details of educational levels that affect the
household‟s income poverty and the human poverty using household data of 1980, 1985, 1992 and 1996 for Nigeria. In the poverty model, the logistic regression was used and it was found that all levels of education (primary, secondary and tertiary) are significant in reducing the probability of being poor of households. The results show that male-headed households are less likely to be poor than female-headed households. In the welfare model, the mean per capita expenditure was used as dependent variable and educational variables found to be significant in increasing the per capita expenditure of the household.
Abuka et.al. (2007) estimate the determinants of poverty in the case of Uganda using logistic regression technique and the data from Uganda National Household Survey (UNHS).
The results showed that an increase in the schooling of household heads not only has a positive impact on the productivity and earnings but also enhances the productivity of other members of the household. The household size and being in rural areas significantly increase the likelihood of being poor.
Coulombe and Mckay (1996) used multivariate analysis to analyze the determinants of poverty in Mauritania based on household survey data for 1990. They estimated a multinomial logit model for the probability of being poor depending on household specific economic and demographic explanatory variables. The authors found that low education, living in a rural area and a high burden of dependence significantly increase the probability of being poor of household.
threshold of human capital but secondary and higher education, and investment in science and technology give rise to acceleration and sustenance in economic growth and development. The coefficient of correlation in India suggests that illiteracy, literacy and primary education are positively related with the poverty ratios. While, on the other hand middle and secondary education are negatively related. Moreover, in the simple regression secondary and higher education is inversely related with poverty. Thus secondary and higher education is important in the inverse relation of education and poverty apart from primary education.
The above mentioned studies consider education as a vital weapon against poverty but Dollar and Kraay (2002) argue that education doesn‟t have any substantial or measurable effect on the income of the poor except its effect upon the overall average growth. They conduct a macro level study based upon the data of 137 countries for the years 1950-99. They reported that income of poor raises one for one with average income (growth) but the primary education attainment has a very limited impact upon the income of the poor. They conclude that economic growth is a prominent factor in eliminating poverty and primary education completion is not so much important.
The similar conclusion was proposed by Tilak (2005) in studying the correlation coefficients between the poverty ratios of 1999-00 and percentage of population having different educational levels in 1995-96 in India. The results show that illiteracy, literacy and primary education are positively related with the poverty. Hence it casts doubt upon the role of primary education in poverty reduction.
Gundlach et al. (2001) did a study on 102 countries using the quality adjusted broader measure of human capital, which depends upon the social returns of educational levels and an index of quality. The findings show that the income of the poor (lowest quintile) increases with the rising quality-adjusted human capital. They estimate that a 10% increase in the stock of quality adjusted human capital per worker increases the average income of the poor by 3.2%. Majeed (2010) shows the poverty reducing effect of human capital in the case of Pakistan using the data over the period 1970-2004. In a recent study, Majeed (2012) finds mixed evidence for the relationship of poverty and human capital using a sample of sixty five developing countries over the period 1970-2008.
Through analyzing different studies we can see that it is necessary that we must know the determinants of poverty for an effective poverty reduction strategy. Rather than focusing on macro level and cross country analyses we have to go for the micro level research for the proper evaluation of the poverty determinants. Dealing with micro level data we are engaging in the ground realities and micro circumstances of any particular country. Micro level data approach is very much relevant for the poor developing countries whose main problems are widely prevalent at grass root levels while macro data based studies do not represent the effects of those problems in their data with aggregates or averages.
3. Methodology
This study evaluates the personal and household characteristics as determinants of poverty in Pakistan. We show that how the occurrence of any particular event will affect the likelihood of the household being poor. For instance, in what proportion the acquisition of primary education will increase or decrease the likelihood of being poor with respect to „no education‟.
in other dimensions of poverty such as deprivation in decision making abilities, and awareness about the surrounding. Hence it is expected that education is negatively linked with the poverty status and higher levels of education are more effective in poverty reduction.
Experience can be taken as the improvement in expertise and skill enhancement, which have positive implications for poverty elimination. The „feminization of poverty‟ means women are much more deprived and facing severe hardships in pulling themselves out of poverty as compared to men therefore it is expected that being female-headed household will increase the likelihood of the household being poor. The age of the head of the household is going to be seen in non-linear relation. Generally, in the working age of the head of the household when one can accumulate human capital there are more chances to be non-poor as compared to the old age. However, in the opposite case it is said that until the old age (or after retirement) one can accumulate enough resources or assets to be non-poor in old age as compared to the working middle age.
A large portion of population in Pakistan is directly or indirectly linked with our traditional agriculture sector hence its important to find out that whether the agriculture employment status as compared to non-agriculture employment status of the household head is effective in reducing household poverty or not. Population is a resource but its huge size and high growth rate in developing countries appeared to be a problem due to low level of human capital. Hence usually family size is positively related with the poverty status of the household.
Remittance, whether domestic or foreign, is a source of income for the household and reduces household poverty. It is a widely prevalent idea that in Pakistan the incidence and severity of poverty is high in rural areas as compared to urban areas hence to verify such statement we have to see whether the rural location of the household is associated with being poor or not. In the same way we can analyze the provincial location of the household as well.
Having been provision of theoretical consistent arguments, we have developed this model with choice variables comprising of the personal characteristics of the head of the household and household characteristics. In this regard, education, experience, gender, age and employment status of the household head are considered as personal characteristics of the household while household size, provincial location, regional location and remittance receiving status are considered as the household characteristics.
POVERTY = f (EDU, GEN, AGE, EXP, EMP, HS, REM, REG, PRO)
Dichotomous dependent variable: Poor = 1,Non-poor = 0
Explanatory variables: Personal characteristics of the household head
Education (EDU)
Primary Education Primary = 1, Otherwise = 0 Middle education Secondary = 1, Otherwise = 0 Matric Education Matric = 1, Otherwise = 0 Intermediate Education Intermediate = 1, Otherwise = 0 Bachelors education Bachelors = 1, Otherwise = 0
Professional education Masters or above education=1, Otherwise=0 No education Reference Category
Gender (GEN) Male = 1, Female = 0
Employment status (EMP) Agriculture = 1, Not agriculture = 0
Experience (EXP) Age-School starting age-Years of schooling
AGE Age, Age2 (Square of Age)
Household characteristics
Remittances (REM) Remittance = 1, Not = 0
Household size (HS) Number of individuals in family
Province (PRO)
Punjab Punjab = 1, Otherwise = 0 Sindh Sindh = 1, Otherwise = 0 NWFP NWFP = 1, Otherwise = 0 Balochistan Reference Category
4. Data, Construction of Variables and Econometric Technique
The data for this study is taken from Household Income and Expenditure Survey (HIES) 2001-02 which is conducted by the Federal Bureau of Statistics (FBS) of Pakistan. It‟s the available gigantic and meaningful source of information of its kind that has the household level information in Pakistan. The selected data used for this study covers the four provinces of Pakistan (Punjab, Sindh, Balochistan and NWFP).
The very first thing is to clarify the criteria through which we classify the households into poor and non-poor. In other words we can say that how we assign value of one (poor) or zero (non-poor) to the dependent dichotomous variable. For this task, there are different approaches such as the basic needs approach or the calorie-based approach; but here we use the method of quintiles. We make four quintiles of households depending upon the monthly per adult household expenditure. The lowest (fourth) quintile will have the households with the lowest monthly per adult household expenditures. The households in the lowest quintile are considered poor and consequently dependent variable takes value one for them whereas each household in other three quintiles take the value zero. The household expenditure variable is the monthly per adult expenditure of the household considering all the food and non-food items. To calculate the adult equivalents we make use of the official calories chart (2003) with respect to age, provided by the Government of Pakistan.
Considering the explanatory variables of our model the personal characteristic variables will be used for the head of the household. The educational variables are dummy variables and
one of them will get the value one in response to the household head‟s highest educational
attainment. It means the educational level of the household‟s head will either fall in primary, secondary, matriculation, intermediate, bachelors or professional (masters and above) category.
Here „no education‟ is used as reference category. Other variables include age, experience and
employment status of the household‟s head. Here the employment status is characterized into
Table 1: Construction of Explanatory Variables
Categories Variables Explanation Education
(Dummy)
Primary Middle
Matric (Matriculation) Inter (Intermediate) Ba (Bachelors) Prof (Professional)
No education (reference category)
1= primary, 0= otherwise Similarly, we make other education variables.
Age Age
Age2
Age
Square of age
Experience Exp EXP = Age - years of schooling -school starting age
Household Size Mem Number of family members
Employment Status
(Dummy)
Agri
Non-agri. status (reference category)
1=agriculture status, 0=otherwise.
Remittances
(Dummy)
Rem
Without remit. is reference category
1=remittance receiver, 0= not receiver.
Gender
(Dummy)
Male
Female (reference category)
1=male, 0=not male (female).
Province
(Dummy)
Punjab Sindh NWFP
Baluchistan (reference category)
1=Punjabi, 0=not Punjabi
Similarly, we construct the Sindh and NWFP variables.
Region
(Dummy)
Urban
Rural (reference category)
1=Urban ,
0=otherwise (rural).
This study takes the Logistic Regression Technique to identify some determinants of poverty in Pakistan at household level. The model is estimated using the information of the four provinces of Pakistan. The binary logistic regression is used to identify the effect of explanatory variables upon the probability of being poor of the household. The dependent variable is dichotomous in which the value 1 for the poor household and 0 for the non-poor household. The results will not be interpreted through the coefficients but we will use the odd ratios in logistic regression to see that the occurrence of any particular event will increase or decrease the probability being poor of household and with what proportion as compared to the reference category.
5. Poverty Assessment: A Descriptive Analysis
This study examines the personal characteristics and household characteristics as the determinants of poverty in Pakistan. Therefore it would be convenient to understand the results if we see the graphical representation of the poverty assessment in selected dimensions. The descriptive analysis is based upon the demonstration of average number of poor households in the particular dimensions. Hence the dimensions, which are going to be demonstrated, are the education, gender and regional location.
5.1 Poverty and Education
household head increases, on average the number of poor households declines. There is a consistent reduction in poverty from no education to the bachelor‟s level.
0 0.05 0.1 0.15 0.2 0.25 0.3 0.35
Po
ve
rty
In
cid
en
ce
o
n A
ve
ra
ge
No educ ation
Prim
ary Middle Matric Interm
ediateGraduate Pro
fession al
[image:9.612.73.521.86.302.2]Education of the Household Head
Figure 1: Education Dimension of Poverty
5.2 Poverty and Regional Location
Rural areas are much deprived as compared to the urban areas in Pakistan. One of the important reasons is the low productivity and consequently, the low incomes in the rural areas. Moreover, rural areas are much more vulnerable to natural calamities especially the floods and droughts. There is a huge gulf between the rural and urban areas in terms of facilities and opportunities that shows the biased government policies against rural areas. That‟s why we observe the regional migration phenomenon especially for quality education and employment opportunities.
Incidence, depth and severity of poverty are high in rural areas as compared to urban areas in Pakistan (Jamal, 2005). Our graphical demonstration of the data in Figure 2 shows that on average poor households are much more in rural areas as compared to urban areas.
5.3 Poverty and Gender
female-headed households face difficult circumstances to escape the poverty. The descriptive analysis in Figure 3 shows the surprising result that on average the poor female-headed households are small as compared to male-headed households. One reason behind this result could be the under-representation of female-headed households because there are cultural reasons to believe that many of the households that showed themselves male-headed are actually the female-headed households.
The graphical activity demonstrates the results about poverty incidence on average or aggregate basis. Cognizant of this descriptive analysis, now we are able to relate this information with our regression results to have a more vivid picture about the poverty determinants.
6. Results
The logistic regression technique has been applied to evaluate the personal characteristics of the
household‟s head and household characteristics as the determinants of household poverty in
[image:10.612.77.504.158.340.2]Pakistan. The personal characteristics include education, gender, age, employment status and experience. The household characteristics include regional location, provincial location, household size and remittances.
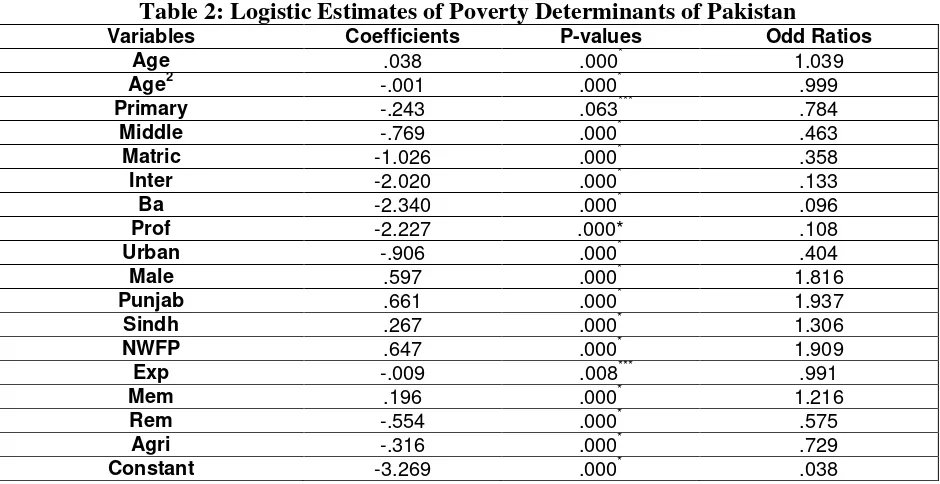
Table 2 reports the result for four provinces. The separate provincial and regional results are reported in the appendix. The Wald test is used to test the significance of coefficients and interpret the results using odd ratios. All the educational variables of the household head are highly significant in reducing the probability being poor of the household. The primary, middle, matriculation, intermediate, bachelors and higher studies (professional category) education of the household head reduce the likelihood of the household being poor by 22%, 54%, 64%, 87%, 90% and 89% respectively as compared to the reference category of „no education‟.
educational levels have shown that all levels are reducing the chances of poverty in greater proportion in urban areas as compared to the rural areas except the primary education.
[image:11.612.72.542.267.509.2]If the employment status of the household head falls in the category of agriculture status (owner cultivator, share cropper, contract cultivator or livestock owner) then this reduces the probability of household being poor by 27% as compared to the base category of non-agriculture status. For age of the household head, we observed the positive sign for the variable age and the negative correlation is found between the poverty status of household and square of age. The age variable shows that as the age of the head increase by one year the chances of the household being poor will significantly increase by 3.9%. However the age-square variable shown negative sign which means in the older ages of the household head likelihood of the household being poor declines by 0.1%. Although the experience has a little effect but as the experience of the head of the household increases by one year then it reduces the chances of the household being poor by 0.9%.
Table 2: Logistic Estimates of Poverty Determinants of Pakistan
Variables Coefficients P-values Odd Ratios
Age .038 .000* 1.039
Age2 -.001 .000* .999
Primary -.243 .063*** .784
Middle -.769 .000* .463
Matric -1.026 .000* .358
Inter -2.020 .000* .133
Ba -2.340 .000* .096
Prof -2.227 .000* .108
Urban -.906 .000* .404
Male .597 .000* 1.816
Punjab .661 .000* 1.937
Sindh .267 .000* 1.306
NWFP .647 .000* 1.909
Exp -.009 .008*** .991
Mem .196 .000* 1.216
Rem -.554 .000* .575
Agri -.316 .000* .729
Constant -3.269 .000* .038
* denotes statistically significant at the 1% level. ** denotes statistically significant at the 5% level. *** denotes statistically significant at the 10% level.
appendix the remittance effect in the separate urban and rural regressions reduces the chances of poor by 36% and 43% respectively. Considering the provincial location variables, being in Punjab, Sindh and NWFP increases the chances of the household being poor by 94%, 31% and 91% respectively as compared with the base category of Balochistan. In appendix one additional determinant is evaluated considering the data of four provinces of Pakistan. The additional variable named as earners, which counts the number of earners per household that have any level of education. With the increase of one educated earner significantly reduces the probability of household being poor by 11%. However, almost all other results remain intact except the experience variable, which becomes insignificant.
7. Conclusion
The purpose of this study was to estimate the determinants of household poverty in Pakistan. The data used for this task is taken from the Household Integrated Economic Survey (HIES 2001-02)
conducted by the Federal Bureau of Statistics. The determinants of poverty are explored using the logistic regression technique. This study shows that the variables that are positively related
with the poverty status of the household are head‟s age, household size, male- headed households and the provincial residences. The variables that are negatively related are the education level of
the household‟s head, experience, agriculture employment status, living in urban region and remittance receiving.
The analysis showed that increase in the educational attainment has an important impact on reducing the probability that a household is poor. The dummy variables for education representing increasing levels of educational achievement show that as educational achievement increases, the probability of being poor decreases. Therefore, educational attainment is a critical determinant of the incidence of poverty and should be considered closely in implementing poverty alleviation programs. Moreover, primary education is effective in reducing poverty at rural level as compared with the urban level. This is possibly due to the difference of employment opportunities in rural and urban areas. In rural areas, the primary education is playing its role in increasing the farm productivity and consequently the earnings whereas in urban areas primary education is not so much effective.
Having a large household size is significantly and positively related with the poverty status. However, we have observed that number of earners in a household that have any level of education increase earning potential and therefore decrease the risk of poverty. Experience is also negatively related because as the age and experience grow a person‟s expertise in particular field enhances which provides him an opportunity to earn higher. Age being determinant of the household poverty has demonstrate that in the beginning the age increases the likelihood of household being poor but in higher years or older age the head of the household accumulate enough resources or assets which are sufficient to increase the chances of the household to be non-poor.
significant in distinguishing non-poor from poor because remittances increase the income of the household. Its role appeared more striking in rural areas.
References:
Abuka C A, Ego M A, Opolot J and Okello P (2007) “Determinants of Poverty Vulnerability in Uganda”, Discussion Paper No. 203, Institute for International Integration Studies.
Bundervoet T (2006) “Estimating Poverty in Burundi”, Working Paper No. 20, Households in Conflict Network (HiCN).
Coulombe H and McKay A (1996) “Modeling Determinants of Poverty in Mauritania”, World Development, 24 (6), 1015-31.
Dollar D and Kraay A (2002) “Growth is Good for the Poor”, Journal of Economic Growth, 7, 195-225.
Gundlach E, Pablo J N D and Weisert N (2001) “Education is Good for the Poor”,
Discussion Paper No. 2001/137, World Institute for Development Economics Research (WIDER).
Government of Pakistan (2006-07) “Pakistan Economic Survey”, Ministry of Finance
Islamabad.
Jamal H (2005) “In Search of Poverty Predictors: The Case of Urban and Rural Pakistan”, The Pakistan Development Review, 44 (1), 37-55.
Majeed M. Tariq (2010) “Poverty and Employment: Empirical evidence from Pakistan” The Forman Journal of Economic Studies, Vol. (6) No.1
Majeed M. Tariq (2012) “Poverty Consequences of Globalization in OIC Countries: A Comparative Analysis” The Pakistan Development Review, Vol. (51) No.4, 479–492.
Okojie C E (2002) “Gender and Education as Determinants of Household Poverty in
Nigeria”, Discussion Paper No. 2002/37, World Institute for Development Economics Research (WIDER).
Tilak J B G (2002) “Education and Poverty”, Journal of Human Development, 3 (2), 191-207.
Tilak J B G (2005) “Post Elementary Education, Poverty and Development in India, Working
Paper Series-N6 (REVISED), Centre of African Studies, University of Edinburgh.
Zuluaga B (2007) “Different Channels of Impact of Education on poverty: an analysis for
13 App en d ix: FEMALE MALE GENDER Odd ratios P-values Coefficients Odd ratios P-values Coefficients 1.057 .155 .055 1.036 .000 .035 Age EXPLANATORY VARIABLES .999 .075 -.001 1.000 .000 .000 Age2 1.157 .809 .146 .795 .087 -.229 Primary .875 .841 -.133 .484 .000 -.727 Middle .001 .553 -7.288 .375 .000 -.980 Matric .001 .709 -7.203 .140 .000 -1.966 Inter .001 .725 -6.918 .092 .000 -2.387 Ba .001 .780 -7.194 .115 .000 -2.162 Prof .427 .000 -.850 .456 .000 -.786 Urban .973 .156 -.028 .993 .035 -.007 Exp 1.220 .000 .199 1.199 .000 .181 Mem .546 .002 -.604 .719 .000 -.329 Rem .108 .013 -2.228 .101 .000 -2.290 Constant
14 BALOCHIST AN NWFP SINDH PUNJAB PROVINCE Odd Ratios P-values Coefficie nts Odd Ratios P-values Coefficie nts Odd Ratios P-values Coefficie nts Odd Ratios P-values Coefficie nts 1.060 .030 .058 1.075 .002 .073 1.007 .692 .007 1.041 .007 .040 Age EXPLANATORY VARIABLES .999 .010 -.001 .999 .000 -.001 1.000 .352 .000 .999 .000 -.001 Age2 1.180 .683 .166 .782 .478 -.246 .739 .225 -.302 .720 .095 -.328 Primary 1.022 .957 .022 .649 .187 -.432 .534 .023 -.627 .336 .000 -1.092 Middle .859 .642 -.151 .484 .016 -.725 .439 .001 -.822 .211 .000 -1.556 Matric .321 .025 -1.137 .147 .000 -1.915 .203 .000 -1.594 .065 .000 -2.728 Inter .154 .001 -1.870 .140 .000 -1.963 .110 .000 -2.208 .080 .000 -2.526 Ba .251 .015 -1.384 .160 .001 -1.831 .085 .000 -2.459 .060 .000 -2.812 Prof .459 .000 -.778 .522 .000 -.650 .246 .000 -1.40 .428 .000 -.849 Urban 1.932 .189 .658 1.419 .053 .350 1.268 .577 .238 2.376 .000 .865 Male .972 .010 -.029 .987 .127 -.013 .993 .300 -.007 .995 .361 -.005 Exp 1.186 .000 .171 1.140 .000 .131 1.279 .000 .246 1.251 .000 .224 Mem .690 .286 -.370 .506 .000 -.681 1.161 .722 .150 .681 .000 -.384 Rem .775 .059 -.255 .820 .095 -.199 .950 .610 -.051 .551 .000 -.596 Agri .027 .000 -3.623 .047 .000 -3.066 .091 .000 -2.396 .053 .000 -2.931 Constant
15 RURAL URBAN REGION Odd Ratio P-value Coeffici ent Odd Ratio P-value Coeffici ent 1.027 .019 .027 1.048 .007 .047 Age EXPLANATORY VARIABLES 1.000 .001 .000 .999 .000 -.001 Age2 .712 .037 -.340 .802 .310 -.220 Primary .523 .000 -.647 .444 .000 -.812 Middle .345 .000 -1.06 .331 .000 -1.107 Matric .110 .000 -2.211 .104 .000 -2.261 Inter .092 .000 -2.384 .078 .000 -2.555 Ba .172 .000 -1.763 .065 .000 -2.739 Prof 1.575 .001 .454 1.696 .001 .528 Male .994 .159 -.006 .991 .113 -.009 Exp 1.204 .000 .186 1.205 .000 .186 Mem .576 .000 -.552 .642 .000 -.443 Rem .750 .000 -.288 Agri .059 .000 -2.831 .069 .000 -2.679 Constant