A Novel Stochastic Framework for the Optimal Placement
and Sizing of Distribution Static Compensator
Reza Khorram-Nia*, Aliasghar Baziar, Abdollah Kavousi-Fard
Department of Electrical and Computer Engineering, Safashahr Branch, Islamic Azad University, Safashahr, Iran. Email: *[email protected], [email protected], [email protected]
Received February 28th,2013; revised April 29th, 2013; accepted May 6th, 2013
Copyright © 2013 Reza Khorram-Nia et al. This is an open access article distributed under the Creative Commons Attribution Li- cense, which permits unrestricted use, distribution, and reproduction in any medium, provided the original work is properly cited.
ABSTRACT
This paper proposes a new stochastic framework based on the probabilistic load flow to consider the uncertainty effects in the Distribution Static Compensator (DSTATCOM) allocation and sizing problem. The proposed method is based on the point estimate method (PEM) to capture the uncertainty associated with the forecast error of the loads. In order to explore the search space globally, a new optimization algorithm based on bat algorithm (BA) is proposed too. The ob- jective functions to be investigated are minimization of the total active power losses and reducing the voltage deviation of the buses. Also to reach a proper balance between the optimization of both the objective functions, the idea of inter-active fuzzy satisfying method is employed in the multi-objective formulation. The feasibility and satisfying perform-ance of the proposed method is examined on the 69-bus IEEE distribution system.
Keywords: DSTATCOM Allocation; Uncertainty; Multi-Objective Optimization; 2m Point Estimate Method
1. Introduction
According to the failure statistics, the distribution sys- tems play the most significant role in the unavailability of electrical services to the consumers [1,2]. Therefore, any planning or technique which can improve the total condition of the distribution systems should be assessed precisely such that the maximum efficiency and profit is achieved. In this regard, the utilities have been looking for new methods to improve the total system electrical services from both operation and planning points of view. Among the most well-known and popular methods can be named the optimal management of the shunt capaci- tors, shunt reactors, automatic voltage regulator, series capacitors or recently distribution network flexible AC transmission system (DFACTS) technologies such as distribution static compensator (DSTATCOM) [3].
In comparison to the other reactive power compensa- tion devices, DSTATCOM has especial useful character- istics such as low harmonic production, low power losses, high regulatory ability and small size [4]. In addition, in comparison to some popular reactive power compensa-tions methods such as shunt capacitor placement strategy or series capacitors, the DSTATCOM does not have any operational issues such as resonance or transient har-
monics as which are caused by switching. Another useful and significant aspect of the DSTATCOM is that it can clean up the voltage from any unbalance or harmonic distortion [5]. In fact, the DSTATCOM can compensate the load demand locally such that in the case of load variations it is regulated automatically. In the long time, the total load consumption in the power system is in- creased. Here again the DSTATCOM can be the most effective device to maximize the power system loadabil- ity, stability and reactive power compensation when re- ducing the resistive losses. In the area of the area of power quality, it will improve the quality of the electrical services by improving the flicker suppression, voltage regulation and voltage balancing [6].
According to the above discussion, it is deduced easily that the DSTATCOM device can play a significant role in the optimal operation and management of the future distribution networks. From the utility point of view, the most significant issue is to reduce the amount of MW power losses by reducing the resistive losses [7-10]. An- other significant target is to improve the network power quality by improving the voltage of the buses. Improving the bus voltage can improve the electrical services by reducing the costs of damaging sensitive electrical de- vices as well as reducing the number of interruptions in the system. The significance of this objective function
can be seen in several literatures [11-13]. Nevertheless, in the area of DSTATCOM allocation there is yet very little works available to see its effect on the distribution network from different aspects. In [14], the DSTATCOM allocation problem is assessed considering the objective functions of active power losses and voltage profile si- multaneously. Nevertheless, neglecting the uncertainty associated with the active and reactive loads is a big shortage of the analysis which can reduce the depend- ability of the final results. In [15], the optimal DSTAT- COM allocation and sizing is investigated to mitigate the voltage fluctuations in the network. Here, the simultane- ous effect of the distribution generation (DG) on the op- timal DSTATCOM allocation is assessed. However, again the uncertainty of the random variables is ne- glected here.
Therefore, the main purpose of this paper is to propose a new stochastic framework based on 2 m point estimate method (PEM) to capture the uncertainty associated with the active and reactive loads in the analysis. The pro-posed stochastic method will convert the stochastic DSTATCOM allocation problem to 2 m equivalent de-terministic problems with different probabilities. In order to model the uncertainty of the loads, the normal distri-bution function with zero mean value is considered for each load value. The 2 m PEM will replace each random variable (here active and reactive loads) with two new concentrations points using just the first few statistical moments of the random variable. Therefore, for a prob- lem with m number of random variables, 2 m runs of the deterministic load flow are required to solve the prob- abilistic problem. The main popularity of 2 m PEM roots in the very little data which are required about the ran- dom variables of the problem. The objective functions which are investigated in the analysis are the total active power losses and the voltage profile. In order to handle both of the objective functions, a novel interactive fuzzy satisfying method is proposed. Since the investigated problem considering the uncertainty of the active and reactive loads is a complex and nonlinear optimization problem, it requires a powerful tool to escape from local optima as well as premature convergence. Therefore, a new optimization method based on modified bat algo- rithm (MBA) is proposed to explore the search space globally. In order to see the effectiveness and satisfying performance of the proposed method, the 69-bus IEEE radial distribution system is chosen as the case study. The rest of the paper is organized as follows: in Section 2, the objective functions and the relevant constraints are explained. In Section 3, the DSTATCOM modeling is described. In Section 4, the 2 m PEM is described com- pletely. In Section 5, the optimization technique and the multi-objective formulation are explained. The simula- tion results are shown in Section 6. Finally, in Section 7, the main remarks and conclusions are discussed.
2. Problem Formulation
In this section, the objective functions and the relevant equality and inequality constraints are described com- pletely.
2.1. Objective Functions
Minimization of the Active Power Losses (f1): The
active power losses objective function is the summation of the resistive power losses of the network branches. Mathematically, total active power losses can calculated as follows:
21 loss
1 br
N
i i
i
f X P X R I
(1)whereRiis the resistance of ith branch, Ii is the current
of ith branch, is the number of branches and X is the
control vector. br
N
Minimization of the Voltage Deviation (f2): The
voltage profile of the system is improved by reducing the maximum voltage deviation of the buses from the nomi- nal voltage value. Therefore, this target can be evaluated as follows:
2 volt max 1 min , 1 m
f X d X V V ax (2)
where min and Vmax are the minimum and the maxi-
mum value of voltage magnitudes of V ith bus.
2.2. Limits and Constraints
Maximum Power Flow Constraint: This limit is associ-
ated with the maximum power transfer capacity of the distribution lines which should be observed during the optimization process.
Line Line ,max
ij ij
P P (3)
where is the active power flow over the distribu- tion lines of buses i and j. Also, is the maximum active power flow which is allowed to flow between the buses i and j.
Line
ij
P
Line ,max
ij
P
Distribution Power Flow Equations: This limitation
consists of two power flow equations which can be con- sidered as an equality constraint.
bus
bus
1 1
cos
sin
N
i i j ij ij i
i N
i i j ij ij i
i
P VV Y
Q VV Y
j
j
(4)
where Vi is the voltage magnitude of ith bus, i is the
voltage angle of ith bus,
ij is the admittance magnitude
between the buses i and j,
Y
ij
is the admittance angle between the buses i and j, bus is the number of buses,
is the net active power injection to the N ith bus and i
is the net reactive power injection to the ith bus.
Bus Voltage Constraints: During the optimization
process, the voltage level of the buses should be pre- served in the pre-determined limited values as follows:
min i max
V V V (5)
Feeder Current Limitation: The main feeders of the
network can supply a maximum current magnitude as follows:
max
, , ; 1, 2, ,
f i f i f
I I i N (6)
where If i, is the current of the ith feeder, max
,
f i
I is the maximum current of the ith feeder and
f
N is the num- ber of feeders.
3. DSTATCOM Modeling
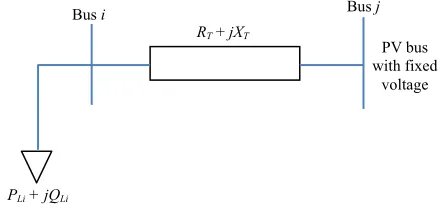
The Static Synchronous Compensator (STATCOM) as a member of the Flexible AC Transmission Systems (FACTS) devices is a regulating power utility which is connected to the power system in shunt mode. Once the STATCOM is used in the voltage level of distribution system is called Distribution STATCOM or shortly DSTATCOM. The DSTATCOM device works based on the power electronics voltage source converters and can either produce or consume the reactive power of the electrical network at the coupling point. Nevertheless, in the case of using a power source, it can also provide ac- tive power simultaneously. In the DSTATCOM, the voltage level is generated from a DC capacitor. Therefore, the direction and amount of reactive power is determined by the magnitude of the voltage source. In the case that the magnitude of the voltage source is higher than that of the connection point, the DSTATCOM will produce re- active power and so will work as a variable capacitor. However, if the magnitude of the voltage source is lower than the voltage of the connection point, the DSTAT- COM will work as a reactor and so will absorb reactive power.
In the steady state load flow analysis, the accurate DSTATCOM model should consist of the steady state power losses including the transformer and inverter power losses. Technically, the load flow model of the STATCOM is considered to be appropriate for the DSTATCOM device [14]. Therefore, considering the bus
i with the active and reactive load values of PLi jQLi,
the DSTATCOM can be supposed as a new PV bus (we name it bus j) with fixed voltage value which is con- nected to the bus i. Since we have supposed that there is no power source connected to the DSTATCOM, thus it can just supply reactive power in the network. In the other words, the amount of active power production is assumed zero. In order to model the active power losses of the transformer connection and the inverter, the series
reactance and resistance T T are utilized [4]. The
schematic diagram of the model is shown in Figure 1.
R jX
SF z
, l l k, z;
4. Uncertainty Modeling
In this section, a stochastic framework based on 2 m PEM is proposed to consider the uncertainty associated with the forecast error of the active and reactive loads. In comparison to the other well-known methods in the area, the 2 m PEM requires little statistical data of the prob- ability density function of the random variables. Mathe- matically, the load flow equations can be described as follows [15]:
(7)
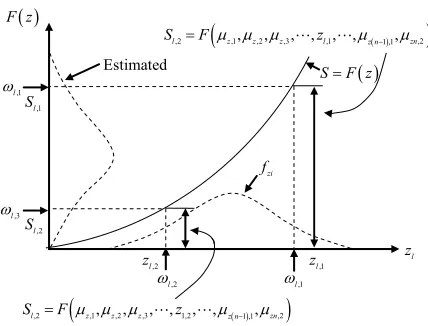
where z is the input uncertain vector and S is the output uncertain vector. The main idea behind the 2 m PEM is to replace the random variable zl (with probability of fzl)
with two concentration points zl,1 & zl,2 as follows:
1,
l
l k z
z k 2 (8) where zl is the mean value of the random variable zl
and zl is its standard deviation. Here ζl,k is called the
standard location and is evaluated is as follows:
3
21 k
,3 2
, ,3 2 , 1, 2
2
l
l k m l k
(9)
The impact of the two locations zl,1 & zl,2 on the output
variable is determined by the two weighting factors l,1,
,2
l
respectively. This process is shown in Figure 2.
According to Figure 2, the location moments ,1 & ,2
l are transferred to the output data l,1 & via
Equation (7). Finally, the skewness coefficient
l
z ,2
l
S
z S
l,3 asthe third central moment is calculated as bellow:
3
3 l l
l z
z
E z
,3
l
(10)
Here E is the expected value. In order evaluate the standard deviation of Si, the bellow equation should be
evaluated:
Bus i
PV bus with fixed
voltage
j RT+ jXT
Bus
[image:3.595.312.533.604.710.2]PLi + jQLi
F z
SF z
,2 ,1, ,2, ,3, , ,1, , 1 ,1, ,2
l z z z l z n zn
S F z
,1
l
,2
l
z zl,1 zl
,2
l
,2 ,1, ,2, ,3, , 1,2, , 1 ,1, ,2
l z z z z n zn
[image:4.595.64.278.83.246.2]S F z ,1 l ,3 l Estimated zi f ,1 l S ,2 l S
Figure 2. Schematic representation of 2 m PEM.
2
2var Si E Si E Si
(11)
5. Optimization Technique
In this section, the proposed modified BA as well as the interactive fuzzy satisfying method based on membership function is described.
5.1. Original Bat Algorithm
The BA is a population based optimization algorithm which was first introduced by Xin-She Yang in 2010 [16]. The BA simulates the searching ability of the bat animals for the food by using the echolocation phenomena. In definition, the echolocation is defined as the process of sending a signal to the environment and after that waiting to hear its echo. The BA is based on 3 main ideas [16]: 1) the distance is sensed by the echolocation phenomena; 2) each bat in the search space
Xi flying with the veloc-ity of vi will produce a signal with frequency frei, the
wavelength Γiand loudness Ai; and 3) it is supposed that
the loudness Ai can vary from the initial large value A0 to
its specific minimum value Amin. Initially, the BA popu-
lation is generated randomly. After evaluating the objec- tive function for each bat, the entire population is up- dated in each iteration k as follows:
min max m
best in 1
1 1
i
i i i
i
k k k
i i i
k k k
g
fre fre fre fre
v v X fre
X X v
X (12)
where fremax fremin are the maximum/minimum values
of the bat signal frequency, is the velocity of the ith
bat in kth iteration and
k i v
is a random number in the range [0,1]. Each bat is also updated in another way. In this regard, for each bat, a random value
randi
is firstproduced. If is greater than the frequency rate of the relevant bat thus a new test solution is generated
as follows: randi i r new old k
X X A (13) where is a random number in the range [0,1]. The above formulation is much similar to the particle swarm optimization (PSO) algorithm updating process. On the other hand, if is less than i then a new test so-
lution is generated randomly. The generated test solution is accepted if both the bellow criteria are satisfied:
randi r
bestrand i
i g
A
f X f X
(14)
In the above equation, is a random number in the range [0,1]. Also
rand
best
g is the best bat found in the
population. The process of updating
X
k i
A and in each iteration is as follows:
k i r
1
1 0 1 exp
k k
i i
k
i i
A A
r r k
(15)
where and are constant values of BA.
5.2. Modified Bat Algorithm
The original BA has good characteristics such as simple concept, easy implementation, fast convergence, generic application, etc. However, in order to empower the per- formance of the algorithm in face of complex multi-ob- jective optimization problems, a new modification is proposed in this section. The main idea is to increase the diversity of the BA population. This process is simulated such that the worst bat should move toward the best global bat which is found with more acceleration than the bat with better position. In fact, the acceleration move- ment of each bat in the population toward Xgbest is de-
termined according to its distance from gbest. There-
fore after updating the BA population as described in Section 5.1, the proposed modification is applied. In this regard, the in each iteration and for each bat i
X
X , the Cartesian distance of the Xi from the best bat in the
population Xgbest is calculated.
, best best best, ,
1
best best,1 best,2 best,
,1 ,2 ,
, , , , , ,
d
i g g i g k i k
k
g g g g d
i i i i d
D X X x x
X x x x
X x x x
(16)where d is the length of the control vector X. Now, an attractiveness parameter is defined for Xgbest as fol- lows:
0exp Di g, best
(17)decreasing function. As it can be seen, as much the dis- tance of Xi is from Xgbest, the lower value the variable
will take. This formulation is useful to reach a trade- off in the updating process. Now, the position of the bat
Xi is updated as follows:
mization problem to its equivalent unconstraint one using the idea of penalty factors as follows (see Equation (20) below):
where h Xj
is the jth equality constraint and
j g X
is the jth inequality constraint. Also, N
eq and Nueq show
the number of equality and inequality constraints respec- tively. The penalty factors L1 and L2 are employed to
meet the equality and inequality constraints. In this paper, the values of penalty factors are assumed 108.
new 1 best
rand 1
π
2
i g k
k
X X X u
u
(18)
Step 3: Generate the initial bat population randomly. Each bat indicates a promising optimal location and size for the DSTATCOM devices in the network.
where is the absorption coefficient which is em- ployed to control the brightness reduction rate (light in- tensity).
π
Step 4: Calculate the fitness function. In this step, the stochastic load flow based on 2 m PEM is run to calcu- late the expected value of the active power losses and the voltage deviation objective functions for each solution or bat.
The first two terms of the above equation are used to balance between the Xi and gbest and the third term is
used for random movement in the search space.
X
5.3. Fuzzy Interactive Step 5: Apply the interactive fuzzy satisfying method
to convert the multi-objective optimization problem to the equivalent single objective one. Here the membership function value of each objective function is calculated. As mentioned before, the problem which is investigated
here is a kind of multi-objective optimization problem with several equality and inequality constraints. As the result of the nature of the multi-objective optimization problems, improving any of the objective functions may result in destroying the optimal value of the other objec- tive function. Therefore, here a sufficient multi-objective framework based on interactive fuzzy satisfying method is proposed to handle both of the objective functions. Therefore, by the use of the fuzzy set theory, the below equation is employed:
Step 6: Choose the best bat in the population as
best
g
Step 7: Update the bat population as described in Sec-tion 5.1.
X .
Step 8: Apply the proposed modification as described in Section 5.2. Here again the entire population is up- dated.
mix n max
i1, ,n ref i, f i,
F X
X
Step 9: Check the termination criterion. The termina- tion criterion can be the maximum number of iterations to update the BA population or a specific value which the objective function should reach to. If it is satisfied then finish the algorithm otherwise return to step 6.
(19)
In the above equation, f i,
X is the fuzzy mem-bership function (trapezoidal membership function) and
,
ref i
7. Simulation Results
is the satisfying degree of the f Xi
. The vari-able n shows the number of objective functions. By the use of the above formulation, the operator can apply his/her preferences and experiences to satisfy each objec- tive function individually.
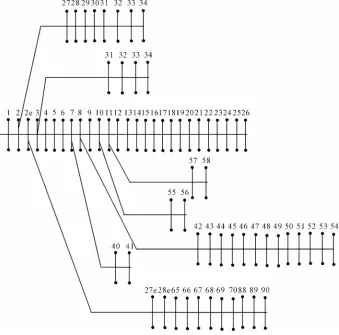
In this section the simulation results of applying the pro- posed method on the test system is shown. The test sys- tem is the IEEE 69-bus radial distribution system which is chosen from a part of PG&E distribution system. The nominal voltage of the system is 12.66 kV. The amounts of total active and reactive loads which are supplied by the system are 3802.19 kW and 2694.59 kVar respec- tively. The single line diagram of the test system is shown in Figure 3. The complete data of the test system
can be found in [17].
6. Application
In order to apply the proposed stochastic method on the DSTATCOM optimal allocation and sizing, the follow- ing steps should be implemented:
Step 1: Define the input data including the network
data, the DSTATCOM data, the algorithm data, etc. dividuals. The termination criterion is supposed 100 it- The initial size of the BA population is chosen 15 in- erations. The reason for this decision is that there is no Step 2: Convert the constrained Multi-objective opti-
2 2
1 1 2
1 1
2 2
2 1 2
1 1
Max 0,
Max 0,
eq
eq
N Nueq
j j
j j
N Nueq
j j
j j
f X L h X L g X
f X L h X L g X
Figure 3. Single line diagram of the test system.
improvement in the objective function values after about 100 iterations. For better comparison, the analysis is im- plemented in both the deterministic and stochastic frameworks. Also, there are four different cases defined which are shown in the table:
Case 1: Initial system condition neglecting DSTAT- COM
Case 2: DSTATCOM allocation and sizing for opti- mizing the total active power losses objective function
Case 3: DSTATCOM allocation and sizing for opti- mizing the maximum voltage deviation objective function
Case 4: DSTATCOM allocation and sizing for opti- mizing both of the total active power losses and voltage
deviation by the proposed interactive fuzzy satisfying technique
In the first step, in order to see the satisfying perform- ance of the proposed modified BA, a complete compari- son is made with the other well-known methods in the area. The simulation results are shown in Table 1.
According to the Table 1, the superiority of the pro-
posed method over the other well-known methods is evident. In order to see the positive effect of considering DSTATCOM in the system clearly, two different operat- ing conditions (OCs) are defined. In the first OC, just 1
DSTATCOM is allocated in the system while in the sec- ond OC two DSTATCOMs are allocated. The maximum capacity of each DSTATCOM is 3 MW. The simulation results for the OC 1 and for all the four Cases in the de- terministic framework (neglecting the uncertainty effects) are shown in Table 2. The word NG in the table means
that negative power loss reduction (increase in the power loss) has happened.
As it can be seen from Table 2, in the Case 2, the
amount of active power losses is reduced effectively. This amount of power loss reduction equals about 33.245 percent of the initial power losses which means notable value.
Also as it is seen, in this case, the voltage profile of the buses is improved as an indirect result of reducing resis- tive losses in the network. In the Case 3, the main target is optimizing the voltage deviation of the buses which has resulted to increasing the minimum voltage of the network. Here the amount of active power loss reduction is reduced to about 19.6460 percent. Finally, in the third case, the proposed interactive fuzzy satisfying method could reach proper tradeoff between the active power losses and the voltage deviation. In fact, as it is seen from
Table 1. Simulation results of optimizing active power losses and voltage deviation objective function for 20 trails (OC 1).
Mean CPU Time Optimizing Voltage Deviation
Optimizing power losses Items
11.358 0.04555011
151.67002 GA
10.102 0.04533289
150.23882 PSO
10.093 0.04500756
150.23882 Original BA
8.876 0.04485347
150.19693 Proposed MBA
Table 2. Results obtained by optimal DSTATCOM allocation and sizing in the deterministic framework (OC 1).
Case 4 Case 3
Case2 Case 1
Items
172.684083 269.204006
150.196936 225.0
Active power losses (kW)
23.2515185 NG
33.245805 ……....
Loss reduction (%)
0.941715813 0.95514652
0.93092967 0.90944095
Vmin (pu)
1 1
1 1
Vmax (pu)
0.05828418 0.04485347
0.06907032 Voltage Deviation (pu)
2.046 3
1.326 …….…
DSTATCOM size (MW)
62 63
61 ……….
DSTATCOM location
optimized both of the objective functions suitably. Therefore, when the maximum bus voltage deviation of the system is improved to the appropriate value of 0.0582841 pu, the amount of power losses is reduced to the optimal value of 172.684 kW. By comparing the op- timal size of the DSTATCOM in different cases, it is deduced that better voltage profile is achieved for higher values of reactive power compensation by the DSTAT- COM but with the cost of incremental losses. This result shows the necessity of accurate sizing and allocating of the DSTATCOM in the system.
Now, the stochastic analysis is utilized. In this analysis, the normal distribution system is supposed for all the active and reactive loads to model their uncertainty. The standard deviation of the probability density functions is assumed to be 0.05. Table 3 shows the results of multi-
objective optimization in both the deterministic and sto- chastic frameworks.
As it can be seen, considering the uncertainty in the analysis has resulted to incremental values in the objec- tive functions. However, the standard deviation values of the objective functions in the stochastic framework are reduced. The less standard deviation values show more dependable optimal values near the real operating points.
Figure 4 shows the voltage profile enhancement be-
fore and after using 1 DSTATCOM in the system (case of multi-objective optimization).
According to the Figure 4, the role of using 1 DSTAT-
COM to enhance the power quality of the system is evi- dent.
Now it is time to run the second scenario called OC 2.
Figure 4. The voltage profile before and after using DSTAT- COM in OC 1 (CASE 4 in the stochastic framework).
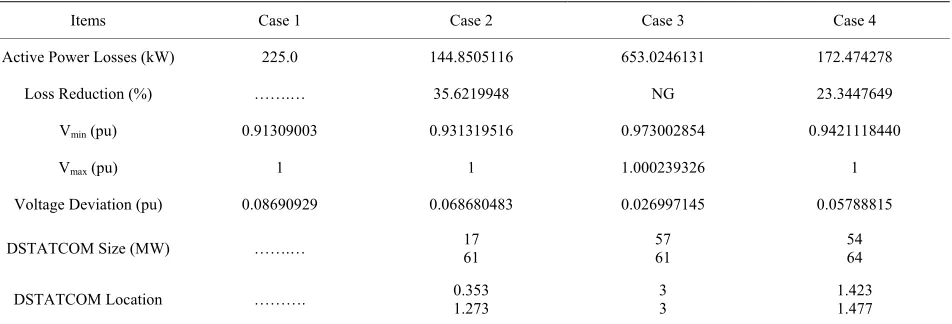
In this scenario, 2 DSTATCOM are allowed to be used in the system. The main target is to see the effect of using 1 more DSTATCOM on the optimal operating point of the network. The simulation results are shown in Table 4.
As it can be seen from Table 4, the existence of
DSTATCOM in the system has improved the all the ob- jective functions suitably. Nevertheless, by comparing the results of Table 2 with Table 4, it is seen that the
Table 3. Results obtained by optimal DSTATCOM allocation and sizing in the stochastic framework (OC 1).
Voltage Deviation Power Losses
Item Items
0.05828418 172.684083
Objective Function
0.001266 4.54322
Standard Deviation Deterministic Framework
0.06028894 173.948302
Objective Function
0.001123 3.98729
[image:8.595.58.537.101.195.2]Standard Deviation Stochastic Framework
Table 4. Results obtained by Optimal DSTATCOM allocation and sizing in the deterministic framework (OC 2).
Case 4 Case 3
Case 2 Case 1
Items
172.474278 653.0246131
144.8505116 225.0
Active Power Losses (kW)
23.3447649 NG
35.6219948 …….…
Loss Reduction (%)
0.9421118440 0.973002854
0.931319516 0.91309003
Vmin (pu)
1 1.000239326
1 1
Vmax (pu)
0.05788815 0.026997145
0.068680483 0.08690929
Voltage Deviation (pu)
54 64 57
61 17
61 …….…
DSTATCOM Size (MW)
1.423 1.477 3
3 0.353
1.273 ……….
DSTATCOM Location
Table 5. Results obtained by optimal DSTATCOM allocation and sizing in the stochastic framework (OC 2).
Voltage Deviation Power Losses
Item Items
0.0269971 144.8505116
Objective Function
0.000539 4.00128
Standard Deviation Deterministic Framework
0.06028894 173.948302
Objective Function
0.000421 3.78351
Standard Deviation Stochastic Framework
and voltage deviation effectively, the second DSTAT- COM has just negligible effect to further improvement of these objective functions. Therefore, according to the expensive value of each DSTATCOM in the system, this amount of improvement in the objective functions is not economical and using the second DSTATCOM is not sensible. The simulation results of the stochastic frame- work are shown in Table 5.
As it is seen here again, the proposed stochastic method has improved the dependability of the final solu- tions by reducing the standard deviation values. Finally in Figure 5, the voltage profile before and after using the
OC 2 is shown comparatively.
8. Conclusion
This paper investigated the optimal placement and sizing of the DSTATCOM device in the distribution systems. In this regard, a new stochastic optimization framework
[image:8.595.62.538.223.385.2] [image:8.595.284.532.414.698.2]based on the 2 m PEM and Modified BA was also pro- posed to solve the problem. The two significant objective functions including active power losses and the voltage deviation are handled using the idea of interactive fuzzy satisfying method. The simulation results showed that using the DSTATCOM as a well-known Facts device can improve the system condition effectively. Nevertheless, there is no direct relationship which states that increasing the number of DSTATCOM in the system can improve the objective functions. In fact, as it was seen from the simulation results, in the 69-bus IEEE test system, the amount of growth in the objective functions values for just 1 DSTATCOM is more than that of using 2 DSTAT- COM. From the uncertainty point of view, the proposed stochastic framework could increase the dependability of the optimal solutions by reducing the standard deviation values.
REFERENCES
[1] A. Kavousi-Fard and M. R. Akbari-Zadeh, “Reliability Enhancement Using Optimal Feeder Reconfiguration,”
Neurocomputing, Vol. 106, No. 1, 2013, pp. 1-11. doi:10.1016/j.neucom.2012.08.033
[2] A. Kavousifard and H. Samet, “Consideration Effect of Uncertainty in Power System Reliability Indices Using Radial Basis Function Network and Fuzzy Logic Theory,”
Neurocomputing, Vol. 74, No. 17, 2011, pp. 3420- 3427. doi:10.1016/j.neucom.2011.05.017
[3] C. Sumpavakup and T. Kulworawanichpong, “Distribu- tion Voltage Regulation under Three-Phase Fault by Us- ing D-STATCOM,” World Academy of Science, Engi- neering and Technology, Vol. 47, No. 1, 2008, pp. 238- 242.
[4] Z. Yang, C Shen, M. L. Crow and L. Zhang, “An Im-proved STATCOM Model for Power Flow Analysis,”
Power Engineering Society Summer Meeting, Vol. 2, Se-attle, 16-20 July 2000, pp. 1121-1126.
[5] G. Ledwich and A. A. Ghosh, “Flexible DSTATCOM Operating in Voltage or Current Control Mode,” IEE Pro- ceedings-Generation Transmission and Distribution, Vol. 149, No. 2, 2002, pp. 215-224.
[6] I. Wasiak, R. Mienski, R. Pawelek and P. Gburczyk, “Ap- plication of DSTATCOM Compensators for Mitigation of Power Quality Disturbances in Low Voltage Grid with Distributed Generation,” 9th International Conference on Electrical Power Quality and Utilizations, Barcelona, 9- 11 October 2007, pp. 1-6.
[7] T. Niknam, A. Kavousifard, S. Tabatabaei and J. Aghae, “Optimal Operation Management of Fuel Cell/Wind/Pho-
tovoltaic Power Sources Connected to Distribution Net- works,” Journal of Power Sources, Vol. 196, No. 20, 2011, pp. 8881-8896. doi:10.1016/j.jpowsour.2011.05.081 [8] L. L. Lai and J. T. Ma, “Application of Evolutionary
Pro-gramming to Reactive Power Planning-Comparison with Nonlinear Programming Approach,” IEEE Transactions on Power Systems, Vol. 12, No. 1, 1997, pp. 198-206. doi:10.1109/59.574940
[9] T. Niknam and A. Kavousifard, “Impact of Thermal Re- covery and Hydrogen Production of Fuel Cell Power Plants on Distribution Feeder Reconfiguration,” IET Generation Transmission & Distribution, Vol. 6, No. 9, 2012, pp. 831-843. doi:10.1049/iet-gtd.2011.0775 [10] Z. Xu, Z. Y. Dong and K. P. Wong, “Genetic Algorithm-
Based Spinning Reserve Dispatching in a Competitive Electricity Market,” International Journal of Systems Sci- ence, Vol. 35, No. 13-14, 2004, pp. 847-853.
doi:10.1080/00207720412331303688
[11] T. Niknam, A. Kavousifard and J. Aghaei, “Scenario- Based Multiobjective Distribution Feeder Reconfigura- tion Considering Wind Power Using Adaptive Modified Particle Swarm Optimization,” IET Generation Trans- mission & Distribution, Vol. 6, No. 4, 2012, pp. 236-247. doi:10.1049/iet-rpg.2011.0256
[12] D. Debaprya, “A Fuzzy Multi-Objective Approach for Network Reconfiguration of Distribution Systems,” IEEE Transactions on Power Delivery, Vol. 21, No. 1, 2006, pp. 202-209. doi:10.1109/TPWRD.2005.852335
[13] T. Niknam, A. K. Fard and A. Seifi, “Distribution Feeder Reconfiguration Considering Fuel Cell/Wind/Photovol- taic power Plants,” Journal of Renewable and Sustainable Energy, Vol. 37, No. 1, 2012, pp. 213-225.
doi:10.1016/j.renene.2011.06.017
[14] S. Jazebi, S. H. Hosseinian and B. Vahidi, “DSTATCOM Allocation in Distribution Networks Considering Recon- figuration Using Differential Evolution Algorithm,” En- ergy Conversion and Management, Vol. 52, No. 7, 2011, pp. 2777-2783. doi:10.1016/j.enconman.2011.01.006 [15] T. Niknam, A. K. Fard and A. Baziar, “Multi-Objective
Stochastic Distribution Feeder Reconfiguration Problem Considering Hydrogen and Thermal Energy Production by Fuel Cell Power Plants,” Energy, Vol. 4, No. 1, 2012, pp. 563-573. doi:10.1016/j.energy.2012.02.023
[16] A. Baziar, A. Kavoosi-Fard and J. Zare, “A Novel Self Adaptive Modification Approach Based on Bat Algo- rithm for Optimal Management of Renewable MG,” Jour- nal of Intelligent Learning Systems and Applications, Vol. 5, 2013, pp. 11-18. doi:10.4236/jilsa.2013.51002