System of Indicators of Eurasian
Integration II
Vinokurov, Evgeny
EDB Centre for Integration Studies
2014
Online at
https://mpra.ub.uni-muenchen.de/61853/
SyStem of IndIcatorS
of euraSIan
IntegratIon II
analytical summary
centre for Integration Studies
Saint Petersburg
General conclusions . . . . 4
market integration . . . . 7
economic convergence . . . . 16
4
sysTem of inDicaTors of eurasian inTeGraTion ii
Analytical summary
this report is a continuation of the permanent project “System of Indicators of eur-asian Integration” (SIeI).1 the project is implemented by the eurasian development Bank’s (edB) center for Integration Studies. It is aimed at contributing quantitative analysis of short, medium and long-term regional integration trends. this study con-cerns the monitoring and system of evaluation of the dynamics and vectors of Eur‑
asian integration. the project is based on official statistics data for 1999–2012. the
edB’s SIeI is recognized globally as one of the three best systems for the detailed analy-sis of regional integration. apart from an academic instrument, it may also be used as an applied instrument in politics. this may interest regional integration organizations and state authorities. one of the main project features lies in the simplicity of the indicators,
as thecalculation of integration indices is based on the data of national and international statistical services. the integration analysis also covers numerous fields of countries’
cooperation from macroeconomic policy to academic mobility.
the first edition of SIeI was published in 2009 and included analysis of the dynam-ics of integration processes for 1999–2008. the current edition is a continuation of the 2009 project and represents analysis of a long-term integration trend in countries and groups of countries of the post-Soviet space for the entire period from 1999 to 2012. dur-ing the analysis of a number of indicators individual attention is also paid to the short-term dynamics from 2009 to 2012.
as part of the SIeI, integration between pairs of countries of the post-Soviet space is evaluated. moreover, it examines the issue of the degree of integration of each country
with groups of countries such as CIS‑12, EurAsEC‑5, SES‑3 and CA‑4. the level and
dynamics of integration inside these sub-regions is evaluated.
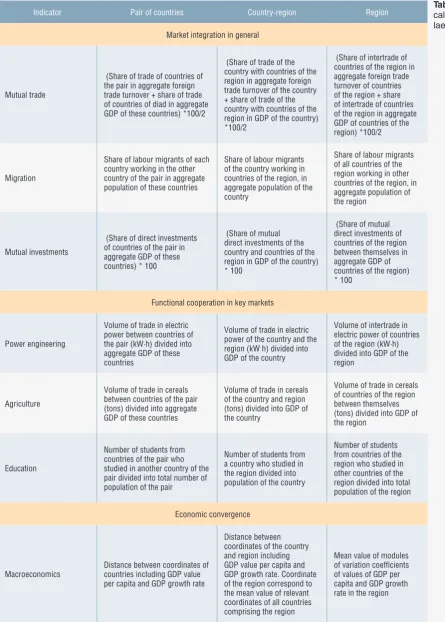
the system of indicators comprises two blocks of indices corresponding to the main as-pects of regional cooperation: market integration (six indices) and convergence of eco‑
nomic systems (four indices). It also calculates the generalized indices that enable the
evaluation of regional integration processes in the post-Soviet space (see table 1).
General conclusions
analysis of the dynamics of SIeI indices for 2009–2012, and for 1999–2012, enables the following conclusions to be made:
1. Integration in the post-Soviet space is developed differently in the various areas where the countries’ cooperate. according to official statistics of the cIS countries and geor-gia, in 2009 - 2012 there was a trend to the reduction of integration in the area of legal
labour migration, and an increase in inter‑country cooperation in education. the
sit-uation in mutual trade, and trade in electric power and agricultural products has sta‑
bilized after the 2000–2008 recession; and for 2009–2012 has not changed drastically.
2. 2009–2012 was characterized by the divergence of the macroeconomic parameters
of countries of the post-Soviet space. there was an increase in the spread of values
1
Indicator Pair of countries Country-region Region
Market integration in general
Mutual trade
(Share of trade of countries of the pair in aggregate foreign trade turnover + share of trade of countries of diad in aggregate GDP of these countries) *100/2
(Share of trade of the country with countries of the region in aggregate foreign trade turnover of the country + share of trade of the country with countries of the region in GDP of the country) *100/2
(Share of intertrade of countries of the region in aggregate foreign trade turnover of countries of the region + share of intertrade of countries of the region in aggregate GDP of countries of the region) *100/2
Migration
Share of labour migrants of each country working in the other country of the pair in aggregate population of these countries
Share of labour migrants of the country working in countries of the region, in aggregate population of the country
Share of labour migrants of all countries of the region working in other countries of the region, in aggregate population of the region
Mutual investments
(Share of direct investments of countries of the pair in aggregate GDP of these countries) * 100
(Share of mutual direct investments of the country and countries of the region in GDP of the country) * 100
(Share of mutual direct investments of countries of the region between themselves in aggregate GDP of countries of the region) * 100
Functional cooperation in key markets
Power engineering
Volume of trade in electric power between countries of the pair (kW·h) divided into aggregate GDP of these countries
Volume of trade in electric power of the country and the region (kW h) divided into GDP of the country
Volume of intertrade in electric power of countries of the region (kW·h) divided into GDP of the region
Agriculture
Volume of trade in cereals between countries of the pair (tons) divided into aggregate GDP of these countries
Volume of trade in cereals of the country and region (tons) divided into GDP of the country
Volume of trade in cereals of countries of the region between themselves (tons) divided into GDP of the region
Education
Number of students from countries of the pair who studied in another country of the pair divided into total number of population of the pair
Number of students from a country who studied in the region divided into population of the country
Number of students from countries of the region who studied in other countries of the region divided into total population of the region
Economic convergence
Macroeconomics
Distance between coordinates of countries including GDP value per capita and GDP growth rate
Distance between coordinates of the country and region including GDP value per capita and GDP growth rate. Coordinate of the region correspond to the mean value of relevant coordinates of all countries comprising the region
[image:5.581.39.485.93.716.2]Mean value of modules of variation coefficients of values of GDP per capita and GDP growth rate in the region
6
sysTem of inDicaTors of eurasian inTeGraTion ii
Indicator Pair of countries Country-region Region
Monetary policy
Distance between coordinates of countries including the growth rate of the rate of national currency to USD and average annual inflation level
Distance between coordinates of the country and region, including the growth rate of the rate of national currency to USD and average annual inflation level. Coordinates of the region correspond to the mean value of relevant coordinates of all countries comprising the region
Mean value of modules of variation coefficients of the growth rate of the exchange rate of national currency to USD and average annual inflation level in the region
Financial policy
Distance between coordinates of countries, including the average deposit rate and average loan rate
Distance between coordinates of the country and region, including the average deposit rate and average loan rate. Coordinates of the region correspond to the mean value of relevant coordinates of countries comprising the region
Mean value of modules of variation coefficients of the average deposit rate and average loan rate in the region
Fiscal policy
Distance between coordinates of countries, including the share of expenses of consolidated budget in GDP, share of foreign debt in GDP, share of consolidated budget balance in GDP and Frank’s index
Distance between coordinates of the country and region, including the share of expenses of consolidated budget in GDP, share of consolidated budget balance in GDP and Frank’s index. Coordinates of the region correspond to the mean value of relevant coordinates of all countries comprising the region
Mean value of modules of variation coefficients of the share of expenses of consolidated budget in GDP, share of foreign debt in GDP, share of consolidated budget balance in GDP and Frank’s index in the region
Generalized indices
Generalized integration index
Mean value of economic convergence indices * (-1) and indices of market integration of the country and region (except for the index of mutual investments)
Mean value of economic convergence indices * (-1) and indices of market integration inside a region (except for the index of mutual investments)
of indicators of economic policy of countries. a reduction of convergence levels in monetary, financial and fiscal policies was observed.
3. The leaders of integration with the CIS‑12 region continue to be small countries,
whichhave close relationships with neighboring states and do not have entry to glob-al markets. In 2012 Kyrgyzstan and Armenia were leaders of integration in the cIS.
4. During 2009–2012 the degree of integration of Georgia, Azerbaijan and Ukraine
with the CIS was increased.
5. Russia still holds the last place for integration with the CIS. the main direction
of its interests is still outside the region. compared with the previous period, the in-tegration of russia with its neighbors was further reduced.
Market integration
for 1999–2012 the results of integration cooperation in the post-Soviet space are as follows: the degree of interrelation of the CIS‑12 region in the area of labour migra‑ tion was reduced to the 2006 level, which was after a sharp growth that started in 2005 and reached its peak in 2008; academic mobility continued to grow progres‑ sively; levels of CIS‑12 integration in mutual trade, trade in cereals and in electric power stabilized after the 2000–2008 fall.
the results of the study did not show countries or groups of countries that unambigu-ously lead in terms of all market integration aspects. the diversity of leaders in the vari-ous fields of cooperation shows the diversity of interests and resources of the countries.
Belarus, Kyrgyzstan, Tajikistan and Turkmenistanbecame leaders in various aspects
of integration with CIS‑12 region. this shows the large interest that central asian
countries have in integration processes on the territory of the cIS. However, it is partly explained by the relatively small gdP volume and population size of these countries.
Georgia, Kyrgyzstan, Tajikistan and Ukraine are leaders in terms of the absolute in‑ crement of integration indices with CIS‑12.
main volumes of trade flows in the post-Soviet space are focused between major coun-tries: russia, Belarus and ukraine. the maximum trade integration level in 2012 was observed in pairs ukraine-Belarus, russia-Belarus and ukraine-russia. Belarus is the
Indicator Pairs-leaders (index level)
Pairs-leaders (index increment)
Leaders of integration with CIS-12 (index level)
Leaders of integration with CIS-12 (index increment)
Trade (1999–
2012) Belarus-Ukraine Belarus-Ukraine Belarus Kyrgyzstan
Labour migration
(2000–2011) Russia-Uzbekistan Russia-Uzbekistan Tajikistan Tajikistan
Power engineering
(2002–2012) Belarus-Ukraine Belarus-Ukraine Kyrgyzstan Ukraine
Agriculture (2002–2012)
Azerbaijan-Kazakhstan Georgia-Kazakhstan Tajikistan Georgia
Education (2000–2011)
Belarus-Turkmenistan
Belarus-Turkmenistan Turkmenistan Turkmenistan
source: eDb calculations based on the data of: eec and cu commission, state statistical authorities of cis countries, asian Develop-ment bank, cis interstate statistical committee, and un comtrade . labour migration and education was last examined in 2011, and the other indicators in 2012 .
8 sy
s
Tem of inDic
a
T
or
s of eura
sian inTe
Gra
Tion ii
38
38.2
>10
2.2 1
2.3
>1 <1
1.1
0.9
1.2
0.7 0.7
0.7 0.8
1 0.8
1.9 1.3
1
3 4.7 7.6
0.8 22.4
Total trade turnover pairs of countries, bln dollars. (The most significant flows are shown)
46
28
Russia
21 25
Ukraine
19 22
Belarus
10
16
Kazakhstan
4
9
Others Export Import Share of countries in intra-regional trade turnover, 2012 (%)
0.7 Russian Federation
Belarus
Moldova Ukraine
Georgia
Armenia
Azerbaijan
Turkmenistan
Uzbekistan
Kazakhstan
Tajikistan
Kyrgyzstan
mutual trade, 2012
leader of trade integration with cIS-12, eurasec-5 and eec-3 regions. Kyrgyzstan is ranked second in terms of these indicators. Kyrgyzstan also sees the maximum level of in-tegration in mutual trade with ca-4 region.
From 2009 to 2012 the level of trade cooperation stabilized.Probably, the constant
disintegration trend, which had been observed for two decades, has ended. further
observations will confirm or disprove this conclusion. the analysis of dynamics of intra-regional indices shows that for 2009–2012 the level of integration in cIS-12, eurasec-5, SeS-3 and ca-4 remained at nearly the same level. But qualitatively the situation in trade integration has not been overcome.
the highest increment of trade integration indices for 2009–2012 is observed in the pair ukraine-Belarus, and the biggest reduction is in the pair ukraine-turkmenistan. Belarus had the largest increase of integration with cIS-12, eurasec-5 and SeS-3, and mol-dova had the largest reduction. for the remaining countries values of integration indica-tors with these regions have not changed significantly. the leader in terms of increment of integration with ca-4 is Kyrgyzstan, and the leader in terms of integration reduc-tion is moldova.
In the area of labour migration the main flows of workers occur between russia and oth-er countries, primarily with central asia. The pair Russia‑Uzbekistan account for the maximum level of integration in labour migration in 2011, the second place is taken
by the pair Russia‑Tajikistan, the third by Russia‑Ukraine. tajikistan has the largest
degree of integration with cIS-12 region, and also with eurasec-5 and SeS-3, which is also conditioned upon a big flow of migrants from tajikistan into russia. tajikistan is followed by uzbekistan and moldova. Kyrgyzstan has the largest level of integration with ca-4.
for 2009–2011 the formal index of labour migration with cIS-12, eurasec-5 and SeS-3 regions was reduced for all countries by over 50% on average. this was mainly by the reduction of the number of legal workers arriving in russia registered by the federal migration Service. However, it does not mean a reduction of the overall labour
CIS-12
EurAsEC-5
SES-3 CA-4
1999 2000 2001 2002 2003 2004 2005 2006 2007 2008 2009 2010 2011 2012 0
5 10 15 20 25
[image:9.581.43.476.89.298.2]source: eDb calculations based on the data of un comtrade, interstate statistical committee of the cis, state statistical authorities of the cis and ministries of finance of cis countries .
10
sysTem of inDicaTors of eurasian inTeGraTion ii
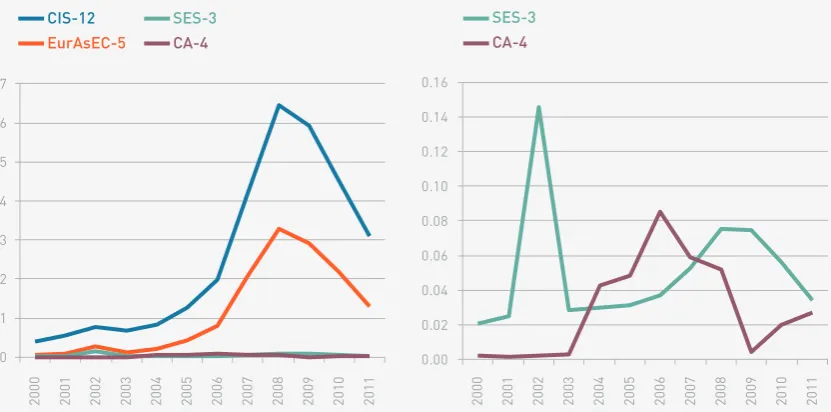
migration to the country as at the same time, according to expert appraisals, the volume of illegal migration into russia is being increased. Intra‑regional integration indices for CIS‑12, EurAsEC‑5 and SES‑3 were progressively reduced for the same reason in
2009–2012 whereas the index for ca-4 was increased (see figure 2). In general for
2000–2011, there was a rise in the level of integration in the area of labour migra‑
tion both between pairs of countries, in particular for the pairs uzbekistan-russia and
tajikistan-russia, and between countries and regions. there was a high rise in the level of labour migration from tajikistan, uzbekistan and Kyrgyzstan into the cIS-12.
trade in electrical power occurs between a relatively small number of cIS-12 coun-tries. this is due to their geographic remoteness from each other. russia is the main electrical power supplier in absolute terms, and Belarus is the main recipient. The pair
Belarus‑Ukraine has the biggest integration index in this area due to ukraine selling
a large power volume to Belarus. they are followed by the pairs armenia-georgia and Kazakhstan-Kyrgyzstan. trade between Kazakhstan and russia is ranked third in abso-lute terms, but it is small compared with the gdP of these countries. In 2002–2008 the leader in terms of mutual trade in electrical power in the cIS was the pair tajikistan-uzbekistan; however, since 2009 there are no data on power trade between countries. Presumably the rupture of the central asian power circle (IPS-ca) in 2009 had a nega-tive impact on international electrical power trade in central asia.
2009–2012 is characterized by a significant growth of the power trade index of many countries with cIS-12 — in particular moldova, armenia and Belarus. the only sig-nificant index reduction is for tajikistan due to reduced trade between tajikistan and Kazakhstan. all intra-regional integration coefficients varied a lot during 2009–2012, but there was practically no change in the average. 2002–2012 is characterized by a significant reduction of integration indices of electrical power trade for all pairs of
countries and regions with subsequent stabilization in 2009–2012. the reason for
such a drop is both a reduction of trade between central asian countries and outrunning growth of economies of the countries. the reform of the electricity sector in russia did not result in a qualitative growth of cross-border power flows.
CIS-12
EurAsEC-5
SES-3
CA-4
SES-3
CA-4
2000 2001 2002 2003 2004 2005 2006 2007 2008 2009 2010 2011 2000 2001 2002 2003 2004 2005 2006 2007 2008 2009 2010 2011
0 1 2 3 4 5 6 7
0.00 0.02 0.04 0.06 0.08 0.10 0.12 0.14 0.16
[image:10.581.122.538.92.298.2]Source: EDB calculations based on the data of the Interstate Statistical Committee of the CIS Figure 2: Dynamics
11
anal
yTic
al summar
y
1980
3227
>1000
2445
1310
582
755 360
>100 689
50
20 29
49 178 87
<100
235
Volume, mln kW·h
(The most significant flows are shown) Moldova
Ukraine
Georgia
Armenia
Azerbaijan
Turkmenistan
Uzbekistan
Kazakhstan
Tajikistan
Kyrgyzstan
Trade in electric power in cis-12 countries, 2012 (million k·Wh)
12
sysTem of inDicaTors of eurasian inTeGraTion ii
In agriculture mutual trade in cereals is the integration indicator. Kazakhstan is the
main cereals seller in the CIS; and azerbaijan and tajikistan coupled with it have
maxi-mum pair integration indices in this area. russia, although it is the second largest cere-als seller, has a small index value due to its relatively large gdP. the trade index with cIS-12, eurasec-5 and SeS-3 countries is the maximum in tajikistan and Kyrgyzstan because they purchase a large volume of cereals from Kazakhstan, and their low gdP. It is also high in georgia.
In general for 2009–2012 a significant growth of indices was observed only in cen-tral asian countries. Integration with cIS-12, eurasec-5, SeS-3 and ca-4 countries was increased most in tajikistan, followed by uzbekistan and georgia. In almost all other countries a minor reduction of the integration level was observed. Intra‑regional indi‑ ces were reduced during 2002–2008. They stabilized in 2009–2011 (except CIS‑12),
and even rose slightly in 2012. tajikistan was the leader in terms of the reduction of
in-tegration index with regions during 2002–2012.
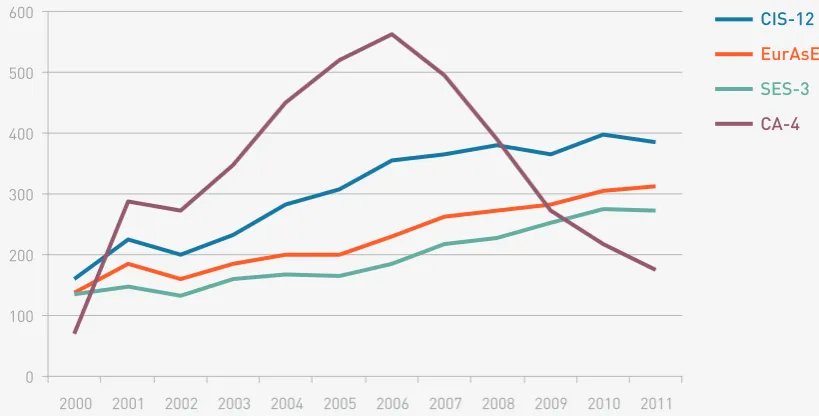
In the area of academic mobility the main recipient of foreign students in CIS‑12 coun‑
tries is Russia, with most students come from the main “donors” of the region —
Kazakh-stan and Belarus. the third most important “donor” of students is turkmeniKazakh-stan, with over 20,000 students going to study in russia, Belarus and ukraine according to 2011 data. the academic mobility index is the maximum for the pair turkmenistan-Belarus due to the small population of both countries, and 5,000 turkmen students which is a large num-ber in relative terms. turkmenistan also has the maximum integration index in education with cIS-12, eurasec-5 and SeS-3 followed by Belarus and Kazakhstan. russia has the lowest integration index with the regions because it has a larger population.
In general, during 2000–2011 all pair and intra-regional (except for ca-4) integra-tion indices rose progressively. as a result, the growth of interregional indices was 100 to 140%. There has beenan integration increase in the area of academic mobility on the
territory of the post‑Soviet space.
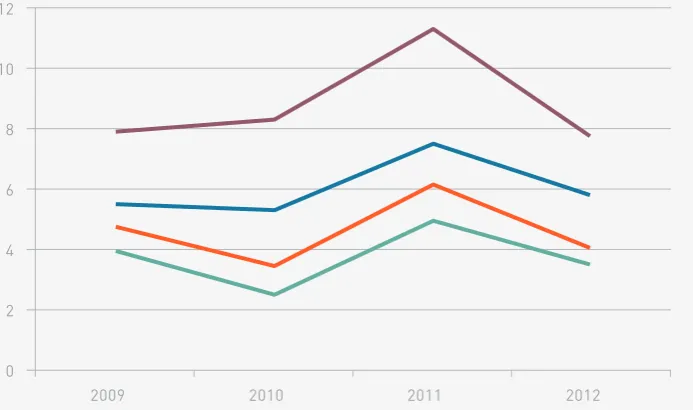
the main investment movement occurs between several large countries of the cIS-12
CIS-12 EurAsEC-5 SES-3 CA-4
0
2 4 6 8 10 12
2009 2010 2011 2012
[image:12.581.123.470.95.300.2]source: eDb calculations based on the data of the eurasian economic commission and the customs union and un comtrade
13
anal
yTic
al summar
y
>100
>500 >10 <10
400
475
370
59
14
33
42
11 76 98
482 412
364
658
779
1074
11
13 11
5 3
33
6 3
9 5 7
5
Volume, kilotons
(The most significant flows are shown) Moldova
Ukraine
Georgia
Armenia
Azerbaijan
Turkmenistan
Uzbekistan
Kazakhstan
Tajikistan
Kyrgyzstan
Trade in cereals between cis coun-tries, 2012
14
sysTem of inDicaTors of eurasian inTeGraTion ii
region. The main “donor” of investments in 2012 was Russia, and the main recipi‑
ent was Ukraine. The pair Azerbaijan‑Georgia is characterized by the largest degree
of integration due to the low gdP of both countries. A high level of investment inte‑
gration may be highlighted in the pairs Ukraine‑Russia, Russia‑Kazakhstan and Rus‑
sia‑Belarus with russia investing substantial funds in the economy of partner-countries.
Leaders of integration with cIS-12 region are armenia, Kyrgyzstan and georgia. the lowest degree of integration with cIS, eurasec-5 and SeS-3 is observed in turkmeni-stan, which is practically not involved in the processes of inter-country capital movement. russia, due to its large gdP, has low values of integration indicators with these three
re-gions. the largest integration degree with ca-4 region is seen in Kyrgyzstan and georgia. azerbaijan and moldova have no investment cooperation with groups of ca-4 countries.
0 2 4 6 8 10 12 14 16 18
2002 2003 2004 2005 2006 2007 2008 2009 2010 2011 2012
CIS-12
EurAsEC-5
SES-3 CA-4
source: eDb calculations based on un comtrade data
Figure 4: Dynam-ics of the cereals trade index in four regions of the post-soviet space in 2002–2012
0
100 200 300 400 500 600
2000 2001 2002 2003 2004 2005 2006 2007 2008 2009 2010 2011
CIS-12
EurAsEC-5
SES-3 CA-4
source: eDb calculations based on the data of the interstate statistical committee of the cis and state statistical authorities of cis coun-tries
[image:14.581.102.537.93.301.2] [image:14.581.112.522.488.696.2]15
anal
yTic
al summar
y
>2
>10 >1 <1
10
1.4
1
0.7 0.5
0.1
3.9
4.4
17
1.3
1.9
1.4
0.4 0.2
0.2
0.4 0.5
Volume, billion USD
(The most significant flows are shown) Moldova
Ukraine
Georgia
Armenia
Azerbaijan
Turkmenistan
Uzbekistan
Kazakhstan
Tajikistan Kyrgyzstan
Direct investments of cis countries and Georgia, 2012 (billion usD)
16
sysTem of inDicaTors of eurasian inTeGraTion ii
Economic convergence
as stated above, values of economic convergence indices imply “distances” between “co-ordinates” of analyzed countries and regions, including the relevant indicators of the eco-nomic policy of countries. Indices are considered negatively — the higher the index value, the less integration level between countries or groups of countries.
In 2009–2012 a divergence of the economies of the post-Soviet space was observed rath-er than their convrath-ergence. In trath-erms of economic growth, thrath-ere has been almost no recent change in the level of convergence. In spite of this fact groups of post‑soviet countries
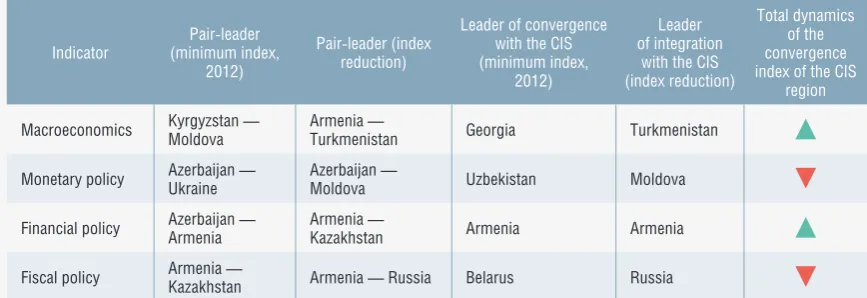
mainly saw a reduction of integration in monetary, financial and fiscal policies. table
3 below shows the main results of the analysis for 1999–2012.
In terms of macroeconomic convergence, major changes in the level of integration of
regions were not observed for 2009–2012, despite the global economic crisis. except
for a minor reduction of the level of integration in ca-4 group, convergence indices have been almost unchanged. until 2008 all groups saw a reduction of the level of integra-tion of macroeconomic indicators (increase of indices), with the ca-4 group being the highest and eec-3 group the lowest. thus, levels of integration in 2012 were below corresponding 1999 levels for all groups of countries (values of corresponding indices were higher). the most integrated pair of countries in 2012 was the pair Kyrgyzstan-moldova, and georgia was the leader of convergence with the cIS group. recently the pair armenia-uzbekistan has converged, the leader of convergence with three groups of countries was azerbaijan.
Indicators of the monetary policy for 2009–2012 are indicative of the increase of the level of convergence between all pairs of countries excluding Belarus. Belarus moved away significantly from all other countries, and all regions of the post‑Soviet space,
in the area of monetary policy. This was due to inflation and the drop in the rate of
Be-larusian ruble. In the intra-regional section, unlike macroeconomic convergence, ca-4 group is characterized by a stable level of integration. Whereas for the remaining groups the convergence index increased significantly, this indicates an integration reduction. despite this reduction, compared to 1999, all groups see an increase of integration in
the area of monetary policy.
the financial policy analysis showed that for 2009–2012 the level of integration of
Indicator
Pair-leader (minimum index,
2012)
Pair-leader (index reduction)
Leader of convergence with the CIS (minimum index,
2012)
Leader of integration
with the CIS (index reduction)
Total dynamics of the convergence index of the CIS
region
Macroeconomics Kyrgyzstan — Moldova
Armenia —
Turkmenistan Georgia Turkmenistan
Monetary policy Azerbaijan — Ukraine
Azerbaijan —
Moldova Uzbekistan Moldova
Financial policy Azerbaijan — Armenia
Armenia —
Kazakhstan Armenia Armenia
Fiscal policy Armenia —
Kazakhstan Armenia — Russia Belarus Russia
[image:16.581.110.544.94.243.2]source: eDb calculations based on the data of the eurasian economic commission and the customs union, World bank, ministries of finance of cis countries, state statistical authorities of cis countries, national banks of cis countries, asian Development bank, interstate statistical committee of the cis, un comtrade and ministry of economics and sustainable Development of Georgia
countries of the post‑Soviet space in this area was reduced drastically. It was fixed below the 1999 level for all groups of countries. during 1999–2009 major changes of inte-gration indices in cIS-12 and eurasec-5 were not observed. ca-4 region saw a sharp in-tegration growth in 2001 and 2009, and a drop in 2002–2003. In 2002–2007 eec-3 saw integration growth, with its subsequent sharp drop. for ca-4 group the current level of integration of financial policy is comparable with the low values of 2002–2006. the pair azerbaijan-armenia was the most integrated among all pairs of countries for 2012; and the pair Kyrgyzstan-moldova reached the largest increase of integration for
0
0.1 0.2 0.3 0.4 0.5 0.6 0.7 0.8
1999 2000 2001 2002 2003 2004 2005 2006 2007 2008 2009 2010 2011 2012
CIS-12
EurAsEC-5
SES-3
CA-4
source: eDb calculations based on the data of state statistical authorities of cis countries, asian Development bank, ministry of econom-ics and sustainable Development of Georgia, national bank of Tajikistan
note: index reduction means economic convergence .
Figure 6: Dynam-ics of the index of macroeconomic convergence in four regions of the post-soviet space in 1999–2012
CIS-12 EurAsEC-5 SES-3 CA-4
CIS-12 EurAsEC-5 SES-3 CA-4
0 0.05 0.1 0.15 0.2 0.25 0.3 0.35
2009 2010 2011 2012
0 0.1 0.2 0.3 0.4 0.5 0.6 0.7
1999 2000 2001 2002 2003 2004 2005 2006 2007 2008 2009 2010 2011 2012
source: eDb calculations based on the data of the national banks of cis countries, state statistical authorities of cis countries, asian Development bank and the interstate statistical committee of the cis
note: index reduction means economic convergence .
[image:17.581.39.400.94.298.2] [image:17.581.43.544.470.681.2]18
sysTem of inDicaTors of eurasian inTeGraTion ii
2009–2012. armenia was the most integrated country with the cIS in 2012. In recent years many countries have managed to converge with the examined groups; the maxi-mum convergence was achieved by Kyrgyzstan and moldova.
In the area of fiscal policy, itis difficult to make an unambiguous conclusion about a reduc-tion or increase of integrareduc-tion levels of cIS countries. thecalculation is based on the data on expenses and budget deficit, foreign debt and economic growth level of the countries. during 2009–2012 the level of integration of the cIS group was reduced steadily. this
oc-curred in the midst of an increase of integration of eurasec-5 (diagram for eurasec-5 for the period of 2010-2012 on the figure 9 had been smoothed for the purpose of exclusion of the integration index “splash” in 2011, that appeared due to peculiarities of its calculation), and ca-4 integration that stayed at practically the same level. compared with 2000, the level of integration of cIS group was substantially reduced, and eurasec-5 was slight-ly increased. for the remaining groups the integration level was almost unchanged. arme-nia and Belarus were leaders of convergence with each group of countries during this time.
Generalized integration index
the main objective of the generalized index is to combine various aspects of regional cooperation in one indicator that reflects the degree of integration of each country with a cIS region.
considering the overall level of integration ofeach country with all countries of the
post‑Soviet space, Kyrgyzstan and Armenia were leaders in 2008 and 2012. tajikistan
had the leading position in 2002 and 2008, and it reduced significantly its scope of in-tegration with the cIS in 2012. compared with 2002, moldova and ukraine reduced substantially their integration level in 2008 and 2012. georgia, azerbaijan and ukraine substantially increased the degree of their integration with the cIS in 2009–2012.
CIS-12 EurAsEC-5 SES-3 CA-4
CIS-12 EurAsEC-5 SES-3 CA-4
0
0.1 0.2 0.3 0.4 0.5 0.6 0.7 0.8
2009 2010 2011 2012
0 0.1 0.2 0.3 0.4 0.5 0.6 0.7 0.8
1999 2000 2001 2002 2003 2004 2005 2006 2007 2008 2009 2010 2011 2012
source: eDb calculations based on the data of the World bank, national banks of cis countries note: index reduction means economic convergence .
[image:18.581.122.540.92.300.2]CIS-12 EurAsEC-5 SES-3 CA-4 0 1 2 3 4 5 6 7 8 1 9 9 9 2 0 0 0 2 0 0 1 2 0 0 2 2 0 0 3 2 0 0 4 2 0 0 5 2 0 0 6 2 0 0 7 2 0 0 8 2 0 0 9 2 0 1 0 2 0 1 1 2 0 1 2 Smoothed index EurAsEC-5 integration
source: eDb calculations based on the data of ministries of finance of cis countries, state statistical authorities of cis countries, national banks of cis countries, asian Development bank
note: index reduction means economic convergence . smoothing of the diagram for eurasec-5 had been performed for the purpose of exclusion of the integration index “splash” in 2011, that appeared due to peculiarities of its calculation . non-corrected diagram is shown on figures 3 .17 and 3 .18 in the full russian version of the report .
Figure 9: Dynam-ics of the conver-gence index in the area of fiscal pol-icy in four regions of the post-soviet space in 2009–2012
-1 -0.8 -0.6 -0.4 -0.2 0 0.2 0.4 0.6 0.8 1 Rus sia Belarus Kazakhs tan Ukr aine Moldo va Uzbekis tan T ajikis tan Azerbaijan Geor gia T urkmenis tan Armenia K yr gyzs tan 2002 2008 2012
source: own calculations based on the data of the eurasian economic commission and the customs union, World bank, ministries of finance of cis countries, state statistical authorities of cis countries, national banks of cis countries, asian Development bank, interstate statistical committee of the cis, un comtrade and ministry of economics and sustainable Development of Georgia .
[image:19.581.41.447.90.301.2] [image:19.581.59.413.391.608.2]