ISSN Online: 2164-277X ISSN Print: 2164-2761
Effect of Process Parameter Variation on Purity
during Rotary Fractional Crystallization of
Aluminum
Semiramis Friedrich
*, Danilo Coladetti Curtolo, Bernd Friedrich
IME Process Metallurgy and Metal Recycling, RWTH Aachen University, Aachen, Germany
Abstract
High pure and ultrapure Aluminum is increasingly used in highly corrosion resistant applications or to replace copper in conductive parts such as high voltage cable and transformers due to their higher electrical conductivity properties. Ultrapure Aluminum is also used in semiconductors industry. Hence, the market demands innovative refining technologies, which consume less energy, take less time and lead to higher resource efficiencies. The most common methodology to produce ultrapure Aluminum is zone refining, based on the principle of fractional crystallization. Zone refining is however a very time-consuming process. In order to achieve a purity of 6N, several passes along the crucible with each full day treatment must be carried out. Also this method cannot be conducted continuously. This paper presents first time a new and eco-efficient method, which offers high potential to meet the mentioned multi-dimensional demands. Firstly, distribution coefficients of main impurities in Aluminum—a deciding factor to forecast and assess the removal behavior of impurities-were studied theoretically as a function of temperature using thermo-chemical calculation in FactSageTM. Secondly, the
innovative method using a rotating and gas cooled crystallizer (“cooled fin-ger”) was developed to validate the principle. The influencing process para-meters such as temperature gradient, cooling gas flow rate, etc. were experi-mentally investigated and the theoretical results could be verified.
Keywords
Fractional Crystallization, Aluminum, High Purity, Distribution Coefficient, Temperature Gradient, Cooled Finger, FactSage, Burton-Prim-Slichter Model
1. Introduction
Fractional crystallization principle: fractional crystallization is the crucial pro-
How to cite this paper: Friedrich, S., Cur-tolo, D.C. and Friedrich, B. (2017) Effect of Process Parameter Variation on Purity during Rotary Fractional Crystallization of Aluminum. Open Journal of Metal, 7, 25- 38.
https://doi.org/10.4236/ojmetal.2017.72003
Received: April 3, 2017 Accepted: June 17, 2017 Published: June 20, 2017
Copyright © 2017 by authors and Scientific Research Publishing Inc. This work is licensed under the Creative Commons Attribution International License (CC BY 4.0).
http://creativecommons.org/licenses/by/4.0/
cess for ultra-purity refining of metals and metalloids. Crystallization from the melt has the great advantage of high selectivity in comparison to other pyro- metallurgical melting processes. Thereby, distribution of impurities during the phase transition liquid/solid is used for refining of the initial metal as well as for doping of accompanying elements (e.g. to produce extrinsic semiconductors). An important parameter for impurity distribution in the target metal is the dis-tribution coefficient (see Figure 1), which describes the ability to separate the different components in the melt [1] [2]. To remove unwanted elements from the target metal, the solubility of the impurities in the melt and in the crystal must be different. The distribution coefficient k is generally defined (Formula (1)) as the ratio of the concentration of an element in the solid phase (CS)
di-vided by the concentration in the liquid phase (CL). S
L C k
C
= (1)
k—Distribution coefficient; CS—concentration in solid; CL—concentration in
liquid.
Here, the distribution coefficient of any chemical composition is depending on thermo-dynamical properties of components, kinetics on the interface liquid/ solid, diffusion and convection on the phase boundary [3] [4]. The distribution coefficient can take values smaller or bigger than one. Elements with k-values of <1 decrease the melting point and have a limited solubility in the target metal (Figure 1 upper right). If the distribution value k1 (for example, 0.01), the solubility in the target metal is extremely low, thereby a separation by fractional crystallization principle can be realized very well. If the k-value is greater than one, however, not only the melting temperature of the target metal is increased but also the impurities concentrate itself on the crystallized solid [5] [6].
[image:2.595.216.535.534.691.2]The crystallization is, among other factors, greatly influenced by the under-cooling effect on the growth layer at the liquid-solid interface, which can be represented by the equation 2 below [6] [7] [8].
(
)
0 1
G D k
T m C k
⋅ ≤
∆ ⋅ ∗ − (2)
where ΔT is the temperature gradient in the liquid interface, G is growth rate, m
is the slope of liquidus line in the phase diagram, k is the distribution coefficient [Cs/CL], D is the impurity diffusivity in the melt and C0 is the initial
concentra-tion.
For a better segregation, one should keep the growth rate at low levels, allow-ing this Kinetic-driven process to occur. Process parameter like furnace ature, mixing degree and cooling gas flow rate can indirectly control the temper-ature gradient in the process and as well as the growth rate. Those will eventually be indirectly correlated to the segregation effectiveness of the process. As the growth rate increases to a level higher than the rate of solute rejection, an in-crease in the k-value should be observed.
Innovative methodology “rotational immersing cooled finger”: The process to be studied in this paper is based on an internally cooled crystallization unit (so- called “cooled finger”), which is rotationally immersed into the molten Alumi-num. Although this idea was patented 1982 in Japan (see Figure 2), until today neither scientific detail has been published nor the process been fundamentally investigated [10].
[image:3.595.250.486.525.715.2]This is more remarkable, because all purification methods currently available are distinguished by complex technical systems and low efficiency. For example, while zone refining requires several passes with each taking a full day in order to improve the metal just to one purity-grade (reduction of foreign metals of a fac-tor of 10) higher. According to Figure 2 the rotation is in correlation with a low temperature gradient between the melt and the “cooled finger” and the released crystallization heat causes a controlled metal layer deposition. The goal is a smooth-walled solidification without dendrite formation, in whose interspace melt could be entrapped. Via this concept, it should be possible to increase the purity from an initial 99.99% to at least 99.9995% in only one step [9].
2. Assessment Methodology and Experimental Procedure
The distribution coefficient of four common impurities in Aluminum, i.e. Iron, Silicon, Nickel and Lead have been preliminary modeled via the thermo -chemical software FactSage™, (using the database Ftlite). The data of the solid and liquid lines, gathered from each binary phase diagram Al-X, were converted to a polynomial equation of CX,S = f(T), respectively CX,L = F(T), in which CX is
the concentration of Element X in solidus or liquidus line and T the tempera-ture. Based on these equations, the concentration of each impurity element in liquidus resp. solidus line and at different temperatures were calculated. Using Equation (1) the distribution coefficient of Element X was then calculated as a function of temperature as well.
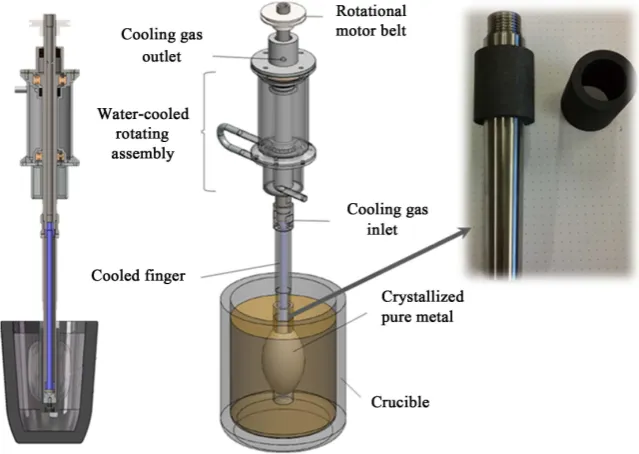
Parallel to the theoretical studies a series of experimental trials were applied to investigate practical feasibility of the concept, namely the temperature gradient, crystallization temperature as well as growth rate. For this procedure an innova-tive setup including a rotational cooled hollow rod made of steel covered with high purity graphite was designed and installed, illustrated in Figure 3. This “cooled finger” has a diameter of 30 mm and active length (the length immers-ing into the molten bath) of 160 mm. Compressed air was selected as the coolimmers-ing medium inserting from top of the system, distributing inside the steel rod and then rejected out without having contact to the liquid Aluminum. The crucible applied in this process also made of graphite has a conical form with an upper internal diameter of 160 mm, lower internal diameter of 100 mm and the length of 200 mm (from which 180 mm is the active length).
[image:4.595.213.533.464.691.2]The cooled finger is able to rotate inside the melt via an electrical motor with variable rpms. This allowed to adjust an appropriate mixing inside the bath and
ensure small diffusion layers. In order to avoid the driving system becoming too hot, this is cooled indirectly with water (see Figure 3, middle). For those expe-riments, in which only the temperature gradient was investigated, the tempera-ture was measured both inside the graphite shell of “cooled finger” as well as in-side the molten bath bein-side the crucible’s wall. In that case, no rotation was be used.
3. Results and Discussion
Before calculating the theoretical or experimental distribution coefficient, the two important terms controlling crystallization, i.e. temperature gradient and crystallization temperature were determined.
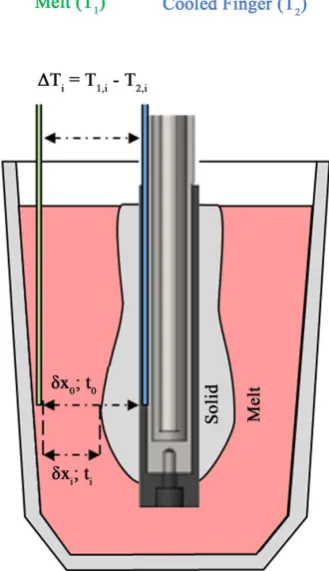
[image:5.595.290.455.393.679.2]Experimentally measured temperature gradient: As illustrated in Figure 4, the crystallized material grows continuously. According to the final thickness of this layer and with knowing the molten bath diameter (crucible diameter), the growth during this crystallization per unit of time can be measured. Therefore, for every moment of time (ti) the distance from the crystallization front to the crucible wall (δxi) can be estimated. In addition, the ever-changing temperature difference between the crystallized front and the melt beside the wall (∆Ti) can be experimentally obtained (see Figure 4), allowing for the temperature gradient to be calculated as a function of time (∆T/δx).
Figure 4. Schematic illustration of Cooled Finger experimental setup, where ti is the every
moment of time, δxi the ever-changing distance between crystallization front and the
crucible wall and ∆Ti the ever-changing temperature difference between the crystallized
We assume in this preliminary study, that the temperature of the crystalliza-tion front is more or less the same as the temperature inside the “cooled finger” (due to the fact of very good heat conductivity of Graphite and Al and particu-larly because it is very difficult to measure the temperature while growing the front). Hence, in this experimental setup, the thermo-elements were placed in-side the graphite shell (T2) and adjacent to the crucible wall (T1) at the same
depth in the molten bath. The temperature profile was then recorded during the trials. Consequently, these trials were conducted without rotation due to the thermocouple wires attached to the equipment.
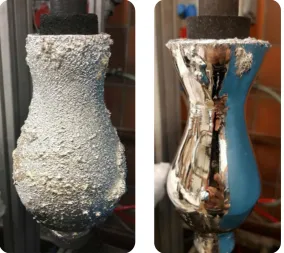
With the two parameters of ∆T and δx the temperature gradient (∆T/δx) will be approximated as well. Figure 5 illustrates the temperature gradient for three different cooling gas flow rates. With a very high cooling gas flow rate (e.g. 70 L/min), higher growth velocity was observed. While for the lowest one (45 L/min), the metal solid crystal could not be grown as a layer over the cooled fin-ger wall, but rather homogeneously distributed within the melt in a mushy form (quite like a rapid solidification case). The absence of growth layer, when using much lower cooling rates, is due to the lack of sufficient thermal gradient be-tween the melt and the cold surface of the Cooled Finger resulting in a de-attached growth of the formed crystals.
By comparison, the trial with e.g. 50 L/min proved to have optimum condi-tions to achieve a stable growth rate as well as induce the solute segregation and enable the adhesion of a solid layer on the “cooled finger” surface (see the col-lected products for each curve in Figure 5).
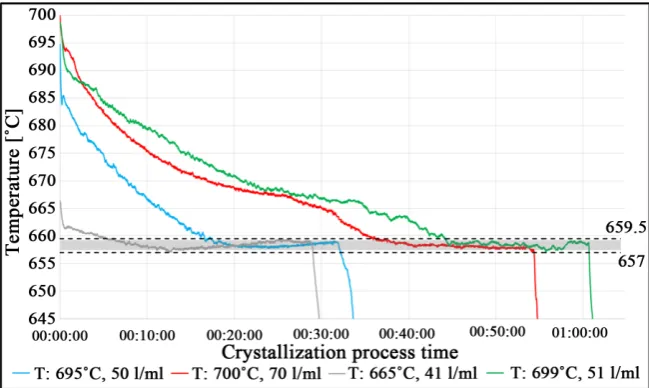
[image:6.595.210.535.499.689.2]Crystallization temperature: Figure 6 shows the temperature profile of the bulk molten metal bath in a period of time. As it is seen, it takes between some minutes to one hour after immersion of “cooled finger” to achieve a stable level of (start-) temperature. When immersed into the melt, the “cooled finger” sys-tem extracts heat by constantly dropping the melt sys-temperature until it reaches
Figure 6. The experimental profile of the crystallization temperature at different initial melt, initial temperature and different cooling gas flow rate without rotation of the “cooled finger”.
the crystallization temperature range, where from this point, latent heat is ex-tracted and through an undercooling effect the growth is induced on the coldest region e.g. “cooled finger” surface.
The duration to achieve this stable level is depending on the cooling effect of the finger, influencing by cooling gas flow rates, cooling surface and finger di-mensions, diameter of the crucible/molten bath, rotation, etc. In these series of experiments, the initial temperature of the molten bath as well as the cooling gas flow rate were taken as the variable parameters. However, in all these different operational situations, the stable temperature (crystallization temp.) remains with ±2˚C the same (see Figure 6, the grey region). This temperature region is between 657˚C - 659.5˚C very shortly below the liquidus temperature.
As the process starts, the temperature of the melt (T1) is constantly dropped
by the inlet gas flow inside the Cooled Finger until it reaches a “plateau” (see the gray area), where the extracted heat from the system induces the crystallization of the melt over the colder surface of the Cooled Finger. From now on, the T1
remains relatively constant until the end of the experiment or until there is no more molten metal to be crystallized. Hence, for any initial conditions or cooling rate, the crystallization temperature will be the same but also depends on the li-quidus temperature of applied metallic system. It should be though mentioned that crystallization rate is influenced by convection and agitation/mixing through rotation mechanism as well.
For the current system (Al), the Green line (starting T1 = 700˚C, cooling gas
flow rate = 50 L/min), demonstrates a better stability to achieve the gray plateau without generating too much cooling effect while keeping a satisfactory growth rate. That all will result a good solute segregation.
about the removal percentages of iron and silicon impurities. The process para-meters of the green line caused about 60% Si- as well as 50% Fe-removal in comparison with only 11% Si- and 28% Fe-removal through the parameters of red line. It should though be noticed–as mentioned before–that the results of this figure were gathered without using any rotation in the “cooled finger”. The effect of rotation (presented in Figure 7) induces a better temperature distribu-tion across the melt, reducing the temperature gradient as well as allowing lower growth rates by mixing the temperature of the surrounding region. Additionally, the resulting melt flow adjacent to the crystallization front will assist in the dis-solution of segregated solute into the bulk melt, promoting a lower concentra-tion gradient and facilitating the fracconcentra-tional crystallizaconcentra-tion to occur in a more ef-fective way. This huge effect of rotating to decrease the diffusion layer can make an expectation of even higher impurities removal efficiencies than that men-tioned above. The Figure 7 represents the significant difference between two tri- als with the identic operational parameters, but one with and one without rota-tion. However, in these series of preliminary experiments, the effect of rotation has not been investigated deeply.
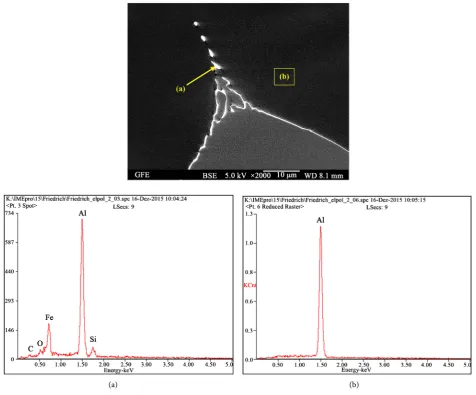
The control of growth rate, either by the cooling gas flow rate itself or in con-junction with rotation, will promote a stable growth front, in which the impuri-ties will be segregated from the base metal towards the liquid phase. In the case of multi-crystalline growth during the process, those impurities, which cannot migrate to the solid/liquid interface and therefore not be expelled to the adjacent liquid phase, will be precipitated on the grain boundary of the crystallized ma-terial. Figure 8 illustrates Fe-and Si-enriched region on the grain boundary
[image:8.595.233.518.448.701.2]
(a) (b)
Figure 8. SEM-(top) and EDX-(middle and bottom) pattern of a sample of crystallized Aluminum containing Si and Fe as main impurities, performed via cooled finger methodology.
(showed in region A) compared to the grain surface (Region B) as a SEM–EDX analyses pattern. The lighter gray region has the same results showed in region B, only with different grain orientation. The existence of carbon and oxygen traces in these patterns could be because of the oxidization of Aluminum while processing as well as external contaminations through graphite crucible.
Calculation of distribution coefficient: The distribution coefficient as a func-tion of temperature was calculated in Fact Sage, using the individual binary phase diagram of each system (Al-X) as well as using the Equation (1). The XS
and XLin the binary phase diagrams developed in Fact Sage were defined as a
polynomial function of temperature as X aT= 3+bT2+cT d+ with a
R2~0.99999. Using the individual constant factors for each equation at a specific
temperature, XS and XL were calculated for values of temperature until the eutec-
tic point. Using Equation (1) the distribution coefficient is calculated as S L X k
X
=
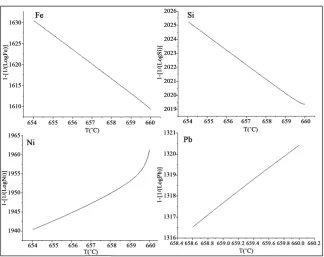
Figure 9. Distribution coefficient of the most common Aluminum impurities versus temperature in the case of a complete mixing, calculated through FactSage.
in the liquid is assumed (ideal system). Here the different tendencies of distribu-tion coefficient in dependence of temperature for different impurities have been illustrated. This figure shows that in contrast to iron, silicon, whose coefficients decrease due to the temperature rising, some impurities such as lead and nickel show an increasing pace with temperature. That means finding an appropriate crystallization temperature to remove all these impurities simultaneously would be a challenge. Though, according to Figure 8, these values still remain << 1, and even lower that of the iron, silicon and zinc at the same temperature.
Experimental-based distribution coefficient and comparison with Fact-Sage-calculation: Generally for a non-ideal system with partial mixing in the liq-uid, the effective distribution coefficient based on BPS (Burton-Prim-Slichter) should be considered (see Equation (3)) [11] [12].
(
)
0
0 0 0
1 1
ln 1 ln 1
1 e
S
eff G
L D eff
C k G
k
C k k D
k k δ
δ
= = → − = − −
+ −
(3)
In which CS and CLare the experimental values for the impurity concentration
in solid as well as in liquid (e.g. here chemically analyzed through spark spec-trometric method), k0 is the equilibrium distribution coefficient, G the
growth/solidification rate of the crystallization front, D the diffusion coefficient of each impurity in Al and
δ
is the diffusion layer thickness.Using the experimental results and the chemical analysis of the products, keff
can be calculated as on cold finger crucible residue eff
C k
C
= . That means, CS is in this case the con-
concen-tration of the same impurity remained in the molten phase (crucible residue). On the other hand, the solidification velocity (G) for different trials can be cal-culated through measuring the thickness of the crystallized material over the known period of dwelling time (as micron/sec). With the help of these two known variables (keff and G), the trend line of y Ax B= + can be drown, where y is the keff, x is the G, A (slope) is −δ D and B (intercept) is ln 1
(
k0′ −1)
.From this trend line, the k0′-the empirical values of distribution coefficient-can
be evaluated for each impurity and compared to the theoretical value from Fact-Sage.
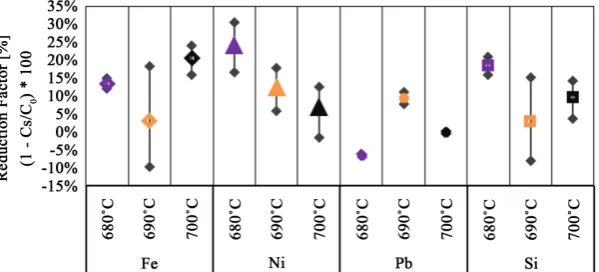
The solidified material of these “proof of principle experiments” was analyzed chemically via spark spectrometry measurement device, whose results have been illustrated in Figure 10. In this diagram the concentrations of the most impor-tant impurities (Fe, Si, Pb and Ni) before and after the crystallization process using “cooled finger” have been compared by so called reduction factor at three temperature intervals. Reduction factor is defined as the ratio of concentration on the “cooled finger” to the initial one, subtracted from 100%. The bigger this factor, the more metallic impurity was removed.
Figure 10 shows that at a starting temperature of 680˚C, Nickel could be re-moved about 25%, the highest reduction factor in this diagram. This factor is then reduced by increasing the starting temperature. The expected tendency (according to Figure 9) can be only seen in the case of Nickel, because Nickel’s distribution coefficient is increasing with the temperature and that means that its removal should be impaired at higher temperature. According to Figure 9, Lead has the same effect as nickel. Their reduction factors, though, do not show the expected increasing tendency.
Application of the Burton-Prim-Slichter model (BPS): Figure 11 represents the implementation of the experimental values of CS and CL(via chemical
analy-sis) as well as the empirical keff into the BPS model to calculate the experimental
0
k′. The preliminary results obtained showed a correlation of the δ D
coeffi-cient in relation to impurities that has similar distribution coefficoeffi-cients. While the
0
[image:11.595.227.527.569.705.2]k for iron and Silicon are 0.03 and 0.13 respectively, the obtained coefficients and k0′ were also close to each other. Same effect can be observed for the Ni
0.0238
D
δ = ; k0′ =0.65 δ D=0.0278; k0′ =0.64
0.0434
D
[image:12.595.64.535.71.380.2]δ = ; k0′ =0.53 δ D=0.0427; k0′ =0.85
Figure 11. Implementation of the experimental values of CS and CL into the BPS model for Silicon, Iron, Nickel and Lead.
and Pb system. Despite the requirement of higher numbers of data in BPS model and despite the fact that in this series of experiments just few results exist for every measuring point, the graphs in Figure 10 illustrate an expected tendency. This confirms the validity of the empirical results at least for the binary systems investigated in this paper in correlation with the theoretical calculated values.
The difference between the thermodynamic distribution coefficients obtained from the binary phase diagram (k0) and the k0′ obtained by BPS method is
related to the efficiency of the system, which must be improved for example by reducing the growth rate. That in turn will led to an increase in the overall puri-fication efficiency, since more time is given to allow the segregation of impurities on the growth front. Rotation speed will also play an important role on promot-ing the mixpromot-ing of the segregated impurities from the growth boundary layer to the bulk melt and hence on increasing the purification effectiveness. In the case of Ni and Pb, the obtained k0′ was expected to be similar, as seen for Fe and Si.
This difference could indicate a correlation between the impurities present in the system with the Pb and/or Ni.
4. Conclusion and Outlook
to be the most suitable one both to avoid the mushy area in the melt as well as to avoid a rapid solidification of the material over the “cooled finger”. Crystalliza-tion temperature was quite constant with ±2˚C independent from the gas flow rate or the initial temperature of the melt. However, the chemical analysis’ re-sults of the different process parameters revealed to be significantly different.
The removal efficiencies of the impurities from aluminum via experimental investigation do not show always accordance to the calculated values of distribu-tion coefficient in FactSage. That is due to the lack of taking the interacdistribu-tion of the accompanying elements into account. FactSage theoretical calculation ap-plied in this study was based only on binary (e.g. Al-X), although the empirical investigations took place considering multi-component systems.
The graphs of BPS model were confirmed to be valid for binary systems Al-Si, Al-Ni, Al-Pb and Al-Fe. An improved precision and better correlation between the BPS model and the theoretical values could be achieved through an increase in data points across a wide growth rate range, decreasing the influence of expe-rimental uncertainties. Additionally, implementation of this model into a binary system would be beneficial to avoid the influence of accompanying elements in the overall purification results.
The solid-liquid interface shape plays an important role in the impurity dis-tribution in the melt. It is expected that the boundary layer thickness can be fur-ther decreased by increasing the stirring (by rotation), and as consequence, de-creases the keff value and thereby maximizing the range of purification. The
ef-fect of rotation into the solute segregation shall be investigated in the future.
Acknowledgements
The Authors would like to appreciate Dr. Alexander Schwedt from GFE Central Facility for Electron Microscopy, RWTH Aachen University for the friendly supply of SEM/EDX analyses.
Also, many thanks to the CNPQ-Brazilian National Council for Scientific and Technological Development for the financial support of the Brazilian scholar-ship holder and guest researcher D. Curtolo.
ORCID Numbers
Dr.-Ing. Semiramis Friedrich: https://orcid.org/0000-0002-4078-0799; Danilo Coladetti Curtolo: https://orcid.org/0000-0002-7043-7094; Prof. Dr.-Ing. Dr. h.c. Bernd Friedrich: https://orcid.org/0000-0002-2934-2034.
References
[1] Scholz, R., Wangnick, K. and Ulrich, J. (1993) On the Distribution and Movement of Impurities in Crystalline Layers in Melt Crystallization Processes. Journal of Physics D: Applied Physics, 26, B156-B161.
[3] Barthel, J., Buhirg, E., et al. (1982) Verlag für Grundstoffindustrie Leipzig. Kristalli-sation aus Schmelzen, 206-207.
[4] Prostomolotov, A.I., Verezub, N.A. and Voloshin, A.E. (2014) Simplified Numerical Approach for Estimation of Effective Segregation Coefficient at the Melt/Crystal Interface. Journal of Crystal Growth, 401, 111-115.
[5] Ulrich, J. and Glade, H. (2003) Melt Crystallization-Fundamentals, Equipment and Applications. Shaker.
[6] Kurz, W. and Fisher, D.J. (1989) Fundamentals of Solidification. Trans Tech Publi-cations Ltd., Aedermannsdorf.
[7] Rudolph, P. and Nishinga, T. (2014) Handbook of Crystal Growth: Bulk Crystal Growth. Elsevier, Amsterdam, 389-397.
[8] Hurle, D.T.J. (1961) Constitutional Supercooling during Crystal Growth from Stirred Melts—I: Theoretical. Solid-State Electronics, 3, 37-44.
[9] Pfann, W.G. (1962) Zone Melting: This Technique Offers Unique Advantages in Purification and in Control of Composition in Various Substances. Science, 135, 1101-1109.
[10] Arai, K., Shingu, H., Sakaguchi, M., Nishide, T., Watanabe, O., Otsuka, R. and Tsu-kamoto, K. (1984) Process for Producing High-Purity Aluminum. US Patent No. 4469512.
[11] Ostrogorsky, A.G. and Müller, G. (1992) A Model of Effective Segregation Coeffi-cient, Accounting for Convection in the Solute Layer at the Growth Interface. Jour-nal of Crystal Growth, 121, 587-598.
[12] Hu, S., Nozawa, J., Koizumi, H., Fujiwara, K. and Uda, S. (2015) Grain Boundary Segregation of Impurities during Polycrystalline Colloidal Crystallization. Crystal Growth and Design, 15, 5685-5692.
Submit or recommend next manuscript to SCIRP and we will provide best service for you:
Accepting pre-submission inquiries through Email, Facebook, LinkedIn, Twitter, etc. A wide selection of journals (inclusive of 9 subjects, more than 200 journals)
Providing 24-hour high-quality service User-friendly online submission system Fair and swift peer-review system
Efficient typesetting and proofreading procedure
Display of the result of downloads and visits, as well as the number of cited articles Maximum dissemination of your research work
Submit your manuscript at: http://papersubmission.scirp.org/
![Figure 1. (Left) an exemplary binary phase diagram illustrating the calculation of distri-bution coefficient and (right) the influence of distribution coefficient on the melting temperature [9]](https://thumb-us.123doks.com/thumbv2/123dok_us/7749978.709756/2.595.216.535.534.691/exemplary-illustrating-calculation-coefficient-influence-distribution-coefficient-temperature.webp)
![Figure 2. Principle of cooled finger crystallization concept [10].](https://thumb-us.123doks.com/thumbv2/123dok_us/7749978.709756/3.595.250.486.525.715/figure-principle-cooled-finger-crystallization-concept.webp)
![Figure 5. The experimental temperature gradient between the molten bath and the “cooled finger” according to the Process Parameters Melt Temp [˚C] as well as cooling gas flow rate (L/min)](https://thumb-us.123doks.com/thumbv2/123dok_us/7749978.709756/6.595.210.535.499.689/figure-experimental-temperature-gradient-according-process-parameters-cooling.webp)