ISSN Online: 2164-3032 ISSN Print: 2164-3024
FLAIR in Gd-EOB-DTPA Enhanced MRI: Does It
Make a Difference?
Makoto Hasegawa, Miki Sugiyama, Nozomu Murata, Masashi Nagamoto, Tatsuya Gomi
Department of Radiology, Toho University Ohashi Medical Center, Tokyo, Japan
Abstract
Background: Gadolinium-ethoxybenzyl-diethylenetriamine pentaacetic acid (Gd-EOB-DTPA; gadoxetic acid disodium, Primovist, Bayer Healthcare, Ber-lin, Germany) is a gadolinium based contrast agent with hepatocyte specific properties. In patients scanned for hepatic metastasis using Gd-EOB-DTPA, it is important to differentiate hepatic metastasis with cysts and hemangiomas, which are the two most common benign lesions seen in the liver. Yet, in some cases it is difficult to differentiate these lesions. Purpose: The purpose of this study was to retrospectively investigate the usefulness of combining Fluid-at- tenuated inversion recovery (FLAIR) with Gd-EOB-DTPA enhanced MRI. Material and Methods: Gd-EOB-DTPA enhanced MRIs of 47 patients (19 male, 27 female) with a mean age of 68 years (range 32 - 85 years old) with a total of 121 lesions (68 cysts, 37 metastasis, 16 hemangiomas) were included in the study. T1WI, T2WI, heavy T2WI, dynamic contrast enhanced MRI, and FLAIR images of these lesions were evaluated. The patients were ran-domly divided into two groups (Groups A and B), and two independent radi-ologists were asked to give a diagnosis for each lesion. The radiradi-ologists were allowed to view FLAIR images for only Group B. Diagnostic performance re-garding the differentiation of cysts, hemangiomas and metastases was as-sessed. MRI examinations were scanned using a 1.5 Tesla system (Echlon Ve-ga, Hitachi,) with an 8 channel multiple array coil (RAPID body coil). Results: An statistically significant improvement (p < 0.05) of the specificity for cysts was seen from 71.9% (Group A) to 90.9% (Group B) for Reader 1, and 75.0% (Group A) to 93.3% (Group B) for Reader 2. No statistical differences were seen between the two groups for sensitivity and specificity of hemangiomas. Although no statistical difference was seen between the two groups, an im-provement (77.8 in Group A to 97.2 in Group B for Reader 1, and 85.7 in Group A to 100 in Group B for Reader 2) was seen for the sensitivity of me-tastasis with the addition of FLAIR. Conclusion: An improvement of diagnos-tic accuracy, especially for cysts, was seen with the addition of FLAIR to Gd- EOB-DTPA enhanced MRI.
How to cite this paper: Hasegawa, M., Sugiyama, M., Murata, N., Nagamoto, M. and Gomi, T. (2017) FLAIR in Gd-EOB- DTPA Enhanced MRI: Does It Make a Difference? Open Journal of Radiology, 7, 130-142.
https://doi.org/10.4236/ojrad.2017.72015
Received: March 14, 2017 Accepted: June 19, 2017 Published: June 22, 2017
Copyright © 2017 by authors and Scientific Research Publishing Inc. This work is licensed under the Creative Commons Attribution International License (CC BY 4.0).
http://creativecommons.org/licenses/by/4.0/
Keywords
MRI, Abdomen, Liver Imaging, EOB, FLAIR, Heavy T2WI, Metastasis, Hemangioma, Cyst
1. Introduction
Hepatobiliary-specific contrast agents are a type of contrast agents used in mag-netic resonance imaging (MRI). These agents are taken up by hepatocytes and excreted into the bile ducts. For these properties, a dynamic study as well as he-patobiliary phase images with good lesion to liver contrast can be obtained. There are two hepatobiliary specific contrast agents available; Gadolinium- ethoxybenzyl-diethylenetriamine pentaacetic acid (Gd-EOB-DTPA; Primovist, Bayer Healthcare) and gadobenate dimeglumine (Gd-BOPTA; MultiHance, Bracco). In Japan, only Gd-EOB-DTPA is available.
Gd-EOB-DTPA enhanced magnetic resonance imaging (MRI) has become an important tool for the imaging of the liver, and has been reported to have a good sensitivity and specificity for the diagnosis of hepatic lesions [1] [2] [3] [4] [5]. In patients who are scanned for hepatic metastasis using Gd-EOB-DTPA, the differentiation of metastasis from cyst and hemangioma, the two most common benign lesions of the liver, is important. Yet, in some cases, it is difficult to diffe-rentiate these lesions, especially in small lesions [6]. Other sequences such as heavy T2 weighted imaging (T2WI) and diffusion weighted imaging (DWI) have been reported to be useful for the differentiation of focal hepatic lesions [7]-[12]. Yet, DWI can be somewhat system dependent, and is sensitive to motion [13]. Even with the addition of these sequences, the differentiation is sometimes dif-ficult.
Fluid-attenuated inversion recovery (FLAIR) is an inversion recovery tech-nique with a long inversion time (usually set to 2000 ms) which suppresses flu-ids. FLAIR has been used to suppress cerebrospinal fluid in brain MRI which fa-cilitates lesion identification. Also, FLAIR can suppress the signal of cysts in liver MRI, and has been previously reported to be useful in differentiating cysts and hemangiomas in conventional MRI studies without contrast enhancement [14]. Yet, the use of FLAIR has not been evaluated in combination with Gd-EOB- DTPA enhanced MRI.
2. Purpose
In this study, we retrospectively investigate the usefulness of FLAIR combined with Gd-EOB-DTPA enhanced MRI for the differentiation of metastasis, cysts and hemangiomas.
3. Materials and Methods
3.1. Patients
This study is in accordance with the principles of the Declaration of Helsinki. We retrospectively reviewed records of 102 patients who were scanned for liver lesions by Gd-EOB-DTPA enhanced MRI between January and December 2010. Patients who received a dynamic contrast enhanced computed tomogra-phy (CT) study and/or abdominal ultrasound (US) within 1 month from the MRI who also underwent follow up MRI and/or CT and/or US 6 months after the initial MRI were included in the study. Patients who were diagnosed with metastasis, cysts, and hemangiomas were identified and included in the study.
Patients with no follow up studies after 6 months from the initial MRI study, and lesions that could not be proven by correlative studies were excluded (36 pa-tients). Also, this study focused on the differentiation of metastases, cysts and hemangiomas, therefore patients with hepatocellular carcinoma (HCC) were ex-cluded from the study (20 patients).
A total of 46 patients (19 male, 27 female) with a mean age of 68 years (range 32 - 85 years old) were included in the study.
3.2. Lesion Identification and Characterization
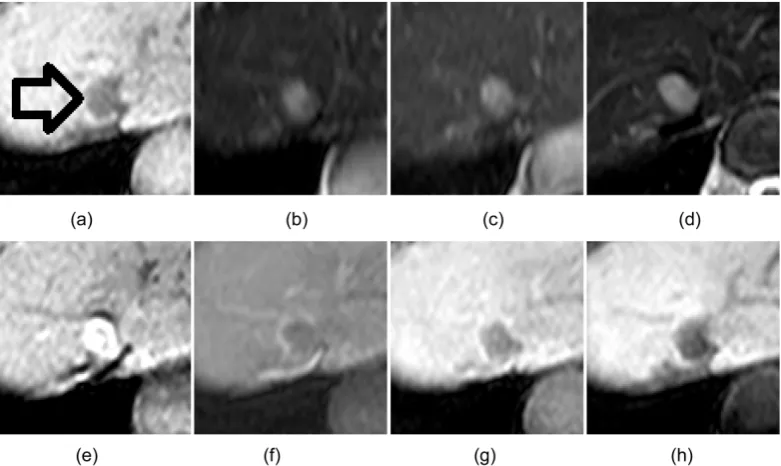
The diagnostic criteria for the lesions were as follows:For cysts 1) Imaging characteristics compatible with cysts (Echo-free lesion with distal enhancement) at US, and/or (Low attenuating area with no en-hancement) at contrast-enhanced CT, and/or (High intensity area seen at T2WI and Heavy T2WI, and hypointensity or iso-intensity compared to the liver pa-renchyma on FLAIR with no enhancement in post-contrast images) at Gd-EOB- DTPA enhanced MRI (Figure 1). 2) No change seen in size or number at six month follow up.
For hemangiomas 1) Imaging characteristics compatible with hemangiomas (Well defined homogeneous hyperechoic appearance) at US, and/or (Low at-tenuating lesion with peripheral nodular enhancement at the early phase, persis-tent enhancement with subsequent fill in at delayed phase) at contrast enhanced CT, and/or (High intensity area at T2WI, Heavy T2WI, and FLAIR with peri-pheral nodular enhancement at the early phase, persistent enhancement with subsequent fill in at delayed phase) at Gd-EOB-DTPA enhanced MRI (Figure 2). 2) No change seen in size or number at six month follow up.
For metastasis 1) Imaging characteristics compatible with metastasis (Hypoe-choic lesion) at US, and/or (Low attenuating mass with peripheral enhancement) at CT, and/or (High intensity on T2WI and FLAIR, Iso-intensity or high inten-sity compared to liver parenchyma on Heavy T2WI and peripheral enhancement on post-contrast images) at Gd-EOB-DTPA-enhanced MRI (Figure 3). 2) In-crease in size or number at six months follow up.
Figure 1. Characteristic MRI images of cysts. A small low intensity area is seen on T1WI (a). The lesion is high intensity on T2WI (b) and Heavy T2WI (c), and hypointensity compared to the liver parenchyma on FLAIR (d). No enhancement is seen on post-contrast images (e)-(h).
Figure 2. Characteristic MRI images of hemangiomas. A low intensity area is seen on T1WI (a). The lesion
[image:4.595.145.539.395.668.2]Figure 3. Characteristic MRI images of metastases. A low intensity area is seen on T1WI (a). The lesion is high intensity on T2WI (b) and FLAIR (c), slightly high intensity compared to liver parenchyma on Heavy T2WI (d) and peripheral enhancement on post-contrast images (e)-(g).
Table 1. Patients and lesions included in the study.
Group A Group B
Patient 23 23
Age 62 (45 - 80 y.o.) 68 (32 - 85 y.o.)
Cysts 37 31
Metastasis 14 23
Hemangiomas 9 7
was 7 mm for cysts, 16 mm for metastasis, and 11 mm for hemangiomas (Table 2). A statistical difference in size was seen between the different types of lesions (p < 0.001). Primary site for metastasis included 9 colorectal cancers, 1 esopha-geal cancer, 3 gastric cancers, 1 pancreatic cancer, 1 urinary bladder cancer, 2 breast cancers, and 1 malignant melanoma.
Lesions were identified and selected by one radiologist with 9 years of expe-rience in general radiology (M.H.).
3.3. MRI
MRI examinations were scanned using a 1.5 Tesla system (Echelon Vega, Hita-chi, Tokyo, Japan) with a 8 channel multiple array coil (RAPID body coil).
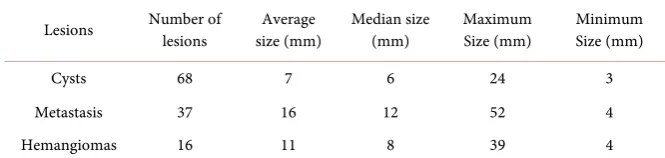
[image:5.595.140.540.382.477.2]Table 2. Lesion characteristics.
Lesions Number of lesions size (mm) Average Median size (mm) Maximum Size (mm) Minimum Size (mm)
Cysts 68 7 6 24 3
Metastasis 37 16 12 52 4
Hemangiomas 16 11 8 39 4
(GRE), TR/TE, 4.3/1.8; flip angle, 12˚; FOV, 370 mm; matrix, 256,256; 64 slices; slice thickness, 6 mm; gap, −3 mm, respiratory-triggered T2-weighted fast spin echo (FSE), TR/TE, 3000/100; FOV, 370 mm; matrix 256 × 220; 22 slices; slice thickness, 7 mm; gap, 0.7 mm, breath-hold single shot-FSE, TR/TE, 13,000/100; FOV, 370 mm; matrix 224 × 200; 22 slices; slice thickness, 7 mm; gap, 0.7 mm; breath-hold FLAIR, TR/TE, 3000/100; inversion time (TI), 2200 ms, FOV, 370 mm; matrix 224 × 200; 22 slices; slice thickness, 7 mm; gap, 0.7 mm; scan time 20 sec. respiratory-triggered echo planner imaging-diffusion-weighted imaging, TR/TE, 3000/52; b = 500; FOV, 370 mm; matrix 128 × 96; 22slices; slice thick-ness, 7 mm; gap, 0.7 mm. The arterial phase, portal phase, late phase, and hepa-tobiliary phase was scanned 25 seconds, 60 seconds, 120 seconds and 15 minutes after injection of Gd-EOB-DTPA respectively with a fat saturated 3D-T1 weighted GRE sequence (Table 3).
The intravenous bolus injection of Gd-EOB-DTPA administered was 0.025 mmol/kg (0.1 mL/kg bodyweight).
3.4. Imaging Analysis
A commercially available picture archiving and reporting system (Rapideye Core, Toshiba, Tochigi, Japan) was used to evaluate the images.
One radiologist with 23 years of experience in abdominal radiology (T.G.), and one radiologist with 8 years of experience in general radiology (N.M.) eva-luated the images and gave a diagnosis for each lesion that was marked for eval-uation. The radiologists were informed that the study only included cysts, he-mangiomas, and metastasis and were blinded of the clinical information as well as CT and ultrasound images.
To avoid recall bias, the patients were randomly divided into two groups Group A, and Group B. For Group A, the radiologists were allowed to evaluate the dynamic study combined with T2WI and heavy T2WI images, and for Group B, the dynamic study combined with T2WI, heavy T2WI and FLAIR im-ages for the diagnosis for each lesion.
3.5. Statistical Analysis
Statistical analysis was performed using a commercially available software pack-age SPSS Statistics and EXCEL.
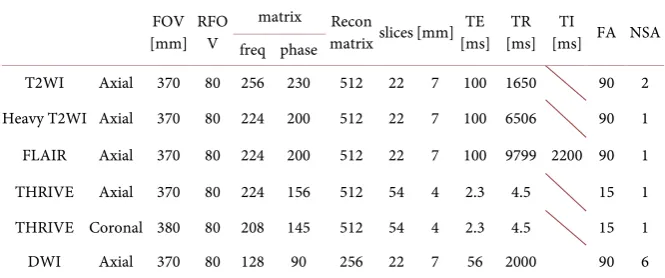
Table 3. MRI sequences scanned.
FOV [mm] RFOV
matrix Recon
matrix slices [mm] [ms] TE [ms] TR [ms] FA NSA TI freq phase
T2WI Axial 370 80 256 230 512 22 7 100 1650 90 2
Heavy T2WI Axial 370 80 224 200 512 22 7 100 6506 90 1
FLAIR Axial 370 80 224 200 512 22 7 100 9799 2200 90 1
THRIVE Axial 370 80 224 156 512 54 4 2.3 4.5 15 1
THRIVE Coronal 380 80 208 145 512 54 4 2.3 4.5 15 1
DWI Axial 370 80 128 90 256 22 7 56 2000 90 6
Sensitivity, specificity, positive predictive value, negative predictive values were calculated for cysts, metastasis, and hemagiomas for both Groups A and B. Mantel Haenszel procedure was used to evaluate the effect of FLAIR for the di-agnosis of the lesion between Group A and B.
For each test a two-tailed P value of 0.05 was considered to indicate a statisti-cally significant difference.
4. Results
Diagnosis (Table 4).
4.1. Cysts
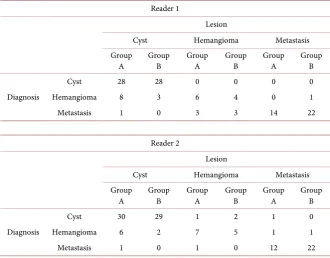
Reader 1 correctly diagnosed 28/37 cysts in Group A, compared to 28/31 in Group B. 8 cysts were diagnosed as hemangiomas, and 1 cyst was diagnosed as a metastasis in Group A. 3 cysts were diagnosed as hemangiomas in Group B. Reader 2 correctly diagnosed 30/37 cysts in Group A, compared to 29/31 in Group B.6 cysts were diagnosed as hemangiomas and 1 cyst was diagnosed as a metastasis in Group A. 2 cysts were diagnosed as hemangiomas in Group B.
4.2. Hemangiomas
Reader 1 correctly diagnosed 6/9 hemangiomas in Group A, compared to 4/7 in Group B. 3 hemangiomas were diagnosed as metastasis in Group A, and 3 he-mangiomas were diagnosed as metastases in Group B. Reader 2 correctly diag-nosed 7/9 hemangiomas in Group A, compared to 5/7 in Group B. 1 hemangi-omas were diagnosed as cyst and 1 as a metastasis in Group A. 2 hemangihemangi-omas were diagnosed as cysts in Group B.
4.3. Metastases
Table 4. Diagnosis given by Readers 1 and 2 for all lesions.
Reader 1
Lesion
Cyst Hemangioma Metastasis
Group
A Group B Group A Group B Group A Group B
Diagnosis
Cyst 28 28 0 0 0 0
Hemangioma 8 3 6 4 0 1
Metastasis 1 0 3 3 14 22
Reader 2
Lesion
Cyst Hemangioma Metastasis
Group
A Group B Group A Group B Group A Group B
Diagnosis
Cyst 30 29 1 2 1 0
Hemangioma 6 2 7 5 1 1
Metastasis 1 0 1 0 12 22
4.4. Statistical Analysis (Table 5 and Table 6)
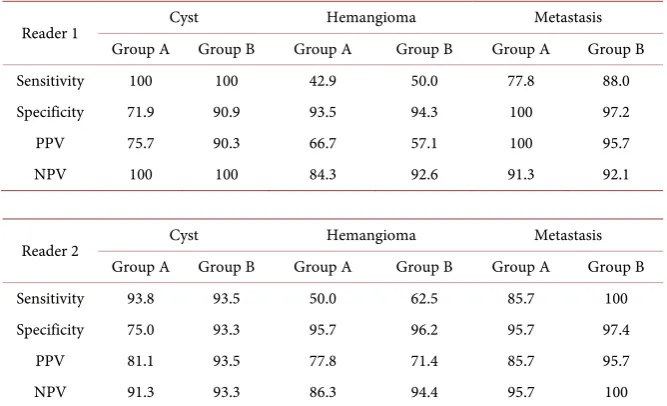
The sensitivity for cysts was 100% for both Group A and Group B for Reader 1 and 93.8% for Group A and 93.5% for Group B for Reader 2. The specificity for cysts increased from 71.9% (Group A) to 90.9% (Group B) for Reader 1, and 75.0% (Group A) to 93.3% (Group B) for Reader 2. A statistical difference was seen in the diagnosis of cysts between Group A and Group B.
The sensitivity and specificity for hemangiomas were 42.9 and 93.5 for Group A, 50 and 94.3 for Group B respectively for Reader 1. For Reader 2, the sensitivi-ty and specificisensitivi-ty were 50.0 and 95.7 for Group A, 62.5 and 96.2 for Group B re-spectively. No statistical difference was seen.
The sensitivity and specificity for metastasis were 77.8 and 100 for Group A, 88 and 97.2 for Group B respectively for Reader 1. For Reader 2, the sensitivity and specificity were 85.7 and 95.7 for Group A, 100 and 97.4 for Group B re-spectively. Although no statistical difference was seen between the two groups, an improvement was seen for the sensitivity of metastasis with the addition of FLAIR.
5. Discussion
The liver is the second most common site of metastasis after regional lymph nodes, making it the most common malignancy found in the liver. Therefore, it is important to differentiate cysts and cavernous hemangiomas, the two most common benign lesions found in the liver, with metastases. CT, US, and MRI has been mainly used to detect and differentiate these lesions.
Table 5. Diagnostic accuracy of Readers 1 and 2 for both Groups A and B.
Reader 1 Cyst Hemangioma Metastasis
Group A Group B Group A Group B Group A Group B
Sensitivity 100 100 42.9 50.0 77.8 88.0
Specificity 71.9 90.9 93.5 94.3 100 97.2
PPV 75.7 90.3 66.7 57.1 100 95.7
NPV 100 100 84.3 92.6 91.3 92.1
Reader 2 Cyst Hemangioma Metastasis
Group A Group B Group A Group B Group A Group B
Sensitivity 93.8 93.5 50.0 62.5 85.7 100
Specificity 75.0 93.3 95.7 96.2 95.7 97.4
PPV 81.1 93.5 77.8 71.4 85.7 95.7
NPV 91.3 93.3 86.3 94.4 95.7 100
Table 6. Statistical difference between the two groups using Mantel Haenszel.
Statistical difference between Group A and Group B (p < 0.05)
Cyst 0.0290
Hemangioma 0.3892
Metastasis 0.6035
Overall 0.0569
metastasis and primary site of the malignancy. By adding dynamic contrast en-hancement, the vascularity of the tumor can be depicted, and is useful for the differentiation of liver lesions. Yet, CT scans involve radiation exposure, and has been reported to have a lower sensitivity and specificity compared to MRI [3] [5] [15] [16]. The sensitivity of metastasis has been reported to be 63.4% - 84.62% for contrast enhanced CT compared to 90% - 100.0% for Gd-EOB-DTPA en-hanced MRI. The difference was more pronounced in small lesions under 10 mm, with a sensitivity of 26.0% - 64.5% for contrast enhanced CT and 80.7% - 92.31% for Gd-EOB-DTPA enhanced MRI [5].
Conventional B-mode abdominal ultrasound is a widely available method with no exposure to radiation, and is considered one of the first choice tech-niques for liver imaging. Also, with the introduction of microbubble enhanced ultrasound, overall diagnostic accuracy has increased [17] [18]. Yet, the diagnos-tic accuracy of abdominal ultrasound is operator dependent, and is difficult in obese patients as well as patients with bowel gas. Also, lesions near the dome of the diaphragm can be difficult to detect [3].
[image:9.595.207.539.327.405.2]Gd-EOB-DTPA is a liver specific contrast agent. Uptake of the contrast media into heptatocytes enhances the liver parenchyma, and lesions without hepato-cytes remain unenhanced in the hepatobilliary phase. Therefore, an excellent le-sion to liver contrast is obtained. With the introduction of Gd-EOB-DTPA, sen-sitivity and specificity of liver lesions has increase compared to conventional MRI [1] [2] [3] [4] [11] [22] [23]. These agents have also been investigated for their use in assessment of biliary anatomy and hepatic function [24] [25] [26]. There are some limitations for hepatobiliary specific contrast agents such as 1) an increased cost, 2) increased examination time with the addition of the hepa-tobiliary phase which may be 10 minutes to hours after contrast agent adminis-tration, 3) the characteristics of the late phase images are different compared to non-hepatobiliary specific agents [27] [28].
The use of FLAIR has previously been reported to be useful for the differen-tiation between cysts and hemangiomas in unenhanced MRI [14]. The authors reported an improvement of diagnostic performance with a sensitivity of 89.5%, specificity of 97.6 and accuracy of 92.0%. Also, it has been reported in conjunc-tion with SPIO enhanced MRI for the diagnosis of HCC [29].
In this study, although the size of cysts were statistically smaller than metas-tases and hemangiomas, the diagnostic performance that was obtained was sen-sitivity 100%, specificity 97%, which was comparable to or slightly better than the results of the previous study by Sasaki et al. which was conducted with MRI without contrast enhancement (sensitivity 89.5%, specificity 97.5) [14]. The in-crease in diagnostic performance could have been attributed to the addition of the dynamic study using Gd-EOB-DTPA. With the addition of FLAIR to Gd- EOB-DTPA enhanced MRI, an improvement for the sensitivity and specificity of cysts may be possible.
The differentiation of hemangiomas and metastasis is sometimes difficult [6] [28] [30]. When using Gd-EOB-DTPA as a contrast agent, the late phase is dif-ferent compared to non-hepatobiliary specific contrast agents, because the con-trast agent is taken in by hepatocytes, and may become a pitfall [28]. Although not statistically significant, an increase for the sensitivity of metastasis and he-mangiomas was seen for both readers A and B with the addition of FLAIR. Also, the diagnostic performance for metastasis in this study with the addition of FLAIR (Group B) was sensitivity and specificity of 88 and 97.2 for Reader 1, 100 and 97.4 for Reader 2 respectively. These results are comparable or better com-pared to previous reports without FLAIR (sensitivity 86.9% - 100.0%, specificity 80.2% - 98.0%) [5]. This was thought to be due to the increased sensitivity of cysts, which lowered the number of hemangiomas and metastases that were di-agnosed as cysts.
Three cysts were interpreted as hemangiomas for Reader 1 and two cysts were interpreted as hemangiomas for Reader 2. The signal of these cysts was not sup-pressed on FLAIR images. These cysts could have been filled with protein rich such as ciliated foregut cysts, or could have contained hemorrhagic content [31].
included in the study was relatively small (n = 121), and the number of heman-giomas were small (n = 16) compared to the other lesions. A larger number of lesions could have shown statistical differences for sensitivity and specificity of hemangiomas and metastases between the two groups. Hepatic lesions with lower incidences compared to cysts, hemangiomas, and metastasis such as focal nodular hyperplasia, hepatobiliary carcinoma, cholangiocarcinomas were not included in this study. However, our study focused on the differentiation of me-tastasis from benign lesions with high incidences, which are seen in daily prac-tice. Pathological proof for the lesions could not be obtained for most of the le-sions, because most of the lesions included in our studies were benign. Yet, we believe adequate correlative studies and follow up was obtained for the lesions included in the study.
6. Conclusion
In conclusion, an improvement of diagnostic accuracy for cysts was seen with the addition of FLAIR to Gd-EOB-DTPA enhanced MRI. This improvement decreased the cases of small metastasis diagnosed as cysts. However, a minimal improvement was seen for the differentiation between small hemangiomas and metastases.
References
[1] Tanimoto, A., et al. (2009) Consensus Report of the 2nd International Forum for Liver MRI. European Radiology, 19, S975-S989.
https://doi.org/10.1007/s00330-009-1624-y
[2] Lee, J.M., et al. (2011) Consensus Report of the 4th International Forum for Gadoli-nium-Ethoxybenzyl-Diethylenetriamine Pentaacetic Acid Magnetic Resonance Im-aging. Korean Journal of Radiology, 12, 403-415.
https://doi.org/10.3348/kjr.2011.12.4.403
[3] Muhi, A., et al. (2011) Diagnosis of Colorectal Hepatic Metastases: Comparison of Contrast-Enhanced CT, Contrast-Enhanced US, Superparamagnetic Iron Oxide- Enhanced MRI, and Gadoxetic Acid-Enhanced MRI. Journal of Magnetic Reson-ance Imaging, 34, 326-335. https://doi.org/10.1002/jmri.22613
[4] Holzapfel, K., et al. (2012) Detection, Classification, and Characterization of Focal Liver Lesions: Value of Diffusion-Weighted MR Imaging, Gadoxetic Acid-En- hanced MR Imaging and the Combination of Both Methods. Abdominal Imaging, 37, 74-82. https://doi.org/10.1007/s00261-011-9758-1
[5] Vreugdenburg, T.D., et al. (2016) Comparative Diagnostic Accuracy of Hepatocyte- Specific Gadoxetic Acid (Gd-EOB-DTPA) Enhanced MR Imaging and Contrast Enhanced CT for the Detection of Liver Metastases: A Systematic Review and Meta- Analysis. International Journal of Colorectal Disease, 31, 1739-1749.
https://doi.org/10.1007/s00384-016-2664-9
[6] Goshima, S., et al. (2010) Hepatic Hemangioma and Metastasis: Differentiation with Gadoxetate Disodium-Enhanced 3-T MRI. American Journal of Roentgenology, 195, 941-946. https://doi.org/10.2214/AJR.09.3730
[7] Taouli, B. and Koh, D.M. (2010) Diffusion-Weighted MR Imaging of the Liver. Ra-diology, 254, 47-66. https://doi.org/10.1148/radiol.09090021
World Journal of Gastroenterology, 16, 1567-1576.
https://doi.org/10.3748/wjg.v16.i13.1567
[9] Nasu, K., et al. (2006) Hepatic Metastases: Diffusion-Weighted Sensitivity-Encoding versus SPIO-Enhanced MR Imaging. Radiology, 239, 122-130.
https://doi.org/10.1148/radiol.2383041384
[10] McFarland, E.G., et al. (1994) Hepatic Hemangiomas and Malignant Tumors: Im-proved Differentiation with Heavily T2-Weighted Conventional Spin-Echo MR Imaging. Radiology, 193, 43-47. https://doi.org/10.1148/radiology.193.1.8090920
[11] Donati, O.F., Fischer, M.A., Chuck, N., Hunziker, R., Weishaupt, D. and Reiner, C.S. (2012) Accuracy and Confidence of Gd-EOB-DTPA Enhanced MRI and Diffu-sion-Weighted Imaging Alone and in Combination for the Diagnosis of Liver Me-tastases. European Journal of Radiology, 82, 822-828.
[12] Ito, K., Mitchell, D.G., Outwater, E.K., Szklaruk, J. and Sadek, A.G. (1997) Hepatic Lesions: Discrimination of Nonsolid, Benign Lesions from Solid, Malignant Lesions with Heavily T2-Weighted Fast Spin-Echo MR Imaging. Radiology, 204, 729-737.
https://doi.org/10.1148/radiology.204.3.9280251
[13] Koike, N., et al. (2009) Role of Diffusion-Weighted Magnetic Resonance Imaging in the Differential Diagnosis of Focal Hepatic Lesions. World Journal of Gastroenter-ology, 15, 5805-5812.
[14] Sasaki, K., et al. (2005) Differentiation between Hepatic Cyst and Hemangioma: Additive Value of Breath-Hold, Multisection Fluid-Attenuated Inversion-Recovery Magnetic Resonance Imaging Using Half-Fourier Acquisition Single-Shot Tur-bo-Spin-Echo Sequence. Journal of Magnetic Resonance Imaging, 21, 29-36.
https://doi.org/10.1002/jmri.20226
[15] Eiber, M., et al. (2012) Detection and Classification of Focal Liver Lesions in Pa-tients with Colorectal Cancer: Retrospective Comparison of Diffusion-Weighted MR Imaging and Multi-Slice CT. European Journal of Radiology, 81, 683-691.
https://doi.org/10.1016/j.ejrad.2011.01.072
[16] Stark, D.D., Wittenberg, J., Butch, R.J. and Ferrucci Jr., J.T. (1987) Hepatic Metas-tases: Randomized, Controlled Comparison of Detection with MR Imaging and CT.
Radiology, 165, 399-406. https://doi.org/10.1148/radiology.165.2.3310094
[17] Piscaglia, F., et al. (2010) Characterization of Focal Liver Lesions with Contrast- Enhanced Ultrasound. Ultrasound in Medicine & Biology, 36, 531-550.
https://doi.org/10.1016/j.ultrasmedbio.2010.01.004
[18] Shiozawa, K., et al. (2017) Comparison of Contrast-Enhanced Ultrasonograpy with Gd-EOB-DTPA-Enhanced MRI in the Diagnosis of Liver Metastasis from Colorec-tal Cancer.Journal of Clinical Ultrasound, 45, 138-144.
https://doi.org/10.1002/jcu.22421
[19] Silva, A.C., et al. (2009) MR Imaging of Hypervascular Liver Masses: A Review of Current Techniques. Radiographics, 29, 385-402.
https://doi.org/10.1148/rg.292085123
[20] Itoh, K., Saini, S., Hahn, P.F., Imam, N. and Ferrucci, J.T. (1990) Differentiation between Small Hepatic Hemangiomas and Metastases on MR Images: Importance of Size-Specific Quantitative Criteria. American Journal of Roentgenology, 155, 61- 66. https://doi.org/10.2214/ajr.155.1.2112865
[21] Wittenberg, J., et al. (1988) Differentiation of Hepatic Metastases from Hepatic Hemangiomas and Cysts by Using MR Imaging. American Journal of Roentgenol-ogy, 151, 79-84. https://doi.org/10.2214/ajr.151.1.79
Imag-ing: Multicenter Comparison of Gadoxetic Acid-Enhanced MR Images with Intra-operative Findings. Radiology, 230, 266-275.
https://doi.org/10.1148/radiol.2301020269
[23] Zech, C.J., Herrmann, K.A., Reiser, M.F. and Schoenberg, S.O. (2007) MR Imaging in Patients with Suspected Liver Metastases: Value of Liver-Specific Contrast Agent Gd-EOB-DTPA. Magnetic Resonance in Medical Sciences, 6, 43-52.
[24] Ning, J., et al. (2016) Hepatic Function Imaging Using Dynamic Gd-EOB-DTPA Enhanced MRI and Pharmacokinetic Modeling. Magnetic Resonance in Medicine.
https://doi.org/10.1002/mrm.26520
[25] Sheng, R.F., et al. (2017) Assessment of Liver Fibrosis Using T1 Mapping on Gd- EOB-DTPA-Enhanced Magnetic Resonance. Digestive and Liver Disease, in press.
https://doi.org/10.1016/j.dld.2017.02.006
[26] Kul, M., Erden, A. and Dusunceli Atman, E. (2017) Diagnostic Value of Gd-EOB- DTPA-Enhanced MR Cholangiography in Non-Invasive Detection of Postoperative Bile Leakage. The British Journal of Radiology, 90, Article ID: 20160847.
https://doi.org/10.1259/bjr.20160847
[27] Seale, M.K., Catalano, O.A., Saini, S., Hahn, P.F. and Sahani, D.V. (2009) Hepatobi-liary-Specific MR Contrast Agents: Role in Imaging the Liver and Biliary Tree. Ra-diographics, 29, 1725-1748. https://doi.org/10.1148/rg.296095515
[28] Tateyama, A., et al. (2016) Hepatic Hemangiomas: Factors Associated with Pseudo Washout Sign on Gd-EOB-DTPA-Enhanced MR Imaging. Magnetic Resonance in Medical Sciences, 15, 73-82. https://doi.org/10.2463/mrms.2014-0125
[29] Matsushima, M., et al. (2010) Diagnostic Value of SPIO-Mediated Breath-Hold, Black-Blood, Fluid-Attenuated, Inversion Recovery (BH-BB-FLAIR) Imaging in Pa-tients with Hepatocellular Carcinomas. Magnetic Resonance in Medical Sciences, 9, 49-58. https://doi.org/10.2463/mrms.9.49
[30] Bennett, G.L., et al. (2000) Addition of Gadolinium Chelates to Heavily T2- Weighted MR Imaging: Limited Role in Differentiating Hepatic Hemangiomas from Metastases. American Journal of Roentgenology, 174, 477-485.
https://doi.org/10.2214/ajr.174.2.1740477
[31] Kadoya, M., et al. (1990) Ciliated Hepatic Foregut Cyst: Radiologic Features. Radi-ology, 175, 475-477. https://doi.org/10.1148/radiology.175.2.2183286
Submit or recommend next manuscript to SCIRP and we will provide best service for you:
Accepting pre-submission inquiries through Email, Facebook, LinkedIn, Twitter, etc. A wide selection of journals (inclusive of 9 subjects, more than 200 journals)
Providing 24-hour high-quality service User-friendly online submission system Fair and swift peer-review system
Efficient typesetting and proofreading procedure
Display of the result of downloads and visits, as well as the number of cited articles Maximum dissemination of your research work