ISSN Online: 2156-8367 ISSN Print: 2156-8359
DOI: 10.4236/ijg.2017.83012 March 16, 2017
Exploring Sandstone Body in Weak Electrical
Resistivity Contrast with AMT Data
*
Shancong Yao
1,2, Mao Wang
1, Shuxin Duan
2, Shuang Chen
3, Wusheng Liu
2, Delin Xu
21School of Geophysics and Information Technology, China University Geosciences (Beijing), Beijing, China
2CNNC Key Laboratory of Uranium Resource Exploration and Evaluation Technology, Beijing Research Institute of Uranium
Geology, Beijing, China
3No. 208 Geological Party, CNNC, Baotou, Inner Mongolia, China
Abstract
AMT method with the economical and convenient superiority plays a key role in exploring the sandstone-type uranium deposits in China, which mainly meets to four problems such as the thickness of overlying strata, delineating the shape of the significant sand bodies, whether there are buried structures and knowing the basement relief. Exploring the sand body shape is the key one among such problems because sand body provides the room of uranium deposits and is the prerequisite for exploring uranium mineralization. Through an example of outlining the sandstone layer within the mudstone layers, the ability can be improved to recognize the electrical resistivity anomaly among the weak electrical property contrast by adjusting the inversion model’s scale. A route to deal with the problem was given by inverting different scale models followed by checking whether the anomalies of each inversion are reliable. Finally, the geo-electrical model was to be determined by comparing results of different scale model.
Keywords
AMT, Inversion Model Scale, Recognizing the Electrical Resistivity Anomaly
1. Introduction
Up to 1980’s, natural source EM method had not been applied to shallow geo-physical exploration, while the MT method acquiring below several hundred Hz natural EM signals was mainly developed. AMT (the natural-source audio- magnetotelluric method) has become a key geophysical exploration method in several decades.
*AMT, the natural-source audio-magnetotelluric method. How to cite this paper: Yao, S.C., Wang,
M., Duan, S.X., Chen, S., Liu, W.S. and Xu, D.L. (2017) Exploring Sandstone Body in Weak Electrical Resistivity Contrast with AMT Data. International Journal of Geos-ciences, 8, 277-285.
https://doi.org/10.4236/ijg.2017.83012
Received: February 18, 2017 Accepted: March 13, 2017 Published: March 16, 2017
Copyright © 2017 by authors and Scientific Research Publishing Inc. This work is licensed under the Creative Commons Attribution International License (CC BY 4.0).
With speedy development of miscro-computer and signal processing and emergence of the impedance tensor decomposition, the commercial AMT in-struments become mature up to 1990s and are applied for different purposes. With the advantage of economy and convenience as well as the ability to explore shallow objects (less than 2000 meters), many users are attracted to apply AMT to different fields such as ore exploration, engineer surveying and looking for water resources, etc. The more applied, the more techniques were promoted. In the past decades, many researchers were focusing on forward and inversion techniques of EM problems and there were new algorithms, which resulted in the significance of the feasible 2D inversion algorithms in field practices. How-ever, there is little focus on model making. There are only several articles dis-cussing the model making, such as Wannamaker et al. (1985) [1] and Weaver (1994) [2] giving general suggestions.
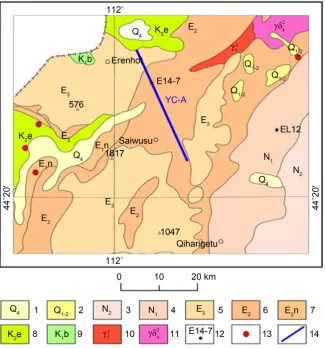
In the late 20th century, China began to devote exploring and mining leacha-ble stand-stone type uranium Deposits, which enhanced AMT application in this field. AMT method in exploring uranium deposit exploration can give informa-tion of four aspects, such as the thickness of overlying strata, delineating the shape of the significant sand bodies, whether there are buried structures and knowing the basement relief. Uranium deposits exist in Erlian basin, the petro-leum producer in northern China. Nuheting uranium deposit was discovered many years ago, but several other uranium deposits were found in recent years. To update exploring techniques and extend the area of uranium deposits, CNNC initiated Enlarging Uranium Resource and Evaluation technology Research for Building Mining Base project in 2010, which included several basins such as Er-lian basin. Many new geophysical and geological data were acquired in this project to improve understanding geological units setting and determining new uranium deposits. An AMT profile (YC profile) was recorded in 2014, locating at the eastern Erlianhot and the northern Ulanqab depression (Figure 1 and
Figure 2). During processing data of this AMT profile, using general data pro-
cessing method could not identify the significant stand stone body because there are much thicker mudstone layers underground.
The particular aims of this paper are to present an AMT application of recog-nizing sandstone body in the weak resistivity contrast at Erlian basin of China and to give an AMT data inverting route to deal with the problem in such situa-tion.
2. Geologic Setting and Resistivity Well-Logging Curve
2.1. Geologic Setting [3]
Erlian basin was meso-cenozoic inland basin developed in Tianshan-Mongolia- Xingan Variscan fold belts, which are the south-east margin of the Central Asia Mongolia geosynclinals fold belt.
Figure 1. Geotectonic elements diagram of Erlian basin (after No. 208 Geological Party, CNNC. and Liu et al. (2013)).
[image:3.595.211.537.321.670.2]Aershan formation (K1a), Tenggeer formation (K1t), Saihan formation (K1s) and Erlain formation (K2e) from bottom to top. The major tectonic line is in E-W direction.
Aershan formation (K1a) was composed of coarse detrital sedimentary formed in stage of strongly pulling apart The rocks of the lower Tegeer formation are pebbled sandstone, or siltstones with mudstone, while the upper’s are mud-stones. The rocks of Saihan formation are sandstones intercalated by mudstones, lignite or pebbly mudstones with sandstones and the sandstones of this forma-tion provided the room of uranium ore-bodies. The rocks of the lower Erlian formation are sandy conglomerates, sandstone or mudstone and so on, while the upper’s are mudstones.
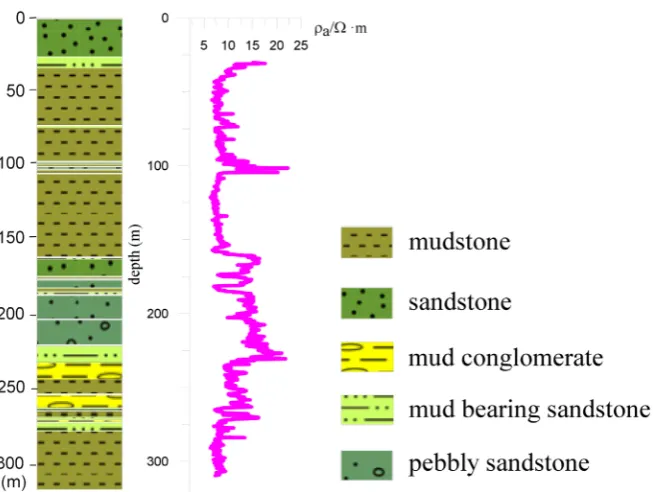
2.2. Resistivity Well-Logging Curve
There is the borehole E14-7 at a distance 9200 m on the profile, and its well log-ging resistivity curve and lithological column are plotted in Figure 3. For simple and convenient purposes, here only part of the profile is discussed from 8000 m to 9800 m. In Figure 3, the resistivity values of the sandstones are little more than that of the mudstones from the depth 165 m to 230 m, although resistivity values of the well logging curve are very lower especially at the depths from 30 m to 165 m and below 275 m only approximately 8 Ω·m. At the depths where the resistivity curve varies steeply such as about 180 m, 230 m and 275 m there gen-erally exit pebbled sandstone, or siltstones with mudstone.
3. AMT Data Acquiring and Processing
[image:4.595.212.539.459.705.2]A 27-km long YC profile in NNW direction (Figure 2) was recorded in 2014
with V8 multi-function receiver the AMTC-30 induction coils of Phoenix Geo-physics Limited.
The AMT station space is 100 meters and the electrode spacing is 50 meters with tensor layout using non polarized electrodes. Little human interference is conducive to AMT data recording. In order to further improve data quality, each station’s data were recorded for over 25 minutes.
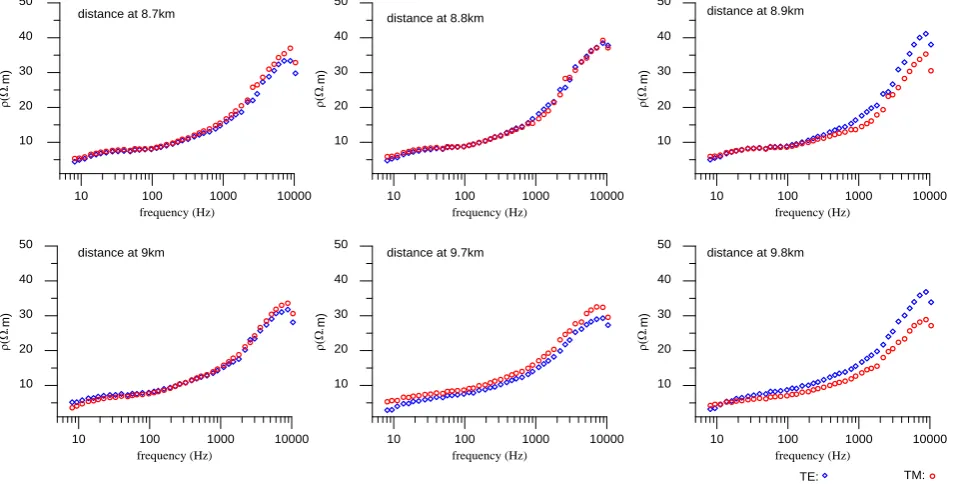
The first step to process the AMT data is to convert each station’s time serial data to the frequency domain before calculating the cross power spectrum. Then, the estimation of each station’s impedance is followed by seeking a cor-responding resistivity model which also satisfies a specified regularization func-tion through inversion. The time serial data stacked by long time recording pro-vide plenty of geo-electric field information. The impedance of each station is estimated through the robust method by TSP program’s kernel [4]. Sample data curves of apparent resistivity of the profile are showed in Figure 4. These curves are descending with frequency decrease and are very smooth for most stations. Fortunately, the “dead frequency band [5]” shows very weakly here. In Figure 4, due to the small resistivity value differences between TE and TM and the similar shapes of the TE and TM, it’s inferred that the surveying area is mainly one-di- mensional and the inverting AMT with 2D technique can meet the demand. The resistivity values estimated from AMT data are less than 20 ohm-meters for most stations and their various range is within several ohm-meters among the whole frequencies. The lithology descried above agrees with the characteristics of these resistivity curves.
4. 2D Inversion
[image:5.595.60.538.472.714.2]Developed by Randy Mackie, Inversion software (WinGLink®) finds regularized
Figure 4. Sample of the observed apparent resistivity curves.
10 100 1000 10000
frequency (Hz) 10 20 30 40 50 ρ(Ω. m)
10 100 1000 10000
frequency (Hz) 10 20 30 40 50 ρ(Ω. m)
10 100 1000 10000
frequency (Hz) 10 20 30 40 50 ρ(Ω. m)
10 100 1000 10000
frequency (Hz) 10 20 30 40 50 ρ(Ω. m)
10 100 1000 10000
frequency (Hz) 10 20 30 40 50 ρ(Ω. m)
10 100 1000 10000
frequency (Hz) 10 20 30 40 50 ρ(Ω. m)
distance at 8.7km distance at 8.8km distance at 8.9km
distance at 9km distance at 9.7km distance at 9.8km
solutions (Tikhonov Regularization) to the two-dimensional inverse problem for magnetotelluric data using the method of nonlinear conjugate gradients (Wil-liam, etc., 2001) [6]. The forward model simulations are computed using finite difference equations generated by network analogs to Maxwell’s equations (Swift and JR., 1971) [7]. The program inverts for a 2D rectangular mesh of resistivity blocks, extending laterally and downwards beyond the central detailed zone, and incorporating topography (WinGLink® User’s Guide) [8]. The shallow meshes are of the same height, and from certain depth the mesh’s heightens with some spreading proportional factor.
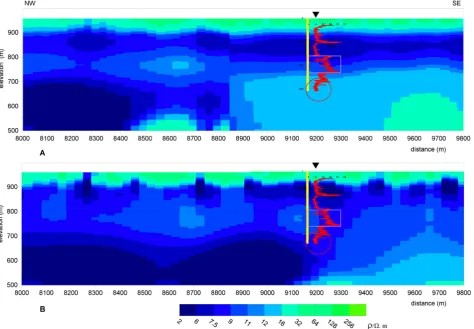
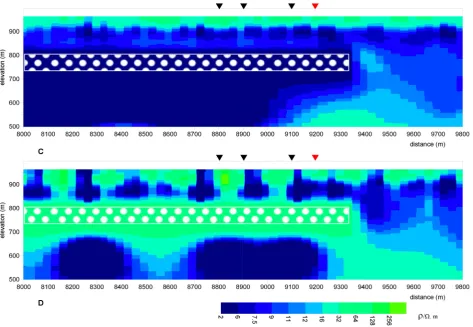
[image:6.595.64.539.373.702.2]There is a difference between the inverted geo-electrical model (Figure 5(A)) and the well-logging curve near the E14-7 borehole at the depth between 165 m and 230 m although the inversion misfit is less than 5% and the observed resis-tivity curves are similar with the response of the inverted model (Figure 7). Be-cause of the coherence relationship between electrical anomaly and the model used in the inversion, a coarse mesh may integrate the anomaly parts and the host in one cell, which result in mixing their differences especially within very small contrast of this example. The paper solved this problem by compiling the characteristics of AMT data and WinGLink software. First, getting a generally underground resistivity distribution with the inverted coarse model produced by
WinGLink. Then, projecting this resistivity distribution to a fine mesh produced from a coded program and inverting it. The thinking of this program is similar to the route of producing a fine mesh of the WinGLink software. However, there are significant differences between them especially at the algorithm. The height or width of a cell can be set respectively, and there are no more adding elements beyond the maximum detecting depth calculated from the whole data. Trial and error approach is used to balance total element number and model scale, while ensuring that cells are kept sufficiently fine for accurate numerical calculation. By inverting YC profile AMT data with a new model produced by this method, a new geo-electrical model was obtained in the Figure 5(B) with 5%. of the inver-sion misfit.
There is a resistivity layer near the depths from 165 m to 275 m in Figure 5(B), which generally agrees with the well logging curve resistivity anomaly part at the same depth range where the curve’s resistivity values are only several ohmmeters higher than the top and the below. In order to check whether this anomaly layer exists, two ways of constraining the area of the anomaly inver-sions were used. One, model C in Figure 6, is set with lower resistivity values than that of model B (Figure 5); the other is the higher one as model D in
Fig-ure 6. The response of the inverted constrained models and no-constrained
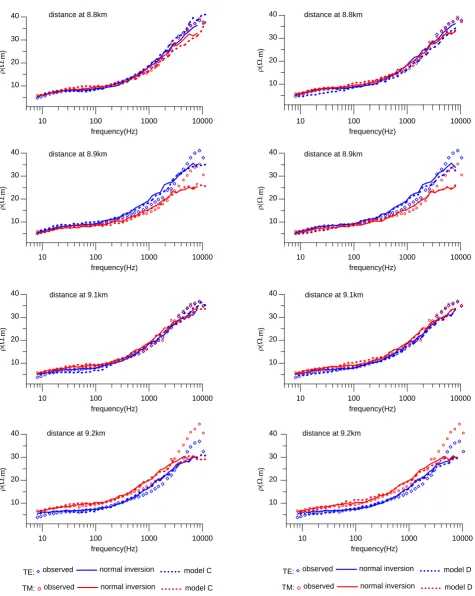
[image:7.595.62.536.379.706.2]model and observed curves are plotted near the borehole E14-7 as Figure 7.
Figure 7. Response resistivity curves (part) of the different models inverted.
There is a clear bias between the constrained model and unconstrained model from the observed curves. There is a resistivity anomaly layer exiting at the depths from 165 m to 275 m near the borehole indeed.
10 100 1000 10000
frequency(Hz) 10 20 30 40 ρ(Ω. m)
10 100 1000 10000
frequency(Hz) 10 20 30 40 ρ(Ω. m)
10 100 1000 10000
frequency(Hz) 10 20 30 40 ρ(Ω. m)
10 100 1000 10000
frequency(Hz) 10 20 30 40 ρ(Ω. m)
10 100 1000 10000
frequency(Hz) 10 20 30 40 ρ(Ω. m)
10 100 1000 10000
frequency(Hz) 10 20 30 40 ρ(Ω. m)
10 100 1000 10000
frequency(Hz) 10 20 30 40 ρ(Ω. m)
10 100 1000 10000
frequency(Hz) 10 20 30 40 ρ(Ω. m) normal inversion
observed model C
normal inversion
observed model C
TE:
TM:
normal inversion
observed model D
normal inversion
observed model D
TE:
TM: distance at 8.8km
distance at 8.9km
distance at 9.1km
distance at 9.2km distance at 9.2km
5. Conclusions
Studying key sandstone body’s shape is a key task for exploring the leachable sandstone type uranium deposits, for the sandstone body is the room where the ore may exist. Many sandstone bodies are surrounded by the conductive mud-stone layers, which add the difficulty in exploring such sandmud-stone bodies. Espe-cially, the low resistivity contrast adds the difficulty in imaging such anomaly.
The analysis above shows that the sandstone layer or body (a little higher re-sistivity layer), which agrees with the well logging data and is within the conduc-tive layers, was imaged through adjusting the model’s scale by the identical in-version algorithm. It’s inferred that the different scale the models indeed influ-enced the result of the inversion and adjusting model’s scale to invert data are a key step for AMT data inversion especially in such little contrast environment. So, it’s recommended to calculate more times with two steps to meet such situa-tion. The first step is to invert different scale models, then to check the anoma-lies of each inversion by the above way or the known information. This inver-sion route can defend missing some anomalies hidden in the data, especially for the weak resistivity contrast condition.
References
[1] Wannamaker, P.R., Stodt, J.A. and Rijo, L. (1985) PW2D-Finite Element Program for Solution of Magnetotelluric Responses of Two-Dimensional Earth Resistivity Structure: User Documentation. University of Utah Res. Inst. Rep. ESL-158. [2] Weaver, J.T. (1994) Mathematical Methods for Geo-Electromagnetic Induction:
Research Studies Press Ltd., Taunton, Somerset, England.
[3] Liu W.S., Kang, S.H., Zhao, X.Q, Shi, Q.P. and Zhang, Z.N. (2013) Mineralization Mechanism and Exploration of Paleo-Channel Type Uranium Deposit in Central Erlian Basin. Uranium Geology, 31, 164-175 (in Chinese).
[4] Yao, S.C. (2013) The Development of TSP for STRATAGEM Impedance Estimation Program. Uranium Geology, 29, 99-103 (in Chinese).
[5] Garcia, X. and Jones, A.G. (2002) Atmospheric Sources for Audiomagnetotelluric (AMT) Sounding. Geophysics, 67, 448-458. https://doi.org/10.1190/1.1468604 [6] Rodi, W.L. and Mackie, R.L. (2001). Nonlinear Conjugate Gradients Algorithm for
2-D Magnetotelluric Inversion. Geophysics, 66, 174-187. https://doi.org/10.1190/1.1444893
[7] Charles, M. and Swift, J.R. (1971) Theoretical Magnetotelluric and Turam Response from Two-Dimensional Inhomogeneities. Geopgysics, 36, 38-52.
https://doi.org/10.1190/1.1440162
[8] GEOSYSTEM SRL (2008) WinGLink® User’s Guide. Release 2.20.02.02. Italy.
Submit or recommend next manuscript to SCIRP and we will provide best service for you:
Accepting pre-submission inquiries through Email, Facebook, LinkedIn, Twitter, etc. A wide selection of journals (inclusive of 9 subjects, more than 200 journals)
Providing 24-hour high-quality service User-friendly online submission system Fair and swift peer-review system
Efficient typesetting and proofreading procedure
Display of the result of downloads and visits, as well as the number of cited articles Maximum dissemination of your research work
Submit your manuscript at: http://papersubmission.scirp.org/