RESEARCH ARTICLE
A STUDY OF ANTHROPOMETRIC VARIABLES ON GROWTH AND NUTRITIONAL STATUS OF
RURAL ADOLESCENT SCHOOL GIRLS IN PASCHIM MEDINIPUR, WEST BENGAL
Soumyajit Maiti
1,3, Kausik Chatterjee
1, Kazi Monjur Ali
1, Tushar Kanti Bera
1, Debidas
Ghosh*
1,2,3and Shyamapada Paul
2,31Department of Bio‐Medical Laboratory Science and Management (U.G.C Innovative Department), Vidyasagar
University, Midnapore – 721 102, West Bengal, India.
2Nutrition & Dietetics Unit, Department of Bio‐Medical Laboratory Science and Management, Vidyasagar
University, Midnapore – 721 102, West Bengal, India.
3Rural Research Institute of Physiology & Applied Nutrition (RRIPAN), ‘Gitanjali’, Dr. Nilay Paul Road,
Midnapore – 721 101, Paschim Medinipur, West Bengal, India.
ARTICLE INFO ABSTRACT
Objective
An attempt has been made in this study to evaluate the growth and nutritional status among early adolescent school girls (age group of 10 to 14 years) of Dantan-II Block, Paschim Medinipur district, West Bengal.
Methods
A cross sectional study was carried out in rural adolescent school girls of 18 government-approved upper primary schools of Dantan-II Block, Paschim Medinipur district, West Bengal. Anthropometric and socio-demographic information from 3693 adolescent girls were collected during 2009-2010 academic session. Height and weight were measured using standard procedure and the body mass index (BMI) was calculated. BMI was compared to 2007 WHO growth reference. Height- for-age (HAZ), weight-for-age (WAZ) and BMI-for-age (BMIZ) were used to evaluate stunting, underweight and thinness respectively, based on the National Centre of Heath Statistics (NCHS) < - 2 Z score values. Classification of severity of malnutrition was done based on WHO recommendation.
Results
Mean BMI-for-age were less than those of 2007 WHO growth reference for girls at all ages. The overall rate of stunting, underweight and thinness was 33.13%, 28.06% and 17.92% respectively. Based on WHO classification of severity of malnutrition, the overall prevalence of stunting was high (30-39%), whereas those of underweight (≥ 30) and thinness (≥ 15) were very high.
Conclusion
The study shows that poor health and nutritional status among the adolescents indicating a major public health problem. An intensive and comprehensive approach is required to improve the nutritional status of rural adolescent girls.
© Copy Right, IJCR, 2011, Academic Journals. All rights reserved
INTRODUCTION
Nutritional problem of adolescent girls are common throughout the developing countries. The state of rural adolescent girls in India is quite dismal (Malhotra and Jain, 2007; Choudhary et al., 2009). They have to encounter a series of serious nutritional challenges not only affecting their growth and development but also their livelihood as adults (Malhotra and Jain, 2007).
*Corresponding author: debidasghosh60@gmail.com
Adolescent remain largely neglected, especially girls from a deprived section in our society. Adolescent girls form an important vulnerable segment of population and constitute about one tenth of Indian population (Malhotra and Jain, 2007;
Kalhan et al., 2010; Goyle, 2009). It is not surprising that
adolescent girl population who are “mother to be” is consider as the most important section on which the future of nation depends (Measham and Chatterjee, 2000; Rao, 2001). Nutritional status of adolescent is an essential component of a country’s overall human development. Their current nutritional status will decide the well being of the present as well as the future generations but often receive scant attention
ISSN: 0975-833X
International Journal of Current Research
Vol. 3, Issue, 7, pp.036-040, July, 2011
INTERNATIONAL JOURNAL OF CURRENT RESEARCH
Article History:
Received 15th
April, 2011 Received in revised form 7th
June, 2011
Accepted 19th
July, 2011
Published online 16th
July, 2011
Key words:
(Venkaiah et al., 2002). In other words, earlier age of adolescent provides a second opportunity for girls to attain ‘catch up growth’ and break the intergenerational cycle of malnutrition provided there is a significant increase in their nutrient intake (Rao, 2001). It is a dynamic period of growth and development as children undergo physical, mental, emotional and social changes during this stage. Malnutrition leads not only to stunting of physical growth but also to suboptimal intellectual development (Kishore, 2005). Under-nutrition among these girls is associated with reduced lean body mass, lack of muscular strength and decreased work capacity. Poor nutrition among adolescents resulting in short stature and low lean body mass is associated with many
concurrent and future adverse health outcomes (Dambhare et
al., 2010; WHO, 1995). Moreover, the poor nutritional status of girls has important implication in terms of physical work capacity and adverse reproductive outcome (WHO, 1995). In this concern, school setting provides an ideal platform to detect the health problems early and treat them.
In the light of the above, the assessment of nutritional status plays a vital role. To assess the nutritional status of an individual or population, anthropometry is widely recognized as one of the useful techniques because it is highly sensitive to detect undernutrition. Three commonly used indicators of undernutrition among children are stunting (low height-for-age), thinness (low body mass index-for-age) and that of being underweight (low weight-for-age). Stunting is an indicator of chronic undernutrition, the result of prolonged food deprivation and/or disease or illness; thinness is an indicator of acute undernutrition, the result of more recent food deprivation or illness; underweight is used as a composite indicator to reflect both acute and chronic undernutrition, although it cannot distinguish between them (WHO, 1995).
There is very little information about nutritional status of adolescents school girls, particularly from rural areas in India (Venkaiah et al., 2002). Therefore, there is a need to develop a database on the nutritional status of the adolescent girls from different parts of the country to enable the governments and other nongovernmental agencies to formulate policies and initiate strategies for the well-being of adolescent. In this respect, an attempt has been made to assess the current nutritional status of the school going early adolescent girls using the anthropometric variable from Dantan-II block of Paschim Medinipur district, West Bengal, which mainly represents rural sectors.
MATERIALS AND METHODS
Study Setting
This cross sectional study was undertaken at Dantan-II block, Paschim Medinipur district, West Bengal. The study area is situated at the 216 km from Kolkata, the provincial capital of West Bengal. The area is mostly remote and comprised of eighteen government-approved upper primary schools. All school girls studying in classes V to VIII were included in the study of the Dantan-II block. A total of 4143 girls (10 to 14 years old) were enrolled during the 2009-10 academic session at these schools, among them 3693 (89.13%) were examined in the present study. The girls came from Hindu, Muslim and
Tribal communities of the villages. The recorded parameters were age, height and weight.
Age determination
Age of the girls was ascertained from the school registers and subsequently confirmed by parents of the girls. The age of the child was recorded in complete years.
Anthropometric Measurements
Anthropometric variables were considered in accordance with standard techniques and procedures (Lohman et al., 1988).
Height
Height in centimeters was marked on a wall with the help of a measuring tape. All girls were measured against the wall. They were asked to remove their foot wear and to stand with heels together and their heads were positioned in such manner so that the line of vision was perpendicular to the body. A glass scale was brought down to the topmost point on the head. The height was recorded to the nearest1 cm.
Weight
A bathroom scale was used. It was calibrated against known weights regularly. The zero error was checked for and removed if present, every day. The clothes of the girls were not removed as adequate privacy was not available. Their weight was recorded to the nearest 500 grams. Technical errors of measurement (TEM) were calculated and they were found to be within reference values (Ulijaszek and Kerr, 1999). To avoid variability among the data collectors, the same measurers were employed for a given anthropometric measurement.
The body mass index (BMI) was computed following the standard formula:
BMI (kg/m 2) = Weight (kg) / Height(m 2).
Assessment of Nutritional Status
Three commonly used undernutrition indicators, i.e., underweight, stunting and thinness were used to evaluate the nutritional status of the subjects. The age and sex specific -2 Z-scores of the National Centre for Health Statistics (NCHS)
(Hamill et al., 1979; WHO, 1983), were followed to define
underweight, stunting and thinness.
Z-scores were calculated following the standard formula:
X – Median of NCHS Z-score =
Standard deviation of NCHS
Where X is an individual value
The following scheme was utilized:
The WHO (WHO, 1995)classification (Table 1) was followed for assessing the severity of malnutrition by the percentage prevalence ranges of these three indicators among children.
Statistical Analysis
All statistical analyses were performed using the Statistical Package for Social Sciences (SPSS, Version 7.5.1, 1996).
Ethical Consideration
Appropriate ethical permission for human studies was obtained from all concerned authorities before commencement of the study. School authorities consent was also obtained prior to the conduction of the study by focusing the nature and purpose of the said work.
RESULTS
Profile of the participants
The total 3693 rural adolescents girls of age groups 10 to 14 years (Mean age: 12) were studied. The age wise distributions of the study sample are presented in table-2, 24.34 % were in the age of 10 years, 20.87% were in age of 11 years followed 20.76 % by in the age of 12 years. As many as 23.77% subjects were in age of 13. They were predominantly Hindu (91.17%) and nearly 13.24% of them belonged to the scheduled castes/scheduled tribes or other backward classes (23.72%). Majority (58.10%) of the subjects were from the families engaged in agriculture and 23.76% were engaged in labour (Table 2). The means and standard deviations of the anthropometric characteristics by age groups of the adolescents’ girls are presented in table-3. There was a positive increasing trend in mean weight of subject between 10 to 14 years of age. Similar age trend were observed for height. Mean BMI increased progressively in all age group. The age specific mean BMI-for-age for the study girls were also compared to the 2007 WHO reference population. The mean
BMI-for-age of the study girls was below the 10th percentile of
the reference until they reached 12 years of age. However, the mean BMI-for-age for the adolescents older than 12 years of
age was above the 10th percentile but below the 25th percentile
of the 2007 WHO reference (Fig 1).
12 13 14 15 16 17 18 19 20 21 22
10 11 12 13 14
Age in years
BMI
,
Kg
/m
2
Study
Median WHO 2007
10thp WHO 2007
[image:3.612.315.553.154.273.2]25thp WHO 2007
Fig. 1. Comparison of mean BMI-for-age of the study and 2007 WHO reference populations (n=3693)
Table 4 presents the mean z-scores for height-for-age, weight- for-age and BMI-for-age of the adolescent girls. The mean (SD) WAZ, HAZ and BMIZ were 1.48 (0.2), 1.56 (0.2) and -1.23 (0.03) respectively. These values ranged from -1.6 (WAZ of aged 11 years) to -1.1 (WAZ of aged 10 years). Results revealed that the mean (SD) HAZ, WAZ and BMIZ were less than (negative value) NCHS for all ages. Table 5 reveals the
prevalence of underweight, stunting and thinness of rural
adolescents school girls. The overall rate of undernutrition was 33.13%, while stunting was 28.06% and 17.92 % thinness was respectively. The rate of undernutrition progressively increased from 10 to 14 with the advancement of age. A slight
Table 1. WHO classification of severity of malnutrition
Severity of malnutrition
Low (%)
Medium (%)
High
(%) Very High (%)
Underweight <10 10-19 20-29 Equal or >30
Stunting <20 20-29 30-39 Equal or >40
Thinness <5 5-9 10-14 Equal or >15
Table 2. Socio-economic and demographic profile of the participants (N=3693)
Characteristics No. % Characteristics No. %
Age (in year) Religion
10 899 24.34 Hindu 3367 91.17
11 771 20.87 Muslim 326 8.83
12 767 20.76 Caste
13 878 23.77 SC/ST 489 13.24
14 378 10.23 OBC 876 23.72
Total 3693 Family occupation
Class Agriculture 2146 58.10
V 982 26.59 Labour 874 23.67
VI 925 25.04 Service 103 2.79
VII 913 24.72 Business 487 13.19
VIII 873 23.63 Others 83 2.25
Table 3. Age-wise anthropometric variables of rural adolescents school girls
Age N Height (cm)
Mean ± SD
Weight (Kg) Mean ± SD
BMI (kg/m 2
) Mean ± SD
10 899 130.63 ± 8.1 24.43 ± 4.45 14.27 ± 1.89
11 771 136.56 ± 8.65 27.59 ± 5.33 14.88 ± 2.07
12 767 139.52 ±9.14 30.25 ± 5.56 15.51±2.49
13 878 143.66 ± 8.5 33.83 ± 5.56 16.37±2.21
14 378 145.47 ± 6.07 35.68 ± 6.01 16.79 ± 2.21
Table 4. Mean WAZ, HAZ and BMIZ of rural adolescent school girls
Age (year) WAZ HAZ BMIZ
10 -1.1 [1.3] -1.24 [1.27] - 0.8 [0.7]
11 -1.6 [1] -1.27 [1.3] - 1.1 [1.0]
12 -1.6 [0.8] -1.7 [1.33] - 1.24 [1.2])
13 -1.6 [0.7] -1.8 [1.2] - 1.22 [1.0]
14 -1.5 [0.8] -1.8 [1.2] - 1.25 [1.14]
Total -1.48 [0.2] -1.56 [0.2] -1.23 [0.03]
[image:3.612.351.514.516.596.2]WAZ: Z-score for weight-for-age; HAZ: Z-score for height-for-age; BMIZ: Z-score for BMI-for-age
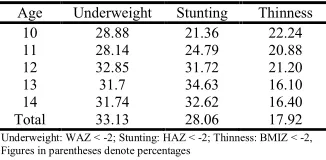
Table 5. Prevalence of underweight, stunting and thinness of rural adolescents’ school girls
Age Underweight Stunting Thinness
10 28.88 21.36 22.24
11 28.14 24.79 20.88
12 32.85 31.72 21.20
13 31.7 34.63 16.10
14 31.74 32.62 16.40
Total 33.13 28.06 17.92
[image:3.612.69.294.550.709.2]decline in the rate of underweight from 13 to 14 years of age. The rate of stunting were increased considerably among girls. Based on WHO classification of severity of malnutrition, the overall prevalence of stunting was high (30-39%), whereas those of underweight (≥30) and thinness (≥15) were very high.
DISCUSSION
The poor nutritional status during early adolescence girls is an important determinant of health outcomes and it remains uninterrupted throughout their adolescent life. Undernutrition
is documented public health problem contributing
substantially to children’s survival (Dambhare et al., 2010).
Regardless of the scientific reports, high rates under-nutrition at earlier age of adolescence has been reported in rural sectors
(Anand et al., 1999; Agrawal et al., 2001). There are no
previous studies that characterize the nutritional status of adolescent girls from the study communities. To the best of our knowledge, this is the first report on anthropometric assessment of early adolescent girls from rural poor sector of West Bengal as all the samples represent the weaker strata, showed overall poor nutritional status.
The mean BMI-for-age of the present study at all ages were found to be much inferior when compared to median reference data recommended by WHO 2007. Moreover, the apparent increase in the mean height, weight and BMI-for-age at later years of adolescence (Fig. 1) might be a sign of improved growth to correct childhood deficits (Table 2). The mean height of the adolescents of the present study was higher but the mean weight and mean BMI of the adolescents were lower
than those reported by Mukhopadhyay et al. (2005), among
urban adolescents of Kolkata.
In the present study, the overall age combined prevalence of underweight, stunting and thinness were 33.13%, 28.06% and 17.92% respectively. Adolescent girls belonging to 12-14 years were maximally prevalent by stunting and underweight. Thinness is more prevalent in the age group of 10-12 years old. This could be because of the growth spurt and sudden increase in height in this age group. Consistent with the findings of other studies (Rao, 2001; Agrawal et al., 2001), the prevalence of thinness and stunting increased with increase in age. Venkaiah et al. (2002) had reported that about a quarter of the adolescent girls had short stature and 18.6% were under weight. About 39% of the adolescents were stunted (< median - 2 SD of NCHS height for age) irrespective of age. A cross-sectional study was conducted on adolescent girls in West Bengal, where overall prevalence of ‘thinness’ and ‘stunting’ was found to be 14.7% and 37.8%, respectively (Das and Biswas, 2005). It was found to be slight lower in the present study being 33.13% for stunting. The results of the present study clearly indicated that the nutritional situation of these adolescent was serious with high rates of thinness of 17.92%. The prevalence of thinness is more in Indian adolescent girls
at rural areas (Choudhary et al., 2009; Kalhan et al., 2010;
Bose et al., 2008).
According to the WHO classification of severity of malnutrition, the overall prevalence of underweight was high, whereas those of stunting and thinness were very high. The rates of underweight were much higher than that reported from
other study (Bose et al., 2008). This is substantiated by the
fact that stunting, which is considered as index of chronic or long term duration of undernutrition, was observed during the entire period of adolescence. A noteworthy point was that majority of the girls come from weaker section of our community. The relatively high prevalence of undernutrition observed among school girls located in the rural areas may be due to the inadequate dietary intake of food (Ghosh and Paul, 1991). The fact that most of these children are from presents of low socio-economic background mainly farmers, who themselves attended poor nutrition. Alongside, adolescent girls are the worst sufferers of the ravages of various forms of malnutrition because of their increased nutritional needs and
low social power (Choudhary et al., 2009).. Other explanation
for low nutritional of school children status may be due to their lack of awareness, to prevent nutritional diseases through
locally available low cost food (Maiti et al., 2010). Such
factors affect the nutritional status of adolescent girls among study subject.
Therefore, the school going adolescent girls, in their existing nutritional status are in great need of health promotion, health appraisal and health restoration. To overcome the nutritional problems and improvement their health status it becomes necessary to have exact information about the prevalence of under nutrition among adolescent girls in rural sectors, so that appropriate preventive steps may be taken.
CONCLUSION
In conclusion, this study provides evidence that the average adolescents school girls of Dantan-II block are under acute and chronic nutritional stress. It also indicates that an intensive and comprehensive approaches are required immediately specially at rural sectors. This is important to public health policy-makers, planners and organizations should implicated appropriate strategy for improvement of adolescent as well as community health care.
ACKNOWLEDGEMENT
The study was supported by Indian Red Cross Society (Paschim Medinipur district branch). We are gratefully acknowledged to Mr. N. S. Nigam, District Magistrate cum District Project Officer of Sarva Siskha Mission, Paschim Medinipur district for granting permission to carry out the
study. Special thanks to authorities of Midnapore
Homeopathic Medical College & Hospital and various schools authorities of Dantan-II block for their heartiest cooperation. All subjects who participated in the study are gratefully acknowledged.
REFERENCES
Agrawal, KN., Saxena, A., Bansal, AK. and Agarwal, DK.
2001. Physical growth assessment in adolescents. Ind.
Pediatr., 38: 1217-1235.
Anand, K., Kant, S. and Kapoor, SK. 1999. Nutritional status
of adolescent school children in rural north India. Ind.
Pediatr., 36: 810-815.
Choudhary, S., Mishra, CP. and Shukla, KP. 2009. Correlates of nutritional status of adolescent girls in the rural area of Varanasi. Int. J of Nutr. & Wellness, 7(2).
Dambhare, DG., Bharambe, MS., Mehendale, AM. and Garg, BS. 2010. Nutritional status and morbidity among school
going adolescents in Wardha, a peri-urban area. Online J
Health Allied Scs., 9(2):3.
Das, DK. and Biswas, R. 2005. Nutritional status of adolescent girls in a rural area of North 24 Parganas district, West Bengal. Ind. J. Pub. Health, 49(1): 18-21.
Ghosh, B. and Paul, SP. 1991. Studies on the growth and nutritional status of the rural children of primary age group of Kharagpur. Ind. J. Physiol & Allied Sci., 45(3):145-155. Goyle, A. 2009. Nutritional status of girls studying in a
government school in Jaipur city as determined by
anthropometry.Anthropologist, 11(3): 225-227.
Hamill, PV., Drizd, TA., Johnson, CL., et al. 1979. Physical
growth: national center for health statistics percentiles. Am. J. Clin. Nutr., 32: 607-29.
Kalhan, M., Vashisht, BM., Kumar, V. and Sharma, S. 2010. Nutritional status of adolescent girls of rural Haryana. Int. J. Epidemiol., 8 (1).
Kishore, J. 2005. National Health Programs of India. 5th ed.pg. 53-54.
Lohman, TG., Roche, AF. and Martorell, R. 1988.
Anthropometric standardization reference manual.
Chicago: Human kinetics books, p:3‐80.
Maiti, S., Ali, KM., Dash, SS. and Ghosh, D. 2010. Impact of
‘child-to-family’ strategy for health awareness
improvement at rural sectors of Paschim Medinipur district, West Bengal. Online J Health Allied Sci., 9(2):2.
Malhotra, A. and Jain, P. 2007. A Diet quality and nutritional status of rural adolescent girl beneficiaries of ICDS in north India. Asia Pac. J. Clin. Nutr.,16 (Suppl 1):8-16. Measham, AR. and Chatterjee, M. 2000. Wasting away- the
crisis of malnutrition in India: The World Bank.
Mukhopadhyay, A., Bhadra, M., and Bose, K. 2005. Anthropometric assessment of nutritional status of
adolescent of Kolkata, West Bengal. J. Human Ecol.,
18:213-216
Rao, S. 2001. Nutritional status of Indian population. J.
Biosci., 26:481-489.
Ulijaszek, SJ. and Kerr, DA. 1999. Anthropometric measurement error and the assessment of nutritional status. Brit. J. Nutr., 82(3):165-77.
Venkaiah, K., Damayanti, K., Nayak, MU. and
Vijayaraghavan, K. 2002. Diet and nutritional status of
rural adolescents in India. Eur. J. Clin. Nutr., 56: 1119–
1125.
World Health Organization. 1983. Measuring change in nutritional status. Geneva: World Health Organization. World Health Organization. 1995. Physical Status: the use and
interpretation of anthropometry: Technical report series no. 854. Geneva: World Health Organization.
World Health Organization. 1998. Nutritional status of adolescent girls and women of reproductive age. Report of regional consultation Geneva, World Health Organization. SEA'NUT'141: 3.