STUDY OF TEMPERATURE AND HUMIDITY DISTRIBUTION IN AN SIMPLE HOUSE
SITUATED IN COSTAL AREAS BY TAKING HUMIDITY INTO CONSIDERATION WITH THE
TECHIQUE OF CFD ANALYSIS
3*
Rakesh, P.,
1Dasaradhi,
1V.R.Siddhartha Engineering College, Ka 2Department of Mechanical Engineering, V.R.
3*CAD/CAE Trainer At
ARTICLE INFO ABSTRACT
For the people to stay comfortable in their houses suitable environment should be provided. experts agree
Therefore
comfort and good health for the
that to in south India usually women performs all the works in the house
usually filled by devices that generate a lot of heat which makes a person uncomfortable and if the house is near a coastal region the humidity &
effects the
and pressure distribution in a typical house hold kitchen by taking the most important factor ca Humidity into consideration which many people leave.
Copyright © 2014 Rakesh et al. This is an open access article distributed under the Creative Commons Attribution License, which permits unrestricted use,
distribution, and reproduction in any medium, provided the original work is properly cited.
INTRODUCTION
In India the climatic conditions are much diversified as like its cultural diversity but generally it is very hot for most of the time in the year and that the temperatures are high in south India. And also most of the coastal area is present in south India where the humidity effect is very high
all-Generally in summer season the humidity is high in the coastal areas than other seasons and what we started to do is to study temperature distribution and pressure distribution in a house hold kitchen and the house is present in a coastal area vey near to the beach. Using this as a basic answer many studies can be performed to effectively lower the humidity and temperatures with a very cost effective solution because a middle class house hold person can’t bear the burden of installing and maintenance of climate control system or an air conditioning system.
METHODS
Generally in order to predict the distribution of the temperatures as well as pressures we use the method called “CFD – Computational Fluid Dynamics” which is one of the computing method in which we generally use the technique of
*Corresponding author: Rakesh, P.
CAD/CAE Trainer At E.C.C India (P) Ltd, Ameer-pet, Hyderabad
ISSN: 0975-833X
International Journal of Current Research
Vol. 6, Issue, 09, pp.8446
Article History: Received 21st
June, 2014 Received in revised form 06th
July, 2014 Accepted 10th
August, 2014 Published online 18th
September,2014
Key words: Humidity Effect,
Temperature & Pressure Distribution, Solid works Flow Simulation.
REVIEW ARTICLE
STUDY OF TEMPERATURE AND HUMIDITY DISTRIBUTION IN AN SIMPLE HOUSE
SITUATED IN COSTAL AREAS BY TAKING HUMIDITY INTO CONSIDERATION WITH THE
TECHIQUE OF CFD ANALYSIS
Dasaradhi, G. S. V. S. and
2Ravi Kumar, K.
V.R.Siddhartha Engineering College, Kanuru, Vijayawada-07, A.P, India of Mechanical Engineering, V.R. Siddhartha Engineering College, Vijayawada
CAD/CAE Trainer At E.C.C India (P) Ltd, Ameer-pet, Hyderabad
ABSTRACT
For the people to stay comfortable in their houses suitable environment should be provided. experts agree on the fact that relative humidity affects Thermal comfort and health of human beings.
there should be temperature and relative humidity control system to achieve thermal comfort and good health for the persons inside the room, for comfortable living.
that to in south India usually women performs all the works in the house
usually filled by devices that generate a lot of heat which makes a person uncomfortable and if the house is near a coastal region the humidity & temperature make a worst combination which drastically effects the condition for work and as well as health. So in this work we tried to predict the temperature
pressure distribution in a typical house hold kitchen by taking the most important factor ca Humidity into consideration which many people leave.
is an open access article distributed under the Creative Commons Attribution License, which permits unrestricted use, medium, provided the original work is properly cited.
In India the climatic conditions are much diversified as like its cultural diversity but generally it is very hot for most of the time in the year and that the temperatures are high in south India. And also most of the coastal area is present in south –
-round the year. rally in summer season the humidity is high in the coastal areas than other seasons and what we started to do is to study temperature distribution and pressure distribution in a house-hold kitchen and the house is present in a coastal area vey near
beach. Using this as a basic answer many studies can be performed to effectively lower the humidity and temperatures with a very cost effective solution because a middle class house hold person can’t bear the burden of installing and maintenance
control system or an air conditioning system.
Generally in order to predict the distribution of the temperatures as well as pressures we use the method called Computational Fluid Dynamics” which is one of the computing method in which we generally use the technique of
pet, Hyderabad
finite volume method to predict the behavior of the fluids. Here the theory is from the fluid mechanics which is study about behavior of the fluids. Here in this study we considered t city of “Visakhapatnam” as the city of our choice because there the relative humidity is high generally all
especially very high during the summer and rainy seasons. designed our room along with all the other equipment such as stove, fridge or refrigerator and some furniture such as alamaras…etc. using a very powerful modelling software called Solid works premium and also used the same software for the flow analysis by using the module called solid works flow simulation. First we did the flow analysis by not taking the relative humidity into consideration and found all the distributions of temperature, pressure and then we have taken the relative humidity into account and did the analysis and there was a considerable change.
Work
We have chosen Visakhapatnam as our city of choice as it is fulfilling all the conditions we want to perform in this study and we obtained the meteorology report from the respective authorities of the city and we studied that usual wind ranges all over the year and also the relative humidity levels that are critical for our study. We found out that general wind speeds range from 2knts – 6knts. So we made an average and we tested the situation by taking 2knts as the lowest wind speed
International Journal of Current Research
Vol. 6, Issue, 09, pp.8446-8451, September,2014
INTERNATIONAL
OF CURRENT RESEARCH
STUDY OF TEMPERATURE AND HUMIDITY DISTRIBUTION IN AN SIMPLE HOUSE-HOLD
SITUATED IN COSTAL AREAS BY TAKING HUMIDITY INTO CONSIDERATION WITH THE
07, A.P, India
lege, Vijayawada-07, A.P, India
For the people to stay comfortable in their houses suitable environment should be provided. The Thermal comfort and health of human beings. temperature and relative humidity control system to achieve thermal for comfortable living. Typically in India that to in south India usually women performs all the works in the house-hold kitchens which are usually filled by devices that generate a lot of heat which makes a person uncomfortable and if the make a worst combination which drastically . So in this work we tried to predict the temperature pressure distribution in a typical house hold kitchen by taking the most important factor called
is an open access article distributed under the Creative Commons Attribution License, which permits unrestricted use,
finite volume method to predict the behavior of the fluids. Here the theory is from the fluid mechanics which is study about Here in this study we considered the port city of “Visakhapatnam” as the city of our choice because there the relative humidity is high generally all-round the year and especially very high during the summer and rainy seasons. We designed our room along with all the other equipment such as a stove, fridge or refrigerator and some furniture such as alamaras…etc. using a very powerful modelling software called Solid works premium and also used the same software for the flow analysis by using the module called solid works t we did the flow analysis by not taking the relative humidity into consideration and found all the distributions of temperature, pressure and then we have taken the relative humidity into account and did the analysis and
We have chosen Visakhapatnam as our city of choice as it is fulfilling all the conditions we want to perform in this study and we obtained the meteorology report from the respective authorities of the city and we studied that usual wind ranges all year and also the relative humidity levels that are critical for our study. We found out that general wind speeds 6knts. So we made an average and we tested the situation by taking 2knts as the lowest wind speed
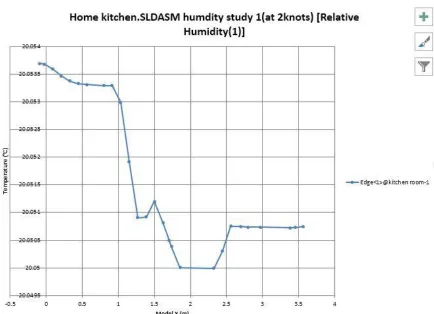
Fig.1. distribution of relative humidity values along the room (x-axis) at 2knts wind flow
.
[image:2.612.92.526.386.700.2]Fig.3. distribution of pressure values along the room (x-axis) at 2knts wind flow
CASE-2(4 Knots Wind Flow):
Fig.5. distribution of temperature values along the room (x-axis) at 4knts wind flow
CASE-3(6 Knots Wind Flow):
Fig.7. distribution of relative humidity values along the room (x-axis) at 6knts wind flow
and 4knts being the average wind speed and 6knts being the highest wind speed. We designed the furniture, a stove which is emitting heat energy and a fridge or an refrigerator and we put an window through which thw outside air that is carrying the humidity as well as the temperature enters and we also have taken a door condition through which the room temperature as well as the room pressure comes in contact with the other rooms and the tests were carried out at room temperature as well as room pressure and we found out the temperature and pressure distributions are as following which are depicted in the graphs shown below. We did the simulations as mentioned above for the three cases by taking normal wind flow of 2 knots which is usual and medium wind flow of 4 knots and fast wind flow of 6 knots. The respective graphs are given below: CASE-1(2 Knots Wind Flow):
Conclusion
The experts agree on the fact that relative humidity affects Thermal comfort and health of human beings. Therefore there should be temperature and relative humidity control system to achieve thermal comfort and good health for the persons inside the room, for comfortable living. By observing the above graphs we can predict the distribution of the important factors that are important for a comfortable living.
REFERENCES
A Study and Development of Temperature and Relative Humidity Control System in Hospital Buildings in Thailand by Thammanoon Sookchaiya et. al.
Exergy analysis of different solutions for humidity control in heritage buildings M. Molinari, T. Broström.
A Supervisory Control System for Temperature and Humidity in a Closed House Model for Broilers by Alimuddin, Kudang Boro Seminar, I Dewa Made Subrata, Sumiati, Nakao Nomura.
Air Conditioning Psychometrics by A. Bhatia.
The Relationship between Upslope Flow and Relative Humidity by Stephen Jaye.
Displacement ventilation for room air moisture control in hot and humid climate by Risto Kosonen
A study on humidity distribution in a room by Atsushi IWAMAE.
High Accuracy Acoustic Relative Humidity Measurement in
Duct Flow with Air by Wilhelm van Schaik et al.
Controlling Indoor Humidity Using Variable Speed
Compressors and Blowers by M. A. Andrade and C. W. Bullard