Single Dose Effects of Pascoflair
®
on Current Source
Density (CSD) of Human EEG
*
Wilfried Dimpfel1#, Klaus Koch2, Gabriele Weiss3
1Justus-Liebig-University c/o NeuroCode AG, Wetzlar, Germany; 2NeuroCode AG, Wetzlar, Germany; 3Pascoe Pharmazeutische
Präparate GmbH, Giessen, Germany.
Email: {#w.dimpfel, info}@neurocode-ag.com, [email protected]
Received February 10th, 2012; revised March 19th, 2012; accepted April 20th, 2012
ABSTRACT
Pascoflair® 425 mg is a herbal drug based on Passiflora incarnata dry extract and is registered in different countries for
the treatment of nervous restlessness and anxiety and also as an aid to sleep. The study was initiated for the quantitative assessment of the effect of this preparation on brain electric activity and cognition in human volunteers. Quantitative electroencephalographic current source density (CSD) from 16 healthy male and female human volunteers (average age 49 years) was used in a randomized, placebo-controlled crossover study. Data were taken 0.5, 1.5, 3 and 4 hours after administration of the preparations under the conditions of 6 minutes eyes open, 5 minutes d2 concentration test, mathe- matical calculation test and memory test respectively. During mental load, changes in spectral band power were used to analyse drug-induced effects. All variables were fed into a linear discriminant analysis (LDA) for comparison with other drug profiles. Spectral power in the delta and theta range was significantly attenuated at 3 and 4 hours after ad- ministration in comparison with the time-dependent increase normally observed due to circadian rhythm. Discriminant analysis revealed a difference to placebo for all recordings as early as 30 minutes after intake of 3 coated tablets of Pascoflair® 425 mg. Using LDA data location within the poly-dimensional space, verum was projected into the area of
the effects of Gingko/Ginseng as reference drugs tested earlier under identical conditions. Psychometric performance was not disrupted. Pascoflair® 425 mg can be regarded as a well characterized plant-derived drug with anxiolytic and
calming properties without negative sedative and cognition-attenuating side effects. Current results document the effec- tiveness of the preparation as early as after 30 minutes. In addition, they indicate persistence of good mental perform- ance for hours. Trial registration: the study has been registered at ClinicalTrials.gov under NCT01047605.
Keywords: Passion Flower; EEG; Clinical Study; Source Density; Discriminant Analysis
1. Introduction
Many extracts from different species of the genus pas- sionflower have been tested pharmacologically in ani- mals, mainly looking for anxiolytic and calming effects
1-3. Due to a large number of potentially active ingre- dients such as C-glycosylflavonoids 4, a single mecha- nism of action cannot be expected. However, there is some evidence that the neurotransmitter GABA (γ-amino butyric acid) could be involved in the action 5, espe- cially since binding studies attributed the affinity of Pas- siflora incarnata L. to GABA A and GABA B receptors. Passiflora incarnata L. could be identified as an antago- nist of the GABA B receptor. In contrast the ethanol- and benzodiazepine site of GABA A receptors were not af- fected by this extract 6.
In addition, there have been reported differences in anxiolytic and sedative properties with respect to extract origin or dosage. For example, anxiolytic effects in mice have been recorded in the presence of extracts manufac- tured from Passiflora edulis “edulis”, whereas sedative effects were seen in the presence of extracts made from
Passiflora edulis “flavicarpa” 7. On the other hand, anxiolytic and sedative effects have been reported to be dose-dependent 8. This means that each preparation to be marketed has to be tested on its own for proof of effi- cacy at the recommended dosage.
The aim of the present investigation is the clinical test- ing of Pascoflair® 425 mg, registered in different coun-
tries for the treatment of nervous restlessness and anxiety and also as an aid to sleep (in cases of restlessness or in- somnia due to mental stress).
This drug contains a special dry extract from Passi- flora incarnata. Two major questions were addressed. The first is the question as to whether a single intake was
*Competing interests: The authors declare that they have no competing
interests.
able to show an effect during the next four hours after adiminstration of the preparation. For this purpose the most sensitive methodology of recording electric brain activity from the human scalp was used. Secondly, men-tal performance was assessed concomitantly with the EEG recording, since experiments in rats had shown that Passiflora extracts induced anxiolytic effects without dis- rupting memory processes 9. Finally, a comparison with the electric profile of other drugs acting on the hu- man brain should give further indications for its clinical use.
2. Methods
2.1. Subjects
Sixteen healthy volunteers (8 males, (48.7 ± 7) years old and 8 females, (47 ± 8) years old) were recruited by ad- vertisement and participated in this study. They under- went a medical examination before entering the trial. Sub- jects reporting neurological disturbances of the central nervous system were excluded from the study. Subjects with a history of drug or ethanol abuse or participation in another study within the last six months were also ex-cluded. It was ensured that they were not on alcohol. On the day of examination, no beverages containing caffeine were allowed within the last 12 hours preceding the EEG recording. The study was carried out according to the Helsinki 2000 declaration 10 on human rights, and was approved by the local ethics committee of the Hessen State Medical Association (Frankfurt, Germany) and gov-ernment authorities (BfArM, Bonn, Germany). All sub-jects received detailed information about the aims of the study and gave their written informed consent to partici-pate. Each subject was randomly allocated either to the functionally active preparation or to placebo within a crossover design with an interval between experimental of at least 1 week.
2.2. EEG Recording
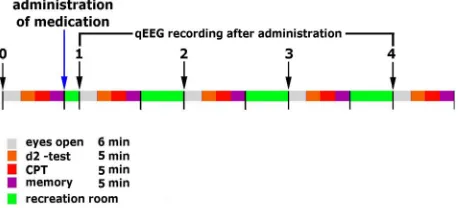
Subjects sat alone in a quiet separate room in a comfort- able easy chair. The light was dimmed. Baseline recording of 6 minutes under the condition of eyes open was fol-lowed by performance of three cognitive tests: a concen-tration test (d2-test) 11, a mathematical calculation test (according to 12) and a memory test, consisting of the presentation of a row of letters and numbers that ap-peared on a screen for 4 seconds followed by 10 seconds of black screen. This was followed by a multiple choice test with four possible answers.
All recordings were repeated 0.5, 1.5, 3 and 4 hours after the administration of three tablets following the reference pre-drug period (overview in Figure 1). Be-
tween assessments, subjects spent their time in the facil-
ity’s break room. All experiments took place at the same time of the day (starting at 8 a.m.).
The EEG was recorded bipolary from 17 surface elec-trodes according to the international 10/20 system with Cz as physical reference electrode for calculation of the common average reference 13 (Computer aided topog- raphical electroencephalometry: CATEEM®—from Me-
wicon GmbH, 4164Schwarzenberg, Austria) using an electrocap. The raw signals were amplified, digitalized (2048 Hz/12 bit) and transmitted to the computer via fibre optical devices. The automatic artefact rejection of the CATEEM®-System, which eradicates EEG-altera-
tions caused by eye blinks, swallowing, respiration etc. during the recording was visually controlled and indi- vidually adjusted by the investigator. Electrocardiogram (ECG) and electrooculogram (EOG) were recorded on one channel each in order to facilitate detection of those signals superposed onto the EEG. The artefact rejection set-up was observed for about 5 minutes prior to the start of the recording to ensure that all artefacts were correctly recognized and eliminated from further evaluation. For safety purposes, the original raw data were saved on op- tical disk and separate hard disks in order to allow re- evaluation of the artefact rejection mode if necessary. In these cases, the experimental session was re-examined off-line with a newly adapted rejection mode. The amount of rejected data was determined automatically and given as a percentage of total recording time. In addition, the entire recording and the computer-based automatic arte-fact rejection were continuously supervised and adjusted by a trained technician 14. Logarithm of data was taken for discriminant analysis in order to approach normal distribution of values, which underwent frequency analy-sis for quantitative evaluation as first proposed nearly 80 years ago 15.
In this study, the EEG was computed not in the poten- tial mode measured as voltage, but in a surface charge mode obtained by Laplacian estimates also known as current source density (CSD) analysis 16. The charge is the 2nd derivative of the potential and gives the spatial curvature of the potential. All calculations are based on the standard set-up of the 10/20 system of recording. Under the condition of using a homogenous, steadily
[image:2.595.310.539.616.720.2]conducting medium, the surface charge mode provides the source density of the electrical flow on the cortex surface. Whereas the EEG in the potential mode tends to produce a more extensive and diffuse picture of changes, the Laplacian estimate acts as a spatial filter emphasizing local sources over distant sources. Others 17 were able to demonstrate that spectral parameters obtained from the CSD showed higher correlations with computer tomo- graphy data than those calculated from the potential mode of the EEG. We therefore used this methodology in order to describe the focal changes in brain activity. The signals from all 17 electrode positions underwent the Fast Fourier Transformation (FFT) based on 4-second sweeps of data epochs (Hanning window). Data were analysed from 0.86 to 35 Hz using the CATEEM® soft-
ware. In this software, the resulting frequency spectra are divided into six frequency bands: delta (1.25 - 4.50 Hz), theta (4.75 - 6.75 Hz), alpha1 (7.00 - 9.50 Hz), alpha2 (9.75 - 12.50 Hz), beta1 (12.75 - 18.50 Hz) and beta2 (18.75 - 35.00 Hz). This frequency analysis is based on absolute spectral power values. Band powers are first compared between placebo and verum during relaxation, and the results of verum and placebo then compared un- der different mental loads.
2.3. Statistics
EEG data from the first recording session before drug intake are given as absolute figures (μV2). By setting the
absolute electric power of this first pre-drug recording to 100%, changes produced by the preparations are given as percentage of this pre-drug condition. Except for gener- ating brain maps, only those particular electrode posi- tions were used for the numeric comparison of verum to placebo during mental load, which have been found to change during the particular mental challenge. For ex- plorative statistical evaluation, the nonparametric sign test was used. For mathematical classification of drug effects, linear discriminant analysis according to Fischer was used. Results from the first three discriminant func- tions were projected into space (x, y and z coordinates), whereas results from the fourth to sixth discriminant functions were coded into red, green and blue respec- tively. Values on the 4th to 6th linear discriminant func- tions respectively determine the amount of red, green and blue in additive colour mixtures analogous to the RGB mode of TV. Reference preparations used for comparison were tested in our laboratory earlier under identical con- ditions. A linear projection was defined by taking these reference data. Data sets from other preparations to be analysed are processed according to the originally de- fined mapping function of reference compounds.
Psychometric performance was evaluated by the mathe- matical product of “quantity × quality”, where quantity
was defined as the number of correct answers and quality as the number of correct answers divided by the number of tasks tackled.
2.4. Preparation
Pascoflair® 425 mg is a coated tablet containing dry ex-
tract (5 - 7:1) of Passiflora incarnata L. (Passionflower) 425 mg, extractant: ethanol 50% (V/V). Pascoflair® 425
mg is registered in different countries for the treatment of nervous restlessness and anxiety and also as an aid to sleep (in cases of restlessness or insomnia due to mental stress).
Pascoflair® 425 mg is marketed by Pascoe pharmazeu-
tische Präparate GmbH, Giessen, Germany. The verum preparation consisted of the maximum daily dosage of 3 coated tablets of Pascoflair® 425 mg.
3. Results
3.1. Analysis of Single Frequency Ranges during Relaxation
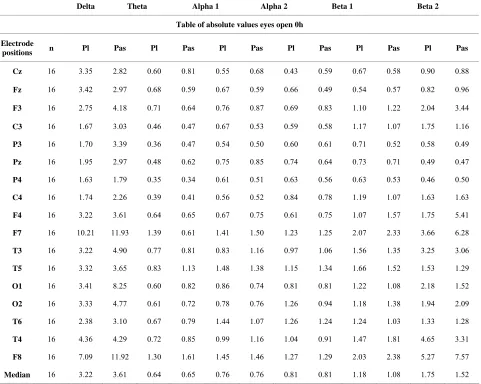
Source density analysis of the primary recording of the reference EEG before drug administration revealed simi- lar absolute spectral power values for the day of placebo administration (Pl) compared with the day of active drug administration (Pas) for all electrode positions as docu- mented in Table 1. These data were taken as the baseline;
all other data after drug intake refer to this reference re- cording of the particular experimental day and are ex- pressed as % of these pre-drug data. After ingestion of 3 coated tablets of Pascoflair® 425 mg, some differences
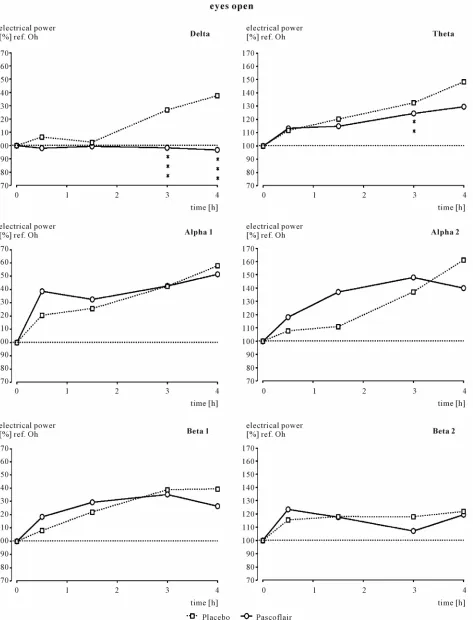
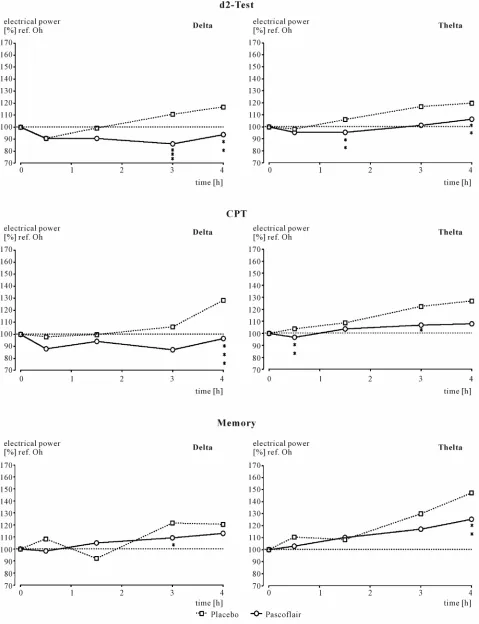
were recognized with respect to spectral power values after Fast Fourier Transformation in comparison to the pre-drug values, when the median was calculated for all electrode positions. The greatest differences between verum and placebo were seen with respect of the diurnal increases of delta and additionally to a lesser degree of theta spectral power. In the presence of verum, the in-crease in delta power as normally observed was com-pletely attenuated as documented in Figure 2. This
dif-ference was highly statistically significant (p < 0.02) at 3 and 4 hours after administration. Theta spectral power also was attenuated at 3 and 4 hours after ingestion. Sta-tistical significance, however, was less pronounced at 3 hours (p < 0.08). In addition, there was some increase of alpha2 spectral power which did not reach statistical sig-nificance.
3.2. Analysis of Spectral Power during Mental Performance
Table 1. Absolute EEG spectral power.
[image:4.595.58.539.106.490.2]Delta Theta Alpha 1 Alpha 2 Beta 1 Beta 2
Table of absolute values eyes open 0h
Electrode
positions n Pl Pas Pl Pas Pl Pas Pl Pas Pl Pas Pl Pas
Cz 16 3.35 2.82 0.60 0.81 0.55 0.68 0.43 0.59 0.67 0.58 0.90 0.88
Fz 16 3.42 2.97 0.68 0.59 0.67 0.59 0.66 0.49 0.54 0.57 0.82 0.96
F3 16 2.75 4.18 0.71 0.64 0.76 0.87 0.69 0.83 1.10 1.22 2.04 3.44
C3 16 1.67 3.03 0.46 0.47 0.67 0.53 0.59 0.58 1.17 1.07 1.75 1.16
P3 16 1.70 3.39 0.36 0.47 0.54 0.50 0.60 0.61 0.71 0.52 0.58 0.49
Pz 16 1.95 2.97 0.48 0.62 0.75 0.85 0.74 0.64 0.73 0.71 0.49 0.47
P4 16 1.63 1.79 0.35 0.34 0.61 0.51 0.63 0.56 0.63 0.53 0.46 0.50
C4 16 1.74 2.26 0.39 0.41 0.56 0.52 0.84 0.78 1.19 1.07 1.63 1.63
F4 16 3.22 3.61 0.64 0.65 0.67 0.75 0.61 0.75 1.07 1.57 1.75 5.41
F7 16 10.21 11.93 1.39 0.61 1.41 1.50 1.23 1.25 2.07 2.33 3.66 6.28
T3 16 3.22 4.90 0.77 0.81 0.83 1.16 0.97 1.06 1.56 1.35 3.25 3.06
T5 16 3.32 3.65 0.83 1.13 1.48 1.38 1.15 1.34 1.66 1.52 1.53 1.29
O1 16 3.41 8.25 0.60 0.82 0.86 0.74 0.81 0.81 1.22 1.08 2.18 1.52
O2 16 3.33 4.77 0.61 0.72 0.78 0.76 1.26 0.94 1.18 1.38 1.94 2.09
T6 16 2.38 3.10 0.67 0.79 1.44 1.07 1.26 1.24 1.24 1.03 1.33 1.28
T4 16 4.36 4.29 0.72 0.85 0.99 1.16 1.04 0.91 1.47 1.81 4.65 3.31
F8 16 7.09 11.92 1.30 1.61 1.45 1.46 1.27 1.29 2.03 2.38 5.27 7.57
Median 16 3.22 3.61 0.64 0.65 0.76 0.76 0.81 0.81 1.18 1.08 1.75 1.52
Spectral power values of the pre-drug conditions for placebo (Pl) and verum (Pas) for six frequency ranges (delta-beta2) for each single electrode position (labelled according to the 10 - 20 system). F = frontal, C = central, P = parietal, T = temporal, 0 = occipital. Even numbers represent the right hemisphere, un-even number represent the left hemisphere.
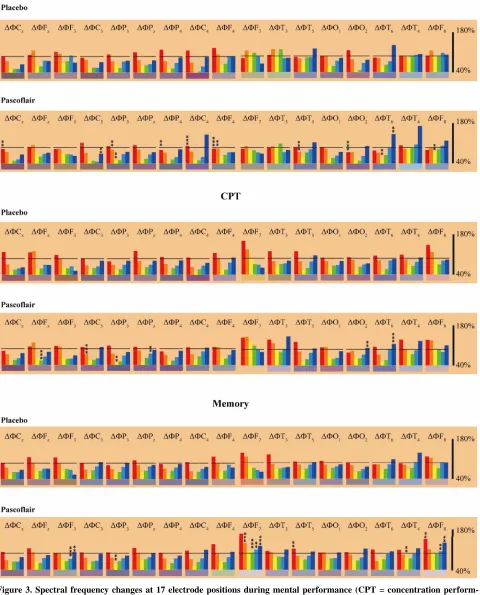
increased to some degree during all three mental chal- lenges. The greatest differences between placebo and Pascoflair® 425 mg were observed during the perform-
ance of the memory test. Here not only beta but also delta and theta activity was enhanced. There are some more statistically significant changes to spectral power with regard to single frequency changes in comparison to placebo, but statistical analysis of the different locations is not Bonferroni-corrected for multiple comparisons. With regard to median values of all electrode positions, EEG analysis revealed a statistically significant attenua- tion of delta and theta power. During performance of the d2-test, significant attenuation of delta power took place 3 and 4 hours after ingestion (Figure 4). Attenuation of
theta power was significant at 1.5 and 4 hours after in- gestion, alpha2 power at 3 hours. During the concentra- tion-performance test (CPT), delta and to some degree
also theta power was attenuated with regard to the medi- ans of all electrode positions. This effect was strongest at 3 and 4 hours after intake of the active preparation as shown in Figure 5. Attenuation of the other frequencies
was not statistically significant (not shown). However, there was a highly significant enhancement of alpha2 power after only 30 minutes (p < 0.02). During perform- ance of the memory test, less theta and alpha1 spectral power was produced in the presence of verum in com- parison to placebo with regard to the median of all elec- trode positions. Statistical significance was reached for theta at 4 hours after intake and for alpha1 after 3 hours (not shown). Changes with respect to the other frequen- cies were not consistent and only reached statistical sig- nificance for beta1 at 3 hours after administration (not shown).
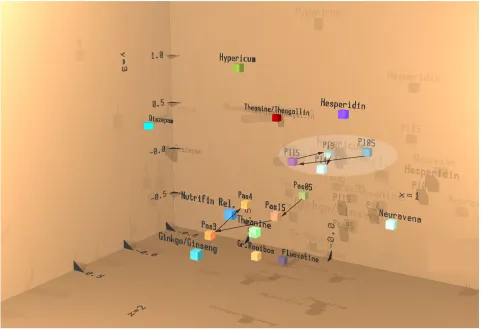
Figure 5. Depiction of the result of linear discriminant analysis of EEG source density data for all four recording periods after administration of verum and placebo. Result from the first three discriminant functions is displayed by means of space coordinates x, y and z. Values of the 4th to 6th linear discriminant functions respectively determine the amount of red, green and blue in additive colour mixtures analogous to the RGB mode of TV.
difference between placebo and verum (Table 2). nata extract in mice 18. It is possible that the use of
Pascoflair® 425 mg might eventually be used in an add-
on therapy for epileptic patients. But this interpretation must remain speculative until supported by data from further clinical tests.
4. Discussion
This experimental series showed that the preparation Pascoflair® 425 mg already modulated electric brain ac-
tivity after a single acute intake compared to placebo. Spectral power in the delta and theta range was attenu- ated in comparison with the time-dependent increase normally observed due to circadian rhythm. The median value calculated from all electrode positions indicated a statistically significant attenuation of spectral power 3 and 4 hours after administration. The meaning of this preparation-dependent effect is not absolutely clear, es- pecially since it was observed under nearly every re- cording condition. It can possibly be interpreted as a kind of stabilization of electric activity which might make brain activity more resistant to external disturbances. Focal pathological increases of delta and theta power are regularly observed in patients suffering from epilepsy. In fact, there is one report in the literature describing anti- convulsive effects of the aerial parts of Passiflora incar-
Since it is quite difficult to evaluate the data from 17 electrode positions in the presence of 6 frequency ranges (a total of 102 parameters), the mathematical tool of dis- criminant analysis was used to describe the action of the active drug compared to placebo for the recording condi- tion “eyes open”. This method permits the time-depen- dent evaluation of all changes with respect to the pre- drug condition. As can be seen in Figure 5, all placebo
values (labelled PL05 to PL4)—representing circadian rhythm dependent changes—are clustered. Depiction of the result of the effect of verum at 0.5, 1.5, 3 and 4 hours after administration in comparison to the effect of other synthetic reference drugs or plant-derived preparations tested earlier revealed clear effects for the active drug after only 30 minutes (labelled Pas05, Pas15, Pas3 and Pas4 in Figure 5). This early effect of Pascoflair® 425
Table 2. Result of psychometric procedures during d2-test.
d2-test CPT Memory
results
Placebo Pascoflair Placebo Pascoflair Placebo Pascoflair
Mean 12.32 12.81 6.57 6.43 10.77 11.15
SD 4.02 3.25 6.17 6.01 3.98 2.81
0 h
SEM 1.07 0.87 1.61 1.54 1.06 0.72
Mean 13.67 13.18 5.32 6.51 10.95 11.32
SD 3.82 3.21 4.57 5.69 4.10 3.03
0.5 h
SEM 1.02 0.86 1.20 1.49 1.10 0.81
Mean 13.62 13.72 6.55 5.99 10.68 11.29
SD 4.22 3.15 5.98 5.16 4.46 3.51
1.5 h
SEM 1.12 0.84 1.58 1.36 1.19 0.94
Mean 13.35 13.19 5.93 6.41 11.11 11.16
SD 3.95 3.39 5.33 5.19 4.38 3.82
3 h
SEM 1.05 0.91 1.41 1.38 1.07 1.01
Mean 13.59 13.86 6.87 6.85 11.51 11.17
SD 3.77 3.36 7.30 5.74 3.74 3.67
4 h
SEM 1.01 0.89 1.93 1.53 0.99 0.97
extract tested in 60 ambulatory surgery patients. In a placebo-controlled, double-blind study, preoperative anxi- ety scores after only 30 minutes were significantly lower in the Passiflora group than in the control group 19.
In the past, discriminant analysis of spectral power was successfully used to differentiate drug profiles from each other in rats according to their clinical indication
20. Drugs with a similar clinical indication clustered together whereas drugs with different indications were widely diverse in space and colour. The same reasoning can be followed in showing that Pascoflair® 425 mg took
position near some other drugs with well-known clinical indications. One of the closest neighbours in space (rep- resenting the result of the first to third discriminant func- tion)—but with a different colour due to the result of the fourth to sixth discriminant function—is L-Theanine. In- terestingly, L-Theanine is regarded as a compound with relaxing properties and is reported to reduce psychology- cal and physiological stress responses 21. At the same time, possible neuroprotective and cognitive enhancing properties are also reported 22. Another neighbour not too far away is a preparation consisting of Gingko and Ginseng extract 23.
Interestingly, there was obviously no negative influ- ence on mental activity, since psychometric performance
remained stable throughout the whole experimental pe- riod. On the contrary, during performance of the memory test, increases of delta, theta and beta power at frontal electrode positions indicative of good mental fitness were observed. This frontal increase of delta and theta power during mental load was not observed in demented people
24 and subjects suffering from mild cognitive impair- ment 25. Presumably, the great scatter of psychometric results from only 16 volunteers prevented more insight into effects on memory function in the presence of Pas- coflair® 425 mg.
5. Conclusion
In summary, Pascoflair® 425 mg was shown to produce a
benzodiazepines, this study did not reveal any such nega- tive side effects for Pascoflair® 425 mg.
6. Acknowledgements
Petra Werling is gratefully acknowledged for taking the EEG recordings. We thank Leonie Schombert for her help in documenting the results. We appreciate the help of Bianka Krick in critically reviewing the manuscript. Ingrid Keplinger-Dimpfel performed the logistics and quality control of the study.
7. Authors’ Contributions
W.D. provided the electrophysiological technology, su- pervised the performance of the experiments, gave inter- pretation of the results and wrote the manuscript. K.K. performed the medical examinations and evaluated un- expected events. G.W. initiated the study and made ma- jor contributions to the design. She also provided impor- tant information on the pharmacology of the prepara- tion’s constituents.
REFERENCES
[1] P. C. De Castro, A. Hoshino, J. C. da Silva and F. R. Mendes, “Possible Anxiolytic Effect of Two Extracts of Passiflora Quadrangularis L. in Experimental Models,”
Phytotherapy Research, Vol. 21, No. 5, 2007, pp. 481-
484. doi:10.1002/ptr.2079
[2] O. Grundmann, C. Wählig, C. Staiger and V. Butterweck, “Anxiolytic Effects of a Passionflower (Passiflora incar- nate L.) Extract in the Elevated Plus Maze in Mice,” Die
Pharmazie, Vol. 64, No. 1, 2009, pp. 63-64.
[3] C. Sampath, M. Holbik, L. Krenn and V. Butterweck, “Anxiolytic Effects of Fractions Obtained from Passi-
flora incarnate L. in the Elevated Plus Maze in Mice,”
Phytotherapy Research, Vol. 25, No. 6, 2010, pp. 789-
795. doi:10.1002/ptr.3332
[4] L. M. Sena, S. M. Zucolotto, F. H. Reginatto, E. P. Schen- kel and T. C. De Lima, “Neuropharmacolgical Activity of the Pericarp of Passiflora edulisflavicarpa Degener: Pu- tative Involvement of C-gylcosylflavonoids,” Experimental
Biology and Medicine, Vol. 234, No. 8, 2009, pp. 967-
975. doi:10.3181/0902-RM-84
[5] O. Grundmann, J. Wang, G. P. McGregor and V. Butter- weck, “Anxiolytic Activity of a Phytochemically Charac- terized Passiflora incarnate Extract is Mediated Via the GABAergic System,” Planta Medica, Vol. 74, No. 15, 2008, pp. 1769-1773. doi:10.1055/s-0028-1088322 [6] K. Appel, T. Rose, B. Fiebich, T. Kammler, C. Hoffmann
and G. Weiss, “Modulation of the γ-Amino butyric Acid (GABA) Aystem by Passiflora incarnate L.,” Phytother-
apy Research, Vol. 25, No. 6, 2010, pp. 838-843.
[7] H. Li, P. Zhou, Y. Shen, L. Li and D. Zhao, “Compara- tive Studies on Anxiolytic Activities and Flavonoid Com- positions of Passiflora edulis ‘edulis’ and Passiflora
edulis ‘flavicarpa’,” Journal of Ethnopharmacology, Vol.
133, No. 3, 2011, pp. 1085-1090. doi:10.1016/j.jep.2010.11.039
[8] J. Deng, Y. Zhou, M. Bai, H. Li and L. Li, “Anxiolytic and Sedative Activities of Passiflora edulis f. flavicarpa,”
Journal of Ethnopharmacology, Vol. 128, No. 1, 2010, pp.
148-153. doi:10.1016/j.jep.2009.12.043
[9] P. R. Barbosa, S. S. Valvassori, C. L. Bordignon Jr., V. D. Kappel, M. R. Martins, E. C. Gavioli, J. Quevedo and F. H. Regianatto, “The Aqueous Extracts of Passiflora Alata
and Passiflora edulis Reduce Anxiety-Related Behaviors
without Affecting Memory Process in Rats,” Journal of
Medicinal Food, Vol. 11, No. 2, 2008, pp. 282-288.
[10] World Medical Association, “Ethical Principles for Medi- cal Research Involving Human Subjects,” Cambridge University Press, Cambridge, 2000.
[11] D2-Test, “Aufmerksamkeits-Belastungs-Test, Rolf Bricken- kamp,” Hogrefe Verlag, Göttingen, 1994.
[12] H. Düker and G. A. Lienert, “Der Konzentrations-Lei- stungstest (KLT),” Hogrefe Verlag, Göttingen, 1965. [13] D. Lehmann, “Principles of Spatial Analysis,” In: A. S.
Gevins and A. Remond, Eds., Handbook of Electroe-
ncephalography and Clinical Neurophysiology: Methods
of Analysis of Brain and Magnetic Signals, Elsevier, Am-
sterdam, 1987, pp. 309-354.
[14] F. Schober and W. Dimpfel, “Relation between Psycho- metric Tests and Quantitative Topographic EEG in Phar- macology,” International Journal of Clinical Pharma-
cology, Therapy and Toxicology, Vol. 30, No. 11, 1992,
pp. 428-430.
[15] G. Dietsch and H. Berger, “Fourier Analyse von Elektro- enzephalogrammen des Menschen,” Pflüger’s Arch, Vol. 230, 1932, pp. 106-112.
[16] T. Harmony, A. Fernandez-Bouzas, E. Marosi, T. Fer- nandez, J. Bernal, M. Rodriguez, A. Reyes, J. Silva, M. Alonso and G. Casian, “Correlation between Computed Tomography and Voltage and Current Source Density Spectral Parameters in Patient with Brain Lesions,” Elec-
troencephalography and Clinical Neurophysiology, Vol.
87, No. 4, 1993, pp. 196-205. doi:10.1016/0013-4694(93)90019-R
[17] P. Benfield, R. C. Heel and S. P. Lewis, “Fluoxetine: A Review of Its Pharmacodynamics and Pharmacokinetic Properties, and Therapeutic Efficacy in Depressive Ill- ness,” Drugs, Vol. 32, No. 6, 1986, pp. 481-508. [18] M. Nassiri-Asl, S. Shariati-Rad and F. Zamansoltani,
“Anticonvulsive Effects of Aerial Parts of Passiflora In- carnate Extract in Mice: Involvement of Benzodiazepine and Opioid Receptors,” BMC Complementary and Alter-
native Medicine, Vol. 7, No. 26, 2007, pp. 26-32.
doi:10.1186/1472-6882-7-26
[19] A. Movafegh, R. Alizadeh, F. Hajimohamadi, F. Esfehani and M. Nejatgar, “Preoperative Oral PassifloraIincarnate Reduces Anxiety in Ambulatory Surgery Patients: A Double Blind, Placebo-Controlled Study,” Anesthesia &
Analgesia, Vol. 106, No. 6, 2008, pp. 1728-1732.
[20] W. Dimpfel, “Preclinical Data Base of Pharmaco-Specific Rat EEG Fingerprints (Tele-Stereo-EEG),” European
199-207.
[21] K. Kimura, M. Ozeki, L. R. Juneja and A. Ohira, “L- Theanine Reduces Psychological and Physiological Stress Responses,”Biological Psychology, Vol. 74, No. 1, 2007, pp. 39-45. doi:10.1016/j.biopsycho.2006.06.006
[22] P. J. Nathan, K. Lu, M. Gray and C. Oliver, “The Neuro- pharmacology of L-Theanine (N-Ethyl-L-Glutamine): A Possible Neuroprotective and Cognitive Enhancing Agent,”
Journal of Herbal Pharmacotherapy, Vol. 6, No. 2, 2006,
pp. 21-30.
[23] W. Dimpfel, A. Kler, E. Kriesl and R. Lehnfeld, “Neuro- physiological Characterization of Functionally Active Drink Containing Extracts of Ginkgo and Ginseng by
Source Density Analysis of the Human EEG,” Nutritional
Neuroscience, Vol. 9, No. 5-6, 2006, pp. 213-224.
[24] R. Schellenberg, A. Todorova, W. Dimpfel and F. Schober, “Pathophysiology and Psychopharmacology of Demen- tia—A New Study Design. I. Diagnosis Comprising Sub- jective and Objective Criteria,” Neuropsychobiology, Vol. 32, No. 2, 1995, pp. 81-97