IMPACT OF FINANCIAL DISTRESS ON FINANCIAL PERFORMANCE
TO PAKISTANI CORPORATE SECTOR
*Arzish Shaukat and Hina Affandi
Department of Business and Economics
ARTICLE INFO ABSTRACT
The research is intended to investigate the association b/w financial distress and financial performance. The sample companies selected are 15 and the study period is six years from 2007 2012. The study performed on non
selected from Fuel and Energy sector. The Altman’s Zscore model is used for diagnosing the financial health of the companies and then impact of financial distress is measured on financial performance. The study shows that there exist
financial performance. The outcomes of the research also exhibit that financial performance of companies increase with rise in Z score values and with decrease in financial distress.
Copyright © 2015 Arzish Shaukat and Hina Affandi. This
unrestricted use, distribution, and reproduction in any medium, provided the original work is properly cited.
INTRODUCTION
Financial distress prediction is very important for the companies in this era of globalization. Financial distress could lead a company to bankruptcy if not handled timely.
way (2001) describes financial distress as a situation when a
company is unable to meet its financial obligations. Financial distress diagnosis is very important for long term survival of the firms. Garman et al. (2004) describe financial distress as an extreme physical or mental stress that includes concerns and fears about financial issues. Goudie (1987) indicates that there are many microeconomic factors of financial distress some of those are mismanagement, high cost and ineffective sales strategy which can lead a firm towards the financial distress. However macroeconomic factors like economic condition, security condition, Government decisions etc. also contribute towards firm distress. It is the one of the difficult
companies to maintain a required level of financial performance during an era of financial distress. If the financial distress is not diagnosed earlier it could be result in the winding up of company in the future. The study will determine t financial distress effect on financial performance with relevance to Fuel and Energy sector of Pakistan.
performance of the companies is usually accessed by measuring the financial ratios. Earlier researchers used a single variable to measure the financial health and to predict the bankruptcy.
*Corresponding author: Arzish Shaukat,
Department of Business and Economics, Foundation University Rawalpindi Campus, Pakistan.
ISSN: 0975-833X
Vol.
Article History:
Received 21st November, 2014
Received in revised form 09th December, 2014
Accepted 09th January, 2015
Published online 28th February,2015
Key words:
Financial distress, Financial performance, Altman Z score model, Karachi stock exchange.
RESEARCH ARTICLE
IMPACT OF FINANCIAL DISTRESS ON FINANCIAL PERFORMANCE -A STUDY RELATED
TO PAKISTANI CORPORATE SECTOR
Arzish Shaukat and Hina Affandi
Economics, Foundation University Rawalpindi Campus, Pakistan
ABSTRACT
research is intended to investigate the association b/w financial distress and financial performance. The sample companies selected are 15 and the study period is six years from 2007 2012. The study performed on non-financial companies that are listed on
selected from Fuel and Energy sector. The Altman’s Zscore model is used for diagnosing the financial health of the companies and then impact of financial distress is measured on financial performance. The study shows that there exist a significant association between financial distress and financial performance. The outcomes of the research also exhibit that financial performance of companies increase with rise in Z score values and with decrease in financial distress.
This is an open access article distributed under the Creative Commons Att use, distribution, and reproduction in any medium, provided the original work is properly cited.
Financial distress prediction is very important for the companies in this era of globalization. Financial distress could lead a company to bankruptcy if not handled timely. Shum
describes financial distress as a situation when a e to meet its financial obligations. Financial distress diagnosis is very important for long term survival of describe financial distress as an extreme physical or mental stress that includes concerns and indicates that there are many microeconomic factors of financial distress some of and ineffective sales strategy which can lead a firm towards the financial distress. However macroeconomic factors like economic condition, security condition, Government decisions etc. also contribute towards firm distress. It is the one of the difficult tasks for the companies to maintain a required level of financial performance during an era of financial distress. If the financial distress is not diagnosed earlier it could be result in the winding up of company in the future. The study will determine the financial distress effect on financial performance with relevance to Fuel and Energy sector of Pakistan. Financial performance of the companies is usually accessed by Earlier researchers used a single the financial health and to predict the
Department of Business and Economics, Foundation University Rawalpindi
A study done by Beaver (1966)
be effectively predicted by using single variable. Later many researchers found that it is not a suitable approach to use a single variable when measuring the financial health of the company. Altman (1968) developed a model kno
model that uses multiple variables to study the financial distress. Altman Zscore model is used to see the financial health through various angles.
five different ratios in his classic model to measure the financial health of the companies. Altman’s Zscore model is considered the most effective method of measuring the financial distress.
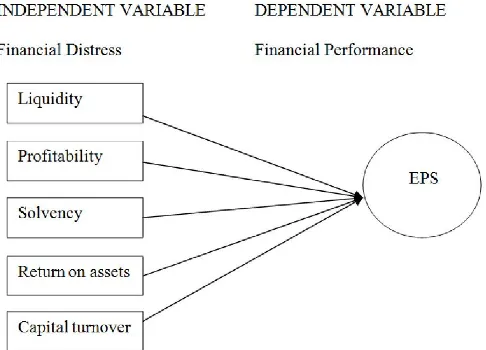
Here in this research the financial health of companies is assessed by measuring multiple financial ratios. The model used includes the financial ratios those are Liquidity, Profitability, return on assets, solvency and capital turnover. The combined impact of these financial ratios on financial performance is studied through Altman Z score model or five factor model. The dependent variable used in this research is earnings per share indicate the financial performance. These are the main ratios that are used to measure the financial health and to diagnose financial distress. Earlier researches illustrate a negative association between financial distress and financial performance. A study done by
financial distress is negatively related with financial performance. Firms with high leverage show
performance during the year. International Journal of Current Research
Vol. 7, Issue, 02, pp.12991-12996, February, 2015
INTERNATIONAL
A STUDY RELATED
Foundation University Rawalpindi Campus, Pakistan
research is intended to investigate the association b/w financial distress and financial performance. The sample companies selected are 15 and the study period is six years from
2007-financial companies that are listed on Karachi stock exchange selected from Fuel and Energy sector. The Altman’s Zscore model is used for diagnosing the financial health of the companies and then impact of financial distress is measured on financial a significant association between financial distress and financial performance. The outcomes of the research also exhibit that financial performance of companies increase with rise in Z score values and with decrease in financial distress.
is an open access article distributed under the Creative Commons Attribution License, which permits
Beaver (1966) shows that bankruptcy could
be effectively predicted by using single variable. Later many researchers found that it is not a suitable approach to use a single variable when measuring the financial health of the developed a model known as Z score model that uses multiple variables to study the financial Zscore model is used to see the financial health through various angles. Altman used a combination of five different ratios in his classic model to measure the al health of the companies. Altman’s Zscore model is considered the most effective method of measuring the
Here in this research the financial health of companies is assessed by measuring multiple financial ratios. The model des the financial ratios those are Liquidity, Profitability, return on assets, solvency and capital turnover. The combined impact of these financial ratios on financial performance is studied through Altman Z score model or five variable used in this research is earnings per share indicate the financial performance. These are the main ratios that are used to measure the financial health and to diagnose financial distress. Earlier researches illustrate a en financial distress and financial performance. A study done by Tan (2012) reveals that the financial distress is negatively related with financial performance. Firms with high leverage show the worst
As the research is focused on Pakistani corporate sector so it will be helpful to know about performance of Pakistani companies during financial distress. The study will contribute in the knowledge area by conducting a new research in Pakistani market and will help the upcoming researchers who want to study the Pakistani corporate sector. Dependent variable used in research is EPS that is different from the previous studies in which stock returns were used as measure of financial performance. This study will be helpful for the executives of the company when they are deciding and analyzing about the financial performance during financial distress.
Literature review
Many researches are performed in the past to study about the financial distress and its association with the financial performance. All of these studies are done by using different models but they are still helpful for our study. Earlier researches involve prediction of bankruptcy by using the single variable. Beaver (1966) showed that bankruptcy could be effectively predicted by using single variable. Bathoray (1984) also studied and evidenced the effective prediction of bankruptcy by using a single variable. Altman (1968) done multivariate analysis and used many important considerations instead of using one variable in predicting bankruptcy. Altman used a multivariate framework in which he used five different kinds of ratios to effectively predict the bankruptcy. Altman developed a Z score model in which the combined effect of five distinct ratios is measured in diagnosing the financial health of the company. Many more models are developed by other researchers in the past to predict the bankruptcy.
A study done by Kuruppu, laswad,and Oylere, (2003) in Newzeland compare the corporate bankruptcy model and liquidation prediction model for analyzing the better prediction model for firm liquidation. The result indicates that the liquidation prediction model was more precise in anticipating the liquidating and continuing companies than corporate bankruptcy. Another study done by Waqas, Hussain and
Anees (2014) the traditional zmijewski model applied on the
Pakistani manufacturing sector .The data collected of about 8 years from firms listed on Karachi stock exchange. The outcome of the study provide evidence that the zmijewski model is useful for the Pakistani companies in predicting corporate bankruptcy. A study was revealed by Tan (2012) to hit upon the affect of financial distress on firm performance. The study outcome indicates a negative link between financial distress and business performance. A study explored by
Pranowo, Achsani, Manurung and Nuryartono (2010) to
examine the corporate financial distress of public companies. Financial distress is represented by Debt coverage ratio. The study shows that increase in current ratio, efficiency and equity ratio is a positive sign because it results in increase the company’s debt coverage ratio. More the leverage less will be the debt coverage ratio hence a negative sign for company. Higher liquidity of the company is a good sign for company.
Altman’s Z score model is used many times by the researchers to know about the financial health of companies. A research done by Rawi (2008) shows that Altman Z score model
effectively indicates the bankruptcy in the firm. The model used the five distinct kind of financial ratios to evaluate profitability and risk in current situation and the future for investor lender and creditor point of view. A study hit upon by
Choy, Munusamy, Chelliah and Mandari (2011) found that
the improvement in stock prices tells about positive performance after distress period whereas decline indicates a negative performance of the companies. A new research conducted by Sheela and Karthikeyan (2012) on pharmaceutical industries in India. The results show that these companies are financially healthy. The period from 2009-2010 remain better for the pharmaceutical industries in India.
Liquidity of the company is calculated through working capital to total asset ratio. A study revealed by Rehman and Nasar
(2007) according to that study firm must have an adequate
amount of current assets .Current assets must not be in excess and nor should be in deficit. Excess would lead towards more liquidity and hence less profitability. Less working capital would lead to insolvency. A new study done by Shakoor
(2012) investigates the association between the working capital
and profitability. The numbers of selected companies were 25 from Karachi stock exchange. The outcome of study provides evidence that more the working capital of the company higher the performance. Profitability ratio is calculated through retained earnings to total asset ratio. A study conducted by
Martani and Mulyono (2009) in Indonesia by taking samples
of 39 manufacturing companies listed on the Indonesia Stock Market. Research shows the result that profitability, turnover and market ratios have significant impact of the stock returns. A research carried out by Taani and Khaled (2011) on Jordanian companies shows that Profitability ratios have a significant impact on performance. Another study by Aguado
and Benito (2012) conducted to analyze the determinants of
corporate default. The outcome shows that there is a strong link between retained earnings to total assets and corporate default.
Returns on assets are calculated through EBIT to total assets. A study revealed by Taani et al (2011) on Jordanian firms that shows that there is a no impact of total asset turnover on earning per share. Another study conducted by Menaje (2012)
depicts a strong link between the EPS and the price of the share, and ROA shows a weak negative link with the price per share. A study was done by Waddock and Graves (1997) to uncover the effect of corporate social performance on financial performance. The variables used were return on equity, return on assets, return on sales, and profitability. The results of the study show that return on assets have a strong and positive association with performance of the firm. A solvency ratio tells us about the market value of equity to total liabilities. A study concealed by Bernstein (1988) the study shows that four kinds of financial ratios include profitability, solvency, capital structure and turnover can be used to know about the performance of the companies. One more study conducted by
Eriotis, Frangouli, and Neokosmides (2002) shows that
the firm strategic assets are financed through equity whereas less strategic assets are financed through debt. This type of financing increases the cost to firm and reduces the profitability. A further study done by Kuntlura, Muppani and
Khan (2008) shows that capital turnover measures the
effective use of company assets to produce sales. Lower value of firm’s capital turnover depicts the effective use of assets and it results in higher performance of the firm.
There are many researches that were conducted to know about best possible measure of financial performance. Graham,
Harvey and Rajopal (2005) made a survey of 400 financial
executives and collected the data about usefulness of earning per share, a large number of the financial executives were of the opinion that EPS is the most trusted measure of the financial performance. EPS can be calculated simply and can be well understood easily. A study revealed by Cudia, and
Manaligod (2011) on 233 companies in Philippines. The result
shows that earning per share is a better measure of companies’ performance. A study by Kootanaee,Talari and Babu (2012)
exhibit that the Eps significantly affects the market value of the firm, so it is the one of the best measure of performance.
Theoretical framework
The theoretical framework is the pictorial representation of the relationship between independent and dependent variables. Here five independent variables used to study financial distress and one dependent variable that is earning per share shows the financial performance. The model that is derived in the light of previous literature is as follows
Research Hypothesis
To know about relationship b/w different variable a hypothesis is used. Five hypotheses are to be researched, so that to discover the association between two variables. Following are the five hypotheses which are developed by using the Altman Zscore model.
Hypotheses (H1): Liquidity has a positive relationship with financial performance.
Hypotheses (H2): Profitability is a positively associated with the financial performance.
Hypotheses (H3): Solvency is positively linked with financial performance.
Hypotheses (H4): Return on assets positively affects the financial performance.
Hypotheses (H5): Financial performance increases with the increase in capital turnover.
MATERIALS AND METHODS
Sample and Procedure
All listed Non-Financial Companies at KSE are 579. The sector selected for study is fuel and energy sector. A sample size of 15 companies is selected on the basis of market capitalization. Data collection time period is of six years from 2007-2012. Altman’s classic Zscore model is used to investigate the multiple independent variables. The research uses a quantitative approach. The collected data is analyzed through SPSS model. The ‘Regression Analysis Model’ and ‘Co-relation’ are used to analyze and interpret the data. Secondary data is collected from balance sheet analysis done by state bank of Pakistan and also from articles, journals, books, and official websites.
Data is analyzed and interpreted on the basis of results obtained by measuring the five financial ratios. Those ratios are
Empirical Proxy Formula/Method
X1 Liquidity Working Capital/Total Assets
X2 Profitability Retained Earnings/Total Assets
X3 Return On Assets EBIT/Total Assets
X4 Solvency Market value Of Equity/Total Liabilities
X5 Capital Turnover Net Sales/Total Assets Overall
Index
Z Score (model) Z= 1.2 X1 + 1.4 X2 + 3.3 X3 + 0.6 X4 + 1.0 X5
Individual and combined impact of these ratios is found on performance of the companies that is represented by earnings per share. The results are interpreted and analyzed according to the specific criteria. If the value of
Z< 1.80 the firm is in distress zone and will go to bankruptcy Z> 1.80 and <2.99 firm will be in grey zone means there is a likelihood that firm will bankrupt
Z> 2.99 the firm will be in safe zone means no bankruptcy
[image:3.595.45.288.428.603.2]RESULTS
Table 1. Descriptive Statistics
N=90, Independent variables: Liquidity, Profitability, Return on assets, Solvency, Capital turnover. Dependent variable: EPS
Variables Minimum Maximum Mean Std.
Deviation
Liquidity 0.00 2.00 .24 .251
Profitability 0.00 1.00 .07 .134
Return on assets 0.00 0.50 .10 .102
Solvency 0.00 5.00 1.01 1.136
Capital turnover 0.00 6.00 1.49 1.216
Altman Z score 1.08 7.05 2.8163 1.536
Earnings per share 0.01 128 15.26 20.91
The above Table shows the descriptive statistics of five independent variables and one dependent variable. The liquidity variable has maximum value of 2 the average change is 24% during six years and deviation rate is 25%.The profitability variable has maximum value of 1 the average change is 7% during six years and deviation rate is 13%.The return on assets variable has maximum value of 0.5, the average change is 10% during six years and deviation rate is also 10%.the solvency variable has maximum value of 5 the average change is 101% during six years and deviation rate is 113%.The capital turnover variable has maximum value of 6 the average change is 149% during six years and deviation rate is 121%.The z score variable has maximum value of 7, the average change is 281% during six years and deviation rate is 153%.
The above Table shows that the there is a positive relationship between liquidity and earnings per share. The value of correlation is .156 and the value of p using a t tailed approach is .143 greater than 0.01 so the relationship is insignificant. There exist a significant positive association between profitability and EPS. The value of Pearson correlation is 268 and the value of correlation using 2 tailed approach is .011.A strong positive correlation between return on assets and earnings per share and the value of correlation is .678 whereas the value of correlation using 2 tailed approach is .000.The Table depicts a positive association between solvency and earnings per share. The correlation is .044 and the value using a 2 tailed approach is.682 showing an insignificant relationship between solvency and EPS. The Table exhibits a strong positive association between capital turnover and EPS. The value of correlation is 0.406 and the value using a 2 tailed approach is 0.00.The table depicts a strong positive association between Z score value and earnings per share. The value of Pearson correlation is .585 and the value using 2 tailed approach is <0.01.
Table 3. Regression Analysis
MODEL F T Sig R square Adjusted R
square
Altman z score 45.759 6.765 0.00 .342 .335
N=90, Independent variables: Liquidity, Profitability, Return on assets, Solvency, Capital turnover. Dependent variable: EPS
R square tells about dependent variable variation that comes due to the combine effect of independent variables. R square does not tell about the individual effect of variables it tells
about the combine strength of independent variables to bring the changes in the dependent variable. The Table above shows the R square value of .342 which tells that independent variable Z score is responsible for 34% change in dependent variable earnings per share. The adjusted R square removes the effects of extraneous elements in R square. The adjusted R² defines the variance in the future outcome that the model explains. It determines about the measurement of outcomes that how are likely to be predicted. The R² (33.5%) is actually showing the variety of independent Altman Z score variables among the dependent variable which is earnings per share. The above Table shows the t value of 6.765 and the level of significance is 0.00 which is below 0.05.
The regression analysis is suggesting a significant association between the z score and Eps. The value of F (1, 88) =45.759 and the p<0.05which shows that the Z score model significantly predict the dependent variable earnings per share.
DISCUSSION
The study investigates the financial distress effect on financial performance. The study is conducted on Fuel and energy sector of Pakistan from 2007-2012.Fuel and Energy sector is playing a fundamental role in economic development of country. The sector performed healthier as a whole whereas companies’ performance varies from one to other and remained fluctuating in previous years. The results depict that 8 out of the 15 companies have shown the distress values and the performance of these companies also declined in that period. The Z score value of 7 companies were remained mostly in the safe zone and their performance is increased in that period. There is a little concern about the future of the companies in this sector. The Fuel and energy sector is a strong industry in the country and serves as a backbone of the growth for the economy. The performance of the companies related to the Fuel and energy sector mostly remain better in the study period.
Conclusion
The research exhibits that there exists a significant positive association between Z score value showing financial distress and financial performance. Most of the financial measures used in Altman’s Z score model show a significant impact on earnings per share. The liquidity and solvency has a positive relationship with financial performance but not significant whereas profitability is significantly associated with EPS. The
Table 2. Correlation Analysis
Variables Liquidity Profitability Return On Assets Solvency Capital Turnover Z Score Value Eps
Liquidity 1
Profitability .161 1
ROA .239* .305** 1
Solvency .063 -.023 .431** 1
Capital Turnover .020 -.065 .252* -.253* 1
Z Score Value .317** .138 .719** .391** .702** 1
Eps .156 .268* .678** .044 .406** .585** 1
N=90, Independent variables: Liquidity, Profitability, Return on assets, Solvency, Capital turnover. Dependent variable: EPS
EPS has a strong and significant association with return on assets and capital turnover .The Z score value also shows a strong and significant association with financial performance. The earnings per share of the firm show an increase with the decrease in financial distress whereas the earning per share of the firm shows a decrease with increase in financial distress.
Limitations and future research directions
Study is done only on the sample size of 15 companies selected from Fuel and energy sector. Due to the time and resource constraints the study period is only six years and the only one sector is selected for study, but the study is still helpful for the upcoming researchers who want to target this area. The study provides a better understanding of effects of financial distress on financial performance. Upcoming researchers can study the financial distress impact on financial performance using different approaches. The research is done by using earnings per share as an indicator of financial performance. It is recommended that the future researchers should also use other measures of financial performance such as stock returns, economic value added and return on investment. The study is accomplished on a sample size 15 firms it is recommended that the future researchers should broaden their study sample size so that to obtain the results applicable to larger number of firms. The study conducted by using Z score model consisting of five ratios to measure the financial health. A number of the others models are available that can be used to find out the financial distress. It is recommended to use a seven factor model and logit model or a suitable model should be derived that best fits the Pakistani firms.
REFERENCES
Aguado, C. G. and Benito, M. E. 2012. Determinants of corporate default: A BMA approach, Applied Economic
Letters, 20(6), 511-514
Altman, E. I. 1968. Financial ratios, discriminant analysis and the predication of corporate bankruptcy, The Journal of
Finance, Vol 23, No.4.Pp. 589-609.
Bathory, A. 1984. Predicting corporate collapse: credit analysis in the determination and forecasting of insolvent companies. Financial Times Business Information.
Beaver, W. H. 1966. “Financial ratios as predictors of failure”,
Journal of Accounting Research (Supplement),
4(3):71-111.
Bernstein, L. A. 1988. Financial statement analysis, theory, application, and interpretation. Journal of Accounting
Research, Vol. 3, 61-80.
Choy, S. L. W., Munusamy, J. Chelliah, S. and Mandari, A. 2011. Effects of financial distress condition on the company performance: A Malaysian perspective. Review
of Economics and Finance, 1(4), 85-99.
Cudia, C. P. and Manaligod, G. T. 2011. EPS as a measure of intercompany performance: Philippine Evidence. Journal
of International Business Research, 10(1), 79-90.
Eriotis, N. P. Frangouli, Z. and Neokosmides, V.Z. 2002. Profit margin and capital structure: an empirical relationship. The
Journal of Applied Business Research, 18: Pp.85-88.
Garman, E. T., Sorhaindo, B., Kim, J., Xiao, J. J., Bailey, W., & Prawitz, A. 2004. The evolution of the Beta Version of
the In Charge Financial Distress Scale. Consumer Interests
Annual, 50, 134-144.
Goudie, A. W. 1987. "Forecasting corporate failure: the use of discriminant analysis within a disaggregated model of the corporate sector." Journal of the Royal Statistical Society.
Series A (General), 69-81.
Graham, J. R. Harvey, C. R. and Rajgopal, S. 2005. The economic implications of corporate financial reporting.
Journal of Accounting and Economics, 40(1), 3-73.
Kochhar, R. 1997. Strategic assets, capital structure, and firm performance. Journal of Financial and Strategic
Decisions, Vol.10, No3, pp. 23-36.
Kootanaee, H. J., Kootanaee, A. J., Talari, H. F. and Babu, K. N. 2012. A comparison of performance measures for finding the best measure of business entity performance: Source from the Tehran Stock Exchange, Journal of
Finance and Investment Analysis, vol. 1, no.4, 27-35.
Kuntluru, S., Muppani, V. R., & Khan, M. A. A. 2008. Financial performance of foreign and domestic owned companies in India. Journal of Asia-Pacific Business, 9(1), 28-54.
Kuruppu, N., Laswad, F., & Oyelere, P. 2003. The efficacy of liquidation and bankruptcy prediction models for assessing going concern. Managerial Auditing Journal, 18(6/7),
577-590.
Martani, D. and Mulyono, R. K. 2009. The effect of financial ratios, firm size, and cash flow from operating activities in the interim report to the stock return. Chinese Business
Review, 8(6), 44-55.
Menaje, P. M. 2012. Impact of Selected Financial Variables on Share Price of Publicly Listed Firms in the Philippines.
American International Journal of Contemporary
Research, 2(9), 98-104.
Pranowo, K., Achsani, N. A., Manurung, A. H. and Nuryartono, N. 2010. Determinant of corporate financial distress in an emerging market economy. International
Research Journal of Finance and Economics, 52, 80-88.
Rawi, K. 2008. The Use of Altman Equation For Bankruptcy Prediction In An Industrial Firm. International Business
and Economics Research Journal, Vol.7,115-128.
Rehman, A. and Nasar, M. 2007. Working capital management and profitability (A case of Pakistani firms), International
Review of Business Research, Vol.3, No.1, Pp.279-300.
Shakoor, F. Khan, A. Q. and Nawab, S. 2012. The inter-linkages of working capital and profitability in pakistan.
Academic Research Journal, Vol. 3(2).
Sheela, S. and Karthikeyan, K. 2012. Evaluating financial health of pharmaceutical industry in India through a z score model. International Journal of Social Sciences,
Vol.1 No.5
Shumway, T. 2001. Forecasting bankruptcy more accurately: A Simple Hazard Model, The Journal of Business School,
74(1), 101-124.
Taani, K. and Banykhaled, M.H.H. 2011. The impact of financial ratios, firm size and cash flows from operating activities on earning per share (An applied study on jordanian industrial sector). International Journal of Social
and Humanities Studies, Vol 3(1), 197-205
Tan, T. K. 2012. Financial distress and firm performance: An evidence from the Asian financial crisis. Journal of
Finance and Accountancy, 11, 36-45.
Waddock, S. A. and Graves, S. B. 1997. The corporate social performance-financial performance link. Strategic
Management Journal, 18 (4). 303-319.
Waqas, H. Hussain, N. and Anees, U. 2014. Zmijewski Financial distress prediction model and its predictability, A case of karachi stock exchange. Journal of Basic and
Applied Scientific Research, 4(4)155-163
WEB SITES
www.sbp.org.pk, www.kse.com.pk, www.ksestocks.com, www.brecorder.com.pk