Segmental Content Effects on Text-dependent Automatic Accent Recognition
Georgina Brown
Department of Linguistics and English Language
Lancaster University, United Kingdom
Abstract
This paper investigates the effects of an unknown speech sam-ple’s segmental content (the specific vowels and consonants it contains) on its chances of being successfully classified by an automatic accent recognition system. While there has been some work to investigate this effect in automatic speaker recog-nition [1], it has not been explored in relation to automatic ac-cent recognition. This is a task where we would hypothesise that segmental content has a particularly large effect on the likeli-hood of a successful classification, especially for shorter speech samples. By focussing on one particular text-dependent auto-matic accent recognition system, the Y-ACCDIST system [2], [3], we uncover the phonemes that appear to contribute more or less to successful classifications using a corpus of Northern English accents. We also relate these findings to the sociopho-netic literature on these specific spoken varieties to attempt to account for the patterns that we see and to consider other factors that might contribute to a sample’s successful classification.
1. Introduction
Rather than aiming to improve recognition performance, this paper focusses on the properties of the unknown sample and its resulting chances of undergoing a successful analysis by a given methodology. Possible properties we might be interested in are the sample’s recording quality or its duration. However, this pa-per is primarily concerned with the segmental composition of an unknown speech sample (i.e. the specific vowel and conso-nant phonemes, and their frequencies, that are contained within it). The segmental composition is likely to have an effect on text-dependent systems that rely on segmental features to form models and perform recognition. This work investigates this as-pect of an unknown speech sample in the context of automatic accent recognition. Segmental content effects have been con-sidered in past research in relation to automatic speaker recog-nition performance, rather than accent recogrecog-nition [1], [4]. We therefore transfer these ideas to automatic accent recognition.
It is also expected that the outcome of an analysis depends on the individual speakers themselves (i.e. some speakers are more suited to the classification task than others). The variable of individual speaker identity is also accounted for, both in the statistical analysis and in the discussion of results.
This line of research could ultimately lead us to discover which speech samples may or may not be suitable for a given methodology, which could be of particular value to more sensi-tive causes, such as security or forensic applications.
2. Previous Research
This section first reviews past work on developing automatic accent recognition systems, with reference to their performance.
We then move on to talk about past studies that have considered
segmental effectson system performance.
2.1. Automatic Accent Recognition
Automatic accent recognition research has largely followed au-tomatic speaker recognition research by adopting the same tech-niques and applying them to a different problem. For exam-ple, [5] looked at automatic accent classification using a GMM-UBM (Gaussian Mixture Model Universal Background Model) system on different dialects of Mandarin Chinese. At the time of writing in 2010, [6] referred to the GMM-UBM system ar-chitecture as the “de facto reference method in speaker recogni-tion”. Having trained separate GMM-UBM accent recognition systems for male and female Mandarin Chinese speakers, [5] observed error rates of 15.5% and 11.7%, respectively. Fol-lowing the more recent trends in automatic speaker recognition, there has been other research on developing and testing i-vector-based systems for accent recognition tasks [7], [8], [9], [10]. [10] reported a recognition rate of 76.76% accuracy on a task classifying speakers into one of 14 accent categories collected from locations across the breadth of the British Isles using an i-vector-based system.
The systems discussed so far aretext-independentsystems, which refers to the system property of not requiring an accom-panying transcription of the speech sample to classify that sam-ple. There has also been some work ontext-dependentaccent recognition systems, where a transcription is required for clas-sification. The system presented in this paper is text-dependent, and this is based on the ACCDIST metric (Accent Characteri-zation by Comparison of Distances in the Inter-segment Simi-larity Table metric) [11], [12]. The ACCDIST metric provides a means to represent the realisational differences in speakers’ pronunciation systems. For example, it aims to capture whether a speaker’s production of the vowels in the words FOOTand
STRUTare different (typical of a Standard Southern British En-glish speaker) or very similar (typical of a Northern EnEn-glish English speaker). More specific details of how an ACCDIST-based system works are given below in Section 3.2. [13] demonstrated the performance of an ACCDIST-based system in their work and observed a recognition rate of 95.18% accuracy on a 14-way accent recognition task using this modelling ap-proach. Their ACCDIST-based system outperformed a GMM-UBM system, which achieved 61.13%, on the same accent recognition task. This striking performance difference is per-haps expected in a comparison between text-independent (with no prior knowledge of the segmental contents of the speech samples) and text-dependent systems (with prior knowledge of the segmental contents of the speech samples).
applications we can use a text-dependent system for is signif-icantly limited, compared to text-independent systems. The ACCDIST-based systems presented by [11] and [13] were particularly limited due to the fact that the spoken content of the sample we wish to classify must match that of the training data (i.e. all speakers must be producing the same reading passage or prompts). The York ACCDIST-based automatic accent recognition system (the Y-ACCDIST system) was developed to explore whether we can take advantage of the ACCDIST-based modelling approach, while also working with
content-mismatched data (i.e. running tasks where the spoken content of the training data and the unknown speech sample we wish to classify does not need to match) [2], [3]. This makes it possible to work with spontaneous speech. While there are clearly practical limitations to requiring a transcription, [2] proposed that a system like this could still have a place in forensic applications, where a transcription of a speech sample might be available and could help to identify the geographical origin of unknown speakers in legal investigations.
The work here advances on automatic accent recognition research by reflecting on the speech samples that these tech-nologies aim to classify. Presumably some speech samples are more suitable for an automatic analysis by these systems than others. This might be down to the quality of the recording con-ditions or how typical a speaker might be of a given accent vari-ety. The aspect of a speech sample the present study is targeting is thesegmental contentof the speech sample (i.e. the indi-vidual vowels and consonants a speech sample contains). We might expect that accent recognition technology in particular is very sensitive to a speech sample’s segmental composition. Taking the Y-ACCDIST system, this study steps towards un-covering the segmental criteria a speech sample should meet for a reliable accent classification analysis to take place.
2.2. Segmental Effects
From the automatic speaker recognition literature, we can gather that different speech segments (e.g. vowels, consonants, particular syllables, etc.) can have different effects on recog-nition performance. We can linguistically constrain a speaker recognition system to only use specified speech segments in an analysis. [14] talks about this selective approach as a ‘condi-tioning’ process of the models. [15] demonstrate the effects of conditioning a GMM-UBM speaker recognition system in this way by enforcing syllable-based constraints. They found that by only using monosyllabic words in these systems, they can achieve comparable recognition rates to using all data avail-able. Identifying a particularly useful segment type could sig-nificantly reduce the computational cost involved.
[16] similarly conditioned an automatic speaker recogni-tion system, this time i-vector-based speaker recognirecogni-tion. They trained and tested individual i-vector-based systems on sin-gle phonemes and diphones. They indeed found that some phonemes outperformed others on this task.
The studies so far discussed in this section have concerned the segments involved in both the training data and the test data. However, this paper is most concerned with the segments found in just the test data, and how this affects an already-trained sys-tem. This has been touched upon in the speaker recognition research literature. [17] looked at the effects of shorter du-rations of test utterances on speaker recognition performance. Within [17]’s study, they show the exponential reduction of the number of unique phonemes as a speech sample decreases, and speculate about the link between the phonemic coverage that a
speech sample has and its likelihood of being accurately anal-ysed. However, they do not run experiments to directly investi-gate this link.
[1] explored the relationship between the segmental con-tent of test samples and the outcome of an automatic speaker recognition analysis. They did not find a significant result to confirm that the phonetic contents of a speech sample affects its likelihood of being accurately analysed, but they also acknowl-edge that this does not mean that there is not an effect at all. One criticism of their experiments is that they used a corpus of phonetically balanced read prompts. Controlling data like this does not allow us to see the effects of the natural distribu-tion of speech segments that a language offers. It is preferable to run these kinds of experiments on spontaneous speech, but of course finding or acquiring enough transcribed spontaneous speech data can prevent this kind of valid research from taking place.
The present study asks these questions around test samples’ segmental content of automatic accent recognition technology, specifically the Y-ACCDIST system. Because the Y-ACCDIST system so heavily relies on segmental features, we could rea-sonably expect that the segmental composition of speech sam-ples will indeed have an effect on the likelihood of running a successful analysis.
3. Experiments
This section describes the components of the experiments in this study. First, the data and the Y-ACCDIST system are de-scribed followed by the method to explore the relationship be-tween a speech sample’s segmental content and successful clas-sification. The results are also presented and analysed in this section before being discussed.
3.1. Data
The corpus used for these experiments is theLanguage Change in Northern Englishescorpus [18]. This corpus has been chosen because it contains a substantial amount of transcribed sponta-neous speech per speaker. The subset of the corpus used for these experiments includes an approximate balance of young male and female speakers from three Northern English cities: Manchester, Newcastle and York. Within each of these accent groups, we used 15 speakers. For each speaker, we have 10 minutes of transcribed net speech available to use for these ex-periments. The data were originally collected for sociolinguistic research purposes. The speakers were recorded in pairs having a conversation.
3.2. The Y-ACCDIST System description
This section will first outline how we model the training speak-ers’ speech samples and then describe the classifcation proce-dure.
3.2.1. Modelling
[image:3.595.312.545.68.258.2]To model each speaker, the speech sample and transcription for the speech sample is used for forced alignment, resulting in es-timated time boundaries for each phone segment in the sam-ple. Using these time estimations, the midpoint Mel Frequency Cepstral Coefficient (MFCC) was extracted for each individual phone. These are 12-element MFCC vectors with no delta coef-ficients. We then calculate an average MFCC to represent each phoneme in the inventory. Using these average phoneme rep-resentations we can then form the foundations of a matrix to compute the Euclidean distance between all possible phoneme-pair combinations that the phoneme inventory allows. The re-sulting collection of intra-speaker segmental distances are hy-pothesised to characterise a speaker’s pronunciation system in that the degree of similarity between phoneme realisations is expected to reflect the realisational quality of these segments, and therefore the accent. Figure 1 below illustrates a simplified Y-ACCDIST matrix, if our phoneme inventory only consisted of three phonemes, but in reality we used the whole phoneme inventory (42 phonemes) to construct the Y-ACCDIST matrices for each speaker.
Figure 1:A simplified illustration of a Y-ACCDIST matrix.
3.2.2. Classification
[image:3.595.58.261.380.458.2]The classification mechanism is a Support Vector Machine (SVM) [20]. The training speaker Y-ACCDIST matrices for each of the accent groups are fed into the SVM. For each ac-cent group, we form aone-against-the-restsetup, where each accent group becomes the ‘one’ in turn, while the remaining accent groups collectively form the ‘rest’. An optimal hyper-plane that best separates the ‘one’ accent group from the ‘rest’ of the accent groups. When classifying an unknown speaker, the speech sample is converted into a Y-ACCDIST matrix to model that speaker’s accent. This matrix is then fed into the trained SVM. On each rotation, where the training speakers for each accent form a one-against-the-rest configuration, the mar-gin the unknown speaker forms with the hyperplane is logged. The clearest margin it forms among these rotations determines the accent label the unknown speaker is assigned.
Figure 2:System flow diagram of the Y-ACCDIST system.
3.3. Methodology
Initially, the experiments here are concerned with 30-second speech samples and which speech segments influence the clas-sification outcome of these samples. For each speaker’s 10-minute sample, we can obtain 20 30-second speech samples per speaker. As we have 45 speakers, we have a total of 900 30-second samples.
When using 30-second samples, rather than 10-minutes per speaker, we achieve an overall recognition rate of 53.3% correct [19]. In the experiments in this paper, each of the 900 30-second speech samples becomes the unknown sample to classify. We therefore have 20 test samples per speaker. Each time a sample is classified, the remaining 44 speakers in the dataset are used to train the system. Whether the sample was correctly classi-fied or not is logged, as well as the segmental composition of the sample. To log a sample’s segmental composition, we sim-ply record the frequency count of each phoneme in the sample. We can think of each speech sample as a segmental frequency distribution, as illustrated by Figure 3 below:
Figure 3:The segmental distribution of a randomly selected 30-second speech sample.
[image:3.595.313.541.542.612.2]30-second speech samples. Within this model, the frequencies of individual phonemes were coded as ‘fixed effects’, as well the true accent group of the speaker. This is because we expect that some accents are more classifiable than others (as discussed in [3]). The individual speaker ID was coded as a random effect in the regression model, as we can expect that some speakers in our dataset are simply more suitable for an analysis like this than others. This point is elaborated on below in Section 3.4.3.
This process was then repeated for varying durations of speech sample to see if we can observe changes in the phonemes that are identified as having significant effects on the classifica-tion outcome. This was run for samples shorter than 30 seconds (20 seconds and 25 seconds), as well as samples longer than 30 seconds (35 and 40 seconds). For the 35-second and 40-second samples, 900 samples were obviously not available within the 10-minute samples. Therefore, to run the logistic regression on these durations, 765 and 675 samples were used, respectively. Lower numbers of trials could have impacted on the overall re-sults.
3.4. Results and Analysis
This section presents the output of the mixed-effects logistic regression model. First, we will present the phonemes that were highlighted as significant by the model, and then we will do the same for the other durations of sample. We will then present the effects that the individual speaker is predicted to contribute to classification.
3.4.1. 30-second speech samples
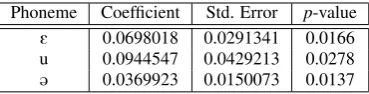
[image:4.595.80.265.486.533.2]Table 1 below lists the phonemes that have been uncovered as significant factors in the classification of 30-second speech sam-ples by the logistic regression model. These are accompanied by the relevant coefficients and the p-value that indicates the phonemes’ statistical significance.
Table 1: The phonemes identified as significant by the mixed-effects logistic regression model.
Phoneme Coefficient Std. Error p-value
E 0.0698018 0.0291341 0.0166 u 0.0944547 0.0429213 0.0278
@ 0.0369923 0.0150073 0.0137
These results indicate that the more of each of these phonemes we find in a 30-second speech sample, the more likely it is that the speech sample will be correctly classified. The fact that any phonemes were flagged up as significant at all confirms to us that the segmental content does have an effect on the likelihood of a speech sample being correctly classified by Y-ACCDIST. Especially for shorter recordings, we might need to think about whether they contain the speech segments that would assist with the analysis. When we consider the specific phonemes that have been identified as significant in the analy-sis, we can draw sociolinguistic links with the particular accent varieties we are distinguishing between.
Beginning with the phoneme which was revealed to be most significant, /@/ is perhaps expected to be a key distinguisher for these particular varieties. [21] show that /@/ is a distinguishing feature of varieties of northeastern English English, of which Newcastle is one. We might also expect that /@/’s frequency as a segment contributes to these results, as it provides more data to strengthen models and representations.
The /u/ vowel can also be explained in this context.GOOSE -fronting is a phenomenon found in accent varieties across the UK.GOOSEis the keyword taken from [22] to describe the /u/ phoneme in English. It is typically thought of as a close back rounded vowel, but theGOOSE-fronting phenomenon describes its more front realisation for by some speakers. [23] claim that theGOOSEvowel has fronted significantly for all social groups in the Manchester area. In contrast, [24] claims that in Tyneside English,GOOSE-fronting is not evident. Given the difference in the reported quality of /u/ in these two varieties, it seems to be a variable which can successfully assign the speakers the correct accent label in this particular dataset.
The /E/ vowel, however, is not necessarily expected to ap-pear among features which distinguish between these varieties. It has not been proposed as a distinctive feature of these ac-cents by the sociophonetic literature. One possible explanation for it appearing among the very few significant effects is that it is as good discriminant, but it has not been sufficiently re-searched by sociophoneticians. An alternative explanation is that it is more to do with the inner workings of Y-ACCDIST, and what it required to express realisational differences between varieties. In the modelling of speakers’ accents, Y-ACCDIST calculates distances between pairs of sounds, rather than treat-ing each phoneme segment individually. While we tend to ex-press individual segmental realisations in this way, we must re-member that it is pairs of phonemes which provide the basis for the expression. To be able to express realisational differ-ences, a phoneme must be able to create a reflective distance with another phoneme’s representation, treating it like a refer-ence point. We could therefore accept that there might be par-ticularly stable phonemes found among the significant effects in the results above. This is because an analysis might require at least one phoneme which provides stability across all the ac-cent varieties in our corpus for the realisational variation to be sufficiently expressed.
The three phonemes revealed in the results do not exhaust the list of phonemes which might be expected to assist in an accent recognition task between these three accent varieties. It should be kept in mind, however, that these are the phonemes which are highlighted when it is 30-second speech samples be-ing tested. If longer speech samples were used, other phonemes might emerge as significant components. We can expect that phoneme frequency plays a part in these results, and a 30-second stretch of speech might not allow for other expected phonemes to form strong enough representations, because there are simply not enough of them. The number of phone tokens it takes to form a reliable representation of a phoneme’s reali-sation for a speaker may also be phoneme-dependent (i.e. some phonemes might require fewer tokens to produce a reliable av-erage representation than others). One reason for this might be to do with a phoneme occurring in a greater variety of contexts than others, and so a wider range of coarticulatory effect might vary a phoneme’s range of realisations. In these sorts of cases, we would expect more tokens to form a reliable representation in the Y-ACCDIST model.
3.4.2. Varying Durations
Table 2: The phonemes identified as significant by the mixed-effects logistic regression model.
Duration Phoneme Coefficient Std. Error p-value 20 secs 3 0.155557 0.050521 0.00208 25 secs n -0.038775 0.019775 0.0499
tS -0.128558 0.064732 0.0470 30 secs E 0.0698018 0.0291341 0.0166 u 0.0944547 0.0429213 0.0278
@ 0.0369923 0.0150073 0.0137 35 secs E 0.055944 0.028402 0.04887
6 0.083376 0.028982 0.00402
I@ 0.177996 0.057549 0.00198 d 0.037795 0.019263 0.04976 f -0.079694 0.031727 0.01201 40 secs E 0.057348 0.028816 0.0466
3 0.079076 0.039434 0.0449
E@ 0.091353 0.040311 0.0234
At a first look, inconsistencies seem to show up across the different sample durations. Generally speaking, different seg-ments are flagged as significant for different sample lengths. We should view these results with caution. a larger dataset that allows for more samples to be included in the analysis would help to overcome the volatility. It could also be due to focussing on such short sample lengths, where the phoneme distributions might change considerably between different durations. De-spite that, it appears that among these identified phonemes there are some patterns and alignments with what we might expect sociophonetically.
One key observation is that across these durations, it is mostly vowel segments that have been identified, and these all have positive coefficients (suggesting that the more of these seg-ments there are, the more likely one of these speech samples will be classified correctly). There are also consonants which have been identified as significant, but with a negative coeffi-cient. This means that having more of these tokens in a speech sample is more likely to lead to an incorrect classification. Such segments are /n/ and /tS/ in the 25-second duration model and /f/ in the 35-second model. It is implied that these segments have a detrimental effect in the accent recognition task.
Only one segment has been revealed as significant for the 20-second samples, and this is /3:/, or theNURSEvowel wen we refer to the lexical sets in [22]. We can expect that /3:/ would be a valuable segment to this accent classification task since [25] note that /3:/ is fronted in Manchester English, which might sep-arate Manchester speakers from Newcastle and York speakers. Interestingly, /3:/ does not appear as significant in the analyses for other durations, but then reappears for the longest duration, 40 seconds. This could be linked to the point previously made above with regard to some phonemes requiring more tokens to form a strong enough representation in the model than others.
Turning our attention to the segments /I@/ and /E@/, we can assume that similar factors for each of these are at play. Both of these phonemes have /@/ as a component, and so a similar effect to the one discussed above in relation to Newcastle speakers’ /@/ are also likely to apply to these phonemes. In contrast [25] note that the /I@/ and /E@/ phonemes are ‘smoothed’ in Manchester English, and so are realised more as [I:] and [E:]. It seems that these expected realisational differences might perhaps be influ-ential in distinguishing between these particular varieties when using shorter speech samples.
Although /@/ was identified as significant and was justified
in the context of 30-second samples, it has not emerged as sig-nificant in other durations. We can perhaps expect /@/’s repre-sentations to be sensitive to the addition or removal of tokens in a sample. Even though /@/ is a very frequent segment, it ap-pears in many different contexts. We can expect that some con-texts help with indicating the speaker’s accent, whereas others do not. The tokens of /@/ which seemingly do not contribute to correctly classifying a speaker’s accent may therefore introduce ‘noise’ to the representation and so would lose distinctive value as a result. This might explain /@/’s inconsistency as a signifi-cant effect, despite being a highly frequent phoneme.
3.4.3. The Effect of Speaker Identity
Individual speaker identity was coded as a random effect in the logistic regression analyses because we can expect that some speakers are more classifiable than others using the Y-ACCDIST methodology, and this is not a factor that we can control. The 30-second model outputted a variance of 0.398 at-tributed to speaker identity. If the variance were 0, this would indicate that the specific speaker identity does not contribute to the outcome of a speech sample’s analysis. The variance out-putted suggests that speaker identity does indeed contribute to the outcome to some extent, reinforcing initial expectations. To take a closer look, we can observe the successfully and unsuc-cessfully classified 30-second speech samples in Figure 4:
[image:5.595.347.507.368.705.2]This figure allows us to rule out that the successful sifications are solely down to the specific speaker being clas-sified. Taking an initial glimpse at the chart shows that there does not seem to be a huge weighting of correct classification assigned to specific speakers (i.e. we do not see entire columns of only correct classifications or only incorrect classifications. They seem to be much more randomly distributed among the different speakers. A closer inspection of the correct classifica-tions does seem to suggest that speaker identity accounts for the outcome of an analysis to some degree. Focussing on speakers 6 and 17, for example, we see that many more of these speakers’ trials are successfully classified compared with other speakers. In contrast, speaker 12 seems to be an example of the opposite situation, where the majority of this speaker’s trials are incor-rectly classified. These observations seem to reinforce our ex-pectations that some speakers are more suitable for this kind of analysis, while others (like speaker 12) seem to be less so. It also mirrors some of the work we have seen in speaker recog-nition research. [26] investigated a way of characterising the “recognizability” of speakers. It could be of interest to further explore how the segmental distributions of speech samples in-teracts with speaker recognisability.
[image:6.595.61.284.371.506.2]We can also observe the variance attributed to individual speaker identity for the different durations we have been testing. These variances are presented in Figure 5:
Figure 5:Variance attributed to speaker identity in each mixed-effects logistic regression model for each speech sample dura-tion condidura-tion.
Given that we only have five duration models here, the con-clusions we draw can only be very speculative, but there still seems to be something to consider. It appears that there is a general increase in the variance in the model assigned to speaker identity. This suggests that as the duration of the speech sample increases, specific speaker identity contributes more to the like-lihood of a successful classification. We could interpret from these results that as phoneme representations in the models be-come more stable, individual speaker identity could bebe-come more of a contributing factor in accent recognition performance.
4. Discussion
Using a text-dependent automatic accent recognition system, which depends on segmental features for its modelling proce-dure, is obviously expected to be affected by the phonemes
that the unknown sample contains. The results in this study seem to confirm this, but highlight that there are not necessarily phonemes that are consistently responsible for the correct clas-sification of shorter speech samples. This has made us consider the different factors that could be responsible for the volatility in the results. Not only is the distinctive power of individual phonemes among a specific set of accents likely to be a fac-tor, but also the frequencies of these segments, as well as the range of phonological contexts that these phonemes occur in. In light of some of the points made in the analysis above, it would be of value to observe the effect segmental content in terms of context-specific segments. For example /l/ is realised differently in some varieties of English according to what posi-tion in a syllable it is in.
It would be also of interest to replicate this study on text-independent systems to observe whether these kinds of systems seem to be affected by the segmental contents of samples they aim to classify. Even though text-independent systems do not make these segmental distinctions so directly, it is expected that their performance still depends on realisational differences among speakers. It would be interesting to observe and com-pare text-independent and text-dependent systems in this way on the same data.
5. Acknowledgements
The work presented here was funded by the Economic and So-cial Research Council - Advanced Quantitative Methods PhD scholarship. I would also like to thank Dominic Watt for dis-cussions during this work.
6. References
[1] Juliette Kahn, Nicolas Audibert, Solange Rossato, and Jean-Franc¸ois Bonastre, “Intra-speaker variability effects on speaker verification performance,” inProceedings of Odyssey: The Speaker and Language Recognition Work-shop, Brno, Czech Republic, 2010, pp. 109–116. [2] Georgina Brown, “Y-ACCDIST: An automatic accent
recognition system for forensic applications,” M.S. the-sis, University of York, UK, 2014.
[3] Georgina Brown, “Automatic recognition of geographically-proximate accents using content-controlled and content-mismatched speech data,” in
Proceedings of the 18th International Congress of Phonetic Sciences, Glasgow, UK, 2015.
[4] Moez Ajili, Jean-Franc¸ois Bonastre, Waad Ben Kheder, Solange Rossato, and Juliette Kahn, “Phonetic content im-pact on forensic voice comparison,” inProceedings of the Spoken Language Technology (SLT) Workshop, San Juan, Puerto Rico, 2016.
[5] Tao Chen, Chao Huang, Eric Chang, and Jingchum Wang, “Automatic accent identification using Gaussian Mixture Models,” inProceedings of IEEE workshop on Automatic Speech Recognition and Understanding, 2001.
[6] Tomi Kinnunen and Haizhou Li, “An overview of text-independent speaker recognition: from features to super-vectors,” Speech Communication, vol. 52, pp. 12–40, 2010.
[8] Mohamad Hasan Bahari, Rahim Saeidi, Hugo Van Hamme, and David Van Leeuwen, “Accent recognition using i-vector, gaussian mean supervector and gaussian posterior probability supervector for spontaneous tele-phone speech,” inProceedings of the International Con-ference on Acoustics, Speech and Signal Processing, Van-couver, Canada, 2013, pp. 7344–7348.
[9] Hamid Behravan, Ville Hautam¨aki, and Tomi Kinnunen, “Factors affecting i-vector based foreign accent recogni-tion,”Speech Communication, vol. 66, pp. 118–129, 2015. [10] Maryam Najafian, Saeid Safavi, Phil Weber, and Martin Russell, “Identification of British English regional accent using fusion of i-vector and multi-accent phonotactic sys-tems,” inProceedings of Odyssey: The Speaker and Lan-guage Recognition Workshop, Bilbao, Spain, 2016. [11] Mark Huckvale, “ACCDIST: a metric for comparing
speakers’ accents,” in Proceedings of the International Conference on Spoken Language Processing, Jeju, Korea, 2004, pp. 29–32.
[12] Mark Huckvale, “ACCDIST: An accent similarity metric for accent recognition and diagnosis,” inSpeaker Classi-fication, C M¨uller, Ed., vol. 2 ofLecture Notes in Com-puter Science, pp. 258–274. Springer-Verlag, Berlin Hei-delberg, 2007.
[13] Abualsoud Hanani, Martin Russell, and Michael Carey, “Human and computer recognition of regional accents and ethnic groups from British English speech,” Computer Speech and Language, vol. 27, pp. 59–74, 2013.
[14] Elizabeth Shriberg, “Higher-level features in speaker recognition,” inSpeaker Classification, Christian Muller, Ed., vol. 1 ofLecture Notes in Computer Science, pp. 241– 259. Springer-Verlag, Berlin Heidelberg, 2007.
[15] Tobias Bocklet and Elizabeth Shriberg, “Speaker recog-nition using syllable-based constraints for cepstral frame selection,” in Proceedings of the International Confer-ence on Acoustics, Speech and Signal Processing, Taiwan, 2009, pp. 4525–4528.
[16] Javier Franco-Pedroso and Joaquin Gonzalez-Rodriguez, “Linguistically-constrained formant-based i-vectors for automatic speaker recognition,” Speech Communication, vol. 76, pp. 61 – 81, 2016.
[17] Taufiq Hasan, Rahim Saeidi, John H. L. Hansen, and David van Leeuwen, “Duration mismatch compensation for i-vector based speaker recognition systems,” in Pro-ceedings of the International Conference on Acoustics, Speech and Signal Processing, Vancouver, Canada, 2013, pp. 7663–7667.
[18] William Haddican, Paul Foulkes, Vincent Hughes, and Hazel Richards, “Interaction of social and linguistic con-straints of two vowel changes in Northern England,” Lan-guage, Variation and Change, vol. 25, pp. 371 – 403, 2013.
[19] Georgina Brown, “Exploring forensic accent recognition using the y-accdist system,” inProceedings of the 16th Australasian International Conference on Speech Science and Technology, Sydney, Australia, 2016, pp. 305–308. [20] V Vapnik,Statistical Learning Theory, Wiley, New York,
1998.
[21] Dominic Watt, Carmen Llamas, Peter French, Almut Braun, and Duncan Robertson, “Forensic aspects of spec-tral and durational variability in English schwa at the in-dividual, community and regional levels,” inPaper pre-sented at the International Association for Forensic Pho-netics and Acoustics conference, York, UK, 2016. [22] John Wells, Accents of English 2, Cambridge University
Press, Cambridge, 1982.
[23] Maciej Baranowski and Danielle Turton, “Manchester English,” in Researching Northern English, Raymond Hickey, Ed., pp. 293–316. John Benjamins, 2016. [24] Dominic Watt, “Phonetic parallels between the close-mid
vowels of Tyneside English: Are they internally or exter-nally motivated,” Language Variation and Change, vol. 12, pp. 69 – 101, 2000.